0160
Tonotopic mapping in the in vivo mouse via high resolution fMRI1Champalimaud Neuroscience Programme, Champalimaud Centre for the Unknown, Lisbon, Portugal
Synopsis
The rodent auditory system has been a popular research subject for electrophysiological studies for its complexity, fine tuning and adaptability. More recently, some studies on auditory Functional Magnetic Resonance Imaging (fMRI) in rats have surfaced, aiming to unravel this system’s intricacies by capturing whole brain activity noninvasively. Auditory mapping in the mouse could be highly valuable given its importance vis-à-vis transgenic models and optogenetics. This study provides the first tonotopic mapping in the in vivo mouse via high resolution fMRI. We demonstrate robust activation in the auditory pathway, and specific tonotopy in several prominent regions along the pathway.
Purpose
Whereas human tonotopy has been extensively studied via fMRI [1-4], rodent tonotopy is still in its infancy. Rat experiments have been recently presented [5-12], but –to our knowledge– auditory mapping in mice has never been performed. We here studied the mouse auditory pathway in-vivo, and in particular, BOLD-derived tonotopic maps.Methods
Sound delivery system: A dedicated system for delivering accurate auditory stimuli was custom designed. Briefly, the system consisted of: (1) a Yamaha AG-03 soundboard allowing playback of sounds up to 96 kHz (sample rate of 192 kHz) with a dynamic range of 24 bits and 2.451 V RMS output before clipping; (2) an in-house designed voltage amplifier capable of a 3x amplification up to 24 Vpp; (3) L010 Kemo piezoelectric speaker capable of producing ultrasonic sounds at high output levels (above 100 dB) with a relatively flat frequency response up to 75 kHz. The emitted sounds were then delivered via custom tubing involving nylon and tygon tubes, interfaced with custom 3D-printed PET parts to a single ear. A Brüel and Kjær 4939-A-011, free-field microphone with a Type 2670 preamplifier was connected directly into the Yamaha Soundboard and placed 1 mm away from the auditory setup to calibrate and test the system’s performance and to record scanner-induced sounds. MRI setup: All experiments were pre-approved by the Institute’s animal ethics committee. Experiments were performed on a Bruker BioSpec 9.4T scanner with a 20 cm bore and gradients capable of producing up to 66 G/cm in all directions. For transmittance, an 86 mm volume resonator was used, whereas a 4-channel array cryocoil was used for signal detection. Male mice (c57bl/6, N=6) weighing approximately 25 gr were briefly anesthetized with 4% isoflurane and then quickly placed under a medetomidine sedation regime (bolus 0.4 mg/kg then 0.8 mg/kg/h, continuous infusion) as described in [13], whereupon the isoflurane was discontinued. Animal physiology including transcutaneous CO2, rectal temperature, and breathing rate were constantly monitored. The animals breathed air enriched with Oxygen (27%) measured by a oxygen Sensor (Viamed, United Kingdom) throughout the experiments. One ear was carefully sealed with wax and the Tygon tube was placed within the other ear, allowing the delivery of auditory stimuli preferentially to that ear. fMRI experiments and analysis: Following localization scans, fMRI experiments were conducted using an ultrafast FISP sequence with the following parameters: TR/TE = 2.8/1.4 ms, slice thickness = 650 μm, FOV = 15x15 mm2, matrix size 100x100 leading to an in-plane resolution of 150x150 (μm)2, and a 1.307 seconds scan time per volume. The fMRI paradigm consisted of 45 seconds of rest, followed by five blocks of {15 seconds of auditory stimulation, 45 seconds of rest}, for a total time of 7.5 min per scan. The auditory stimulus consisted of a pure tone of 5, 12 or 20kHz; animals were allowed to rest between paradigms for ~3 minutes. The data were analyzed using SPM® (called through fMRat [14]) for mapping activation in the mouse brain).Results and Discussion
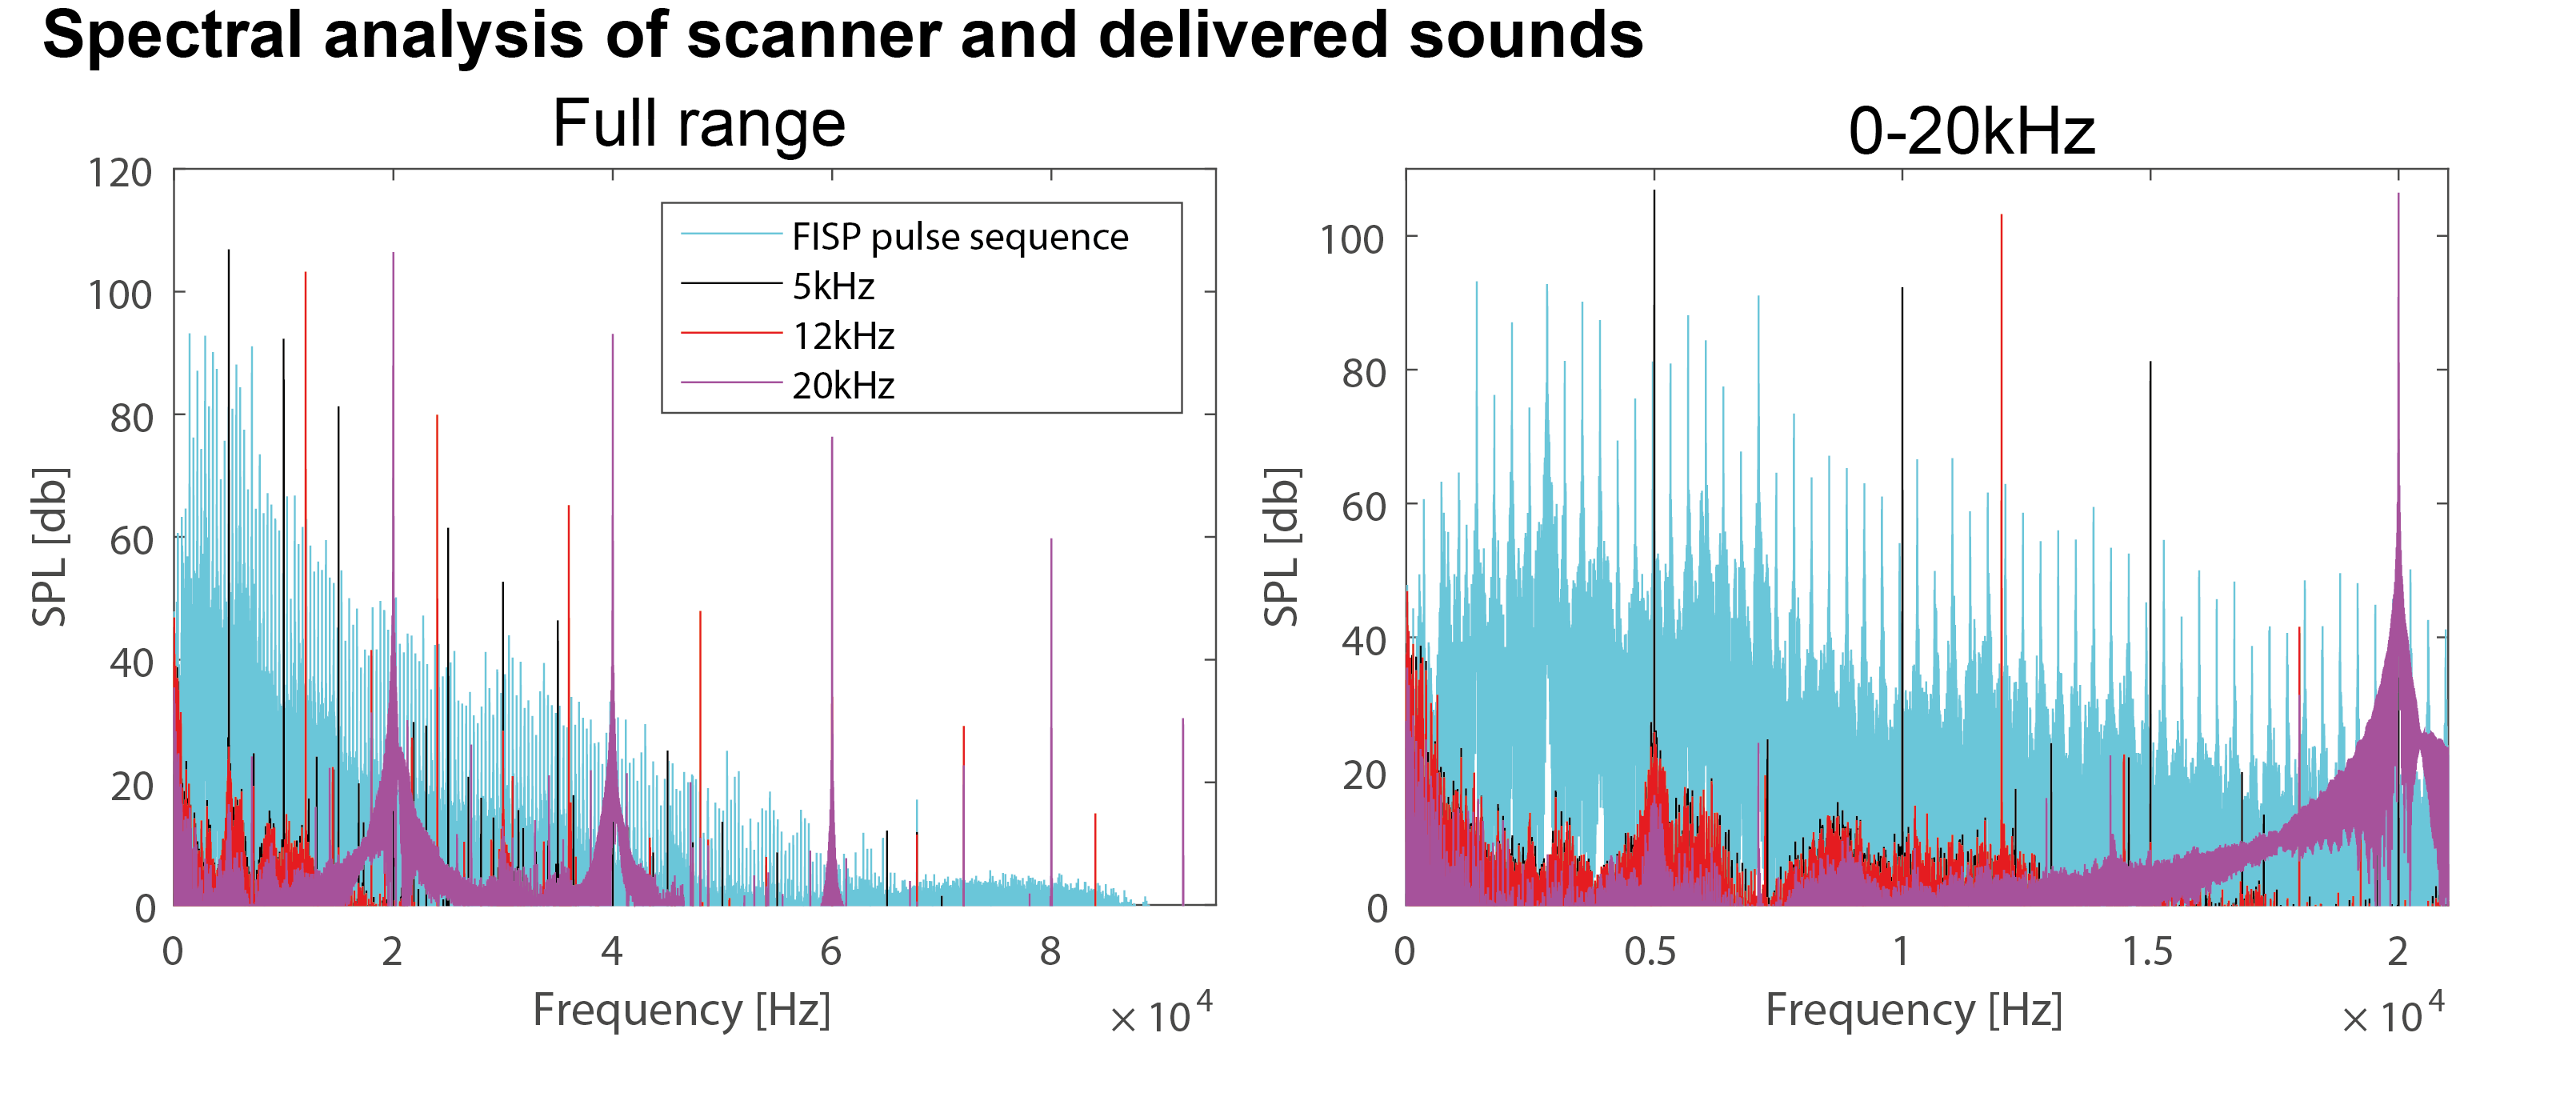
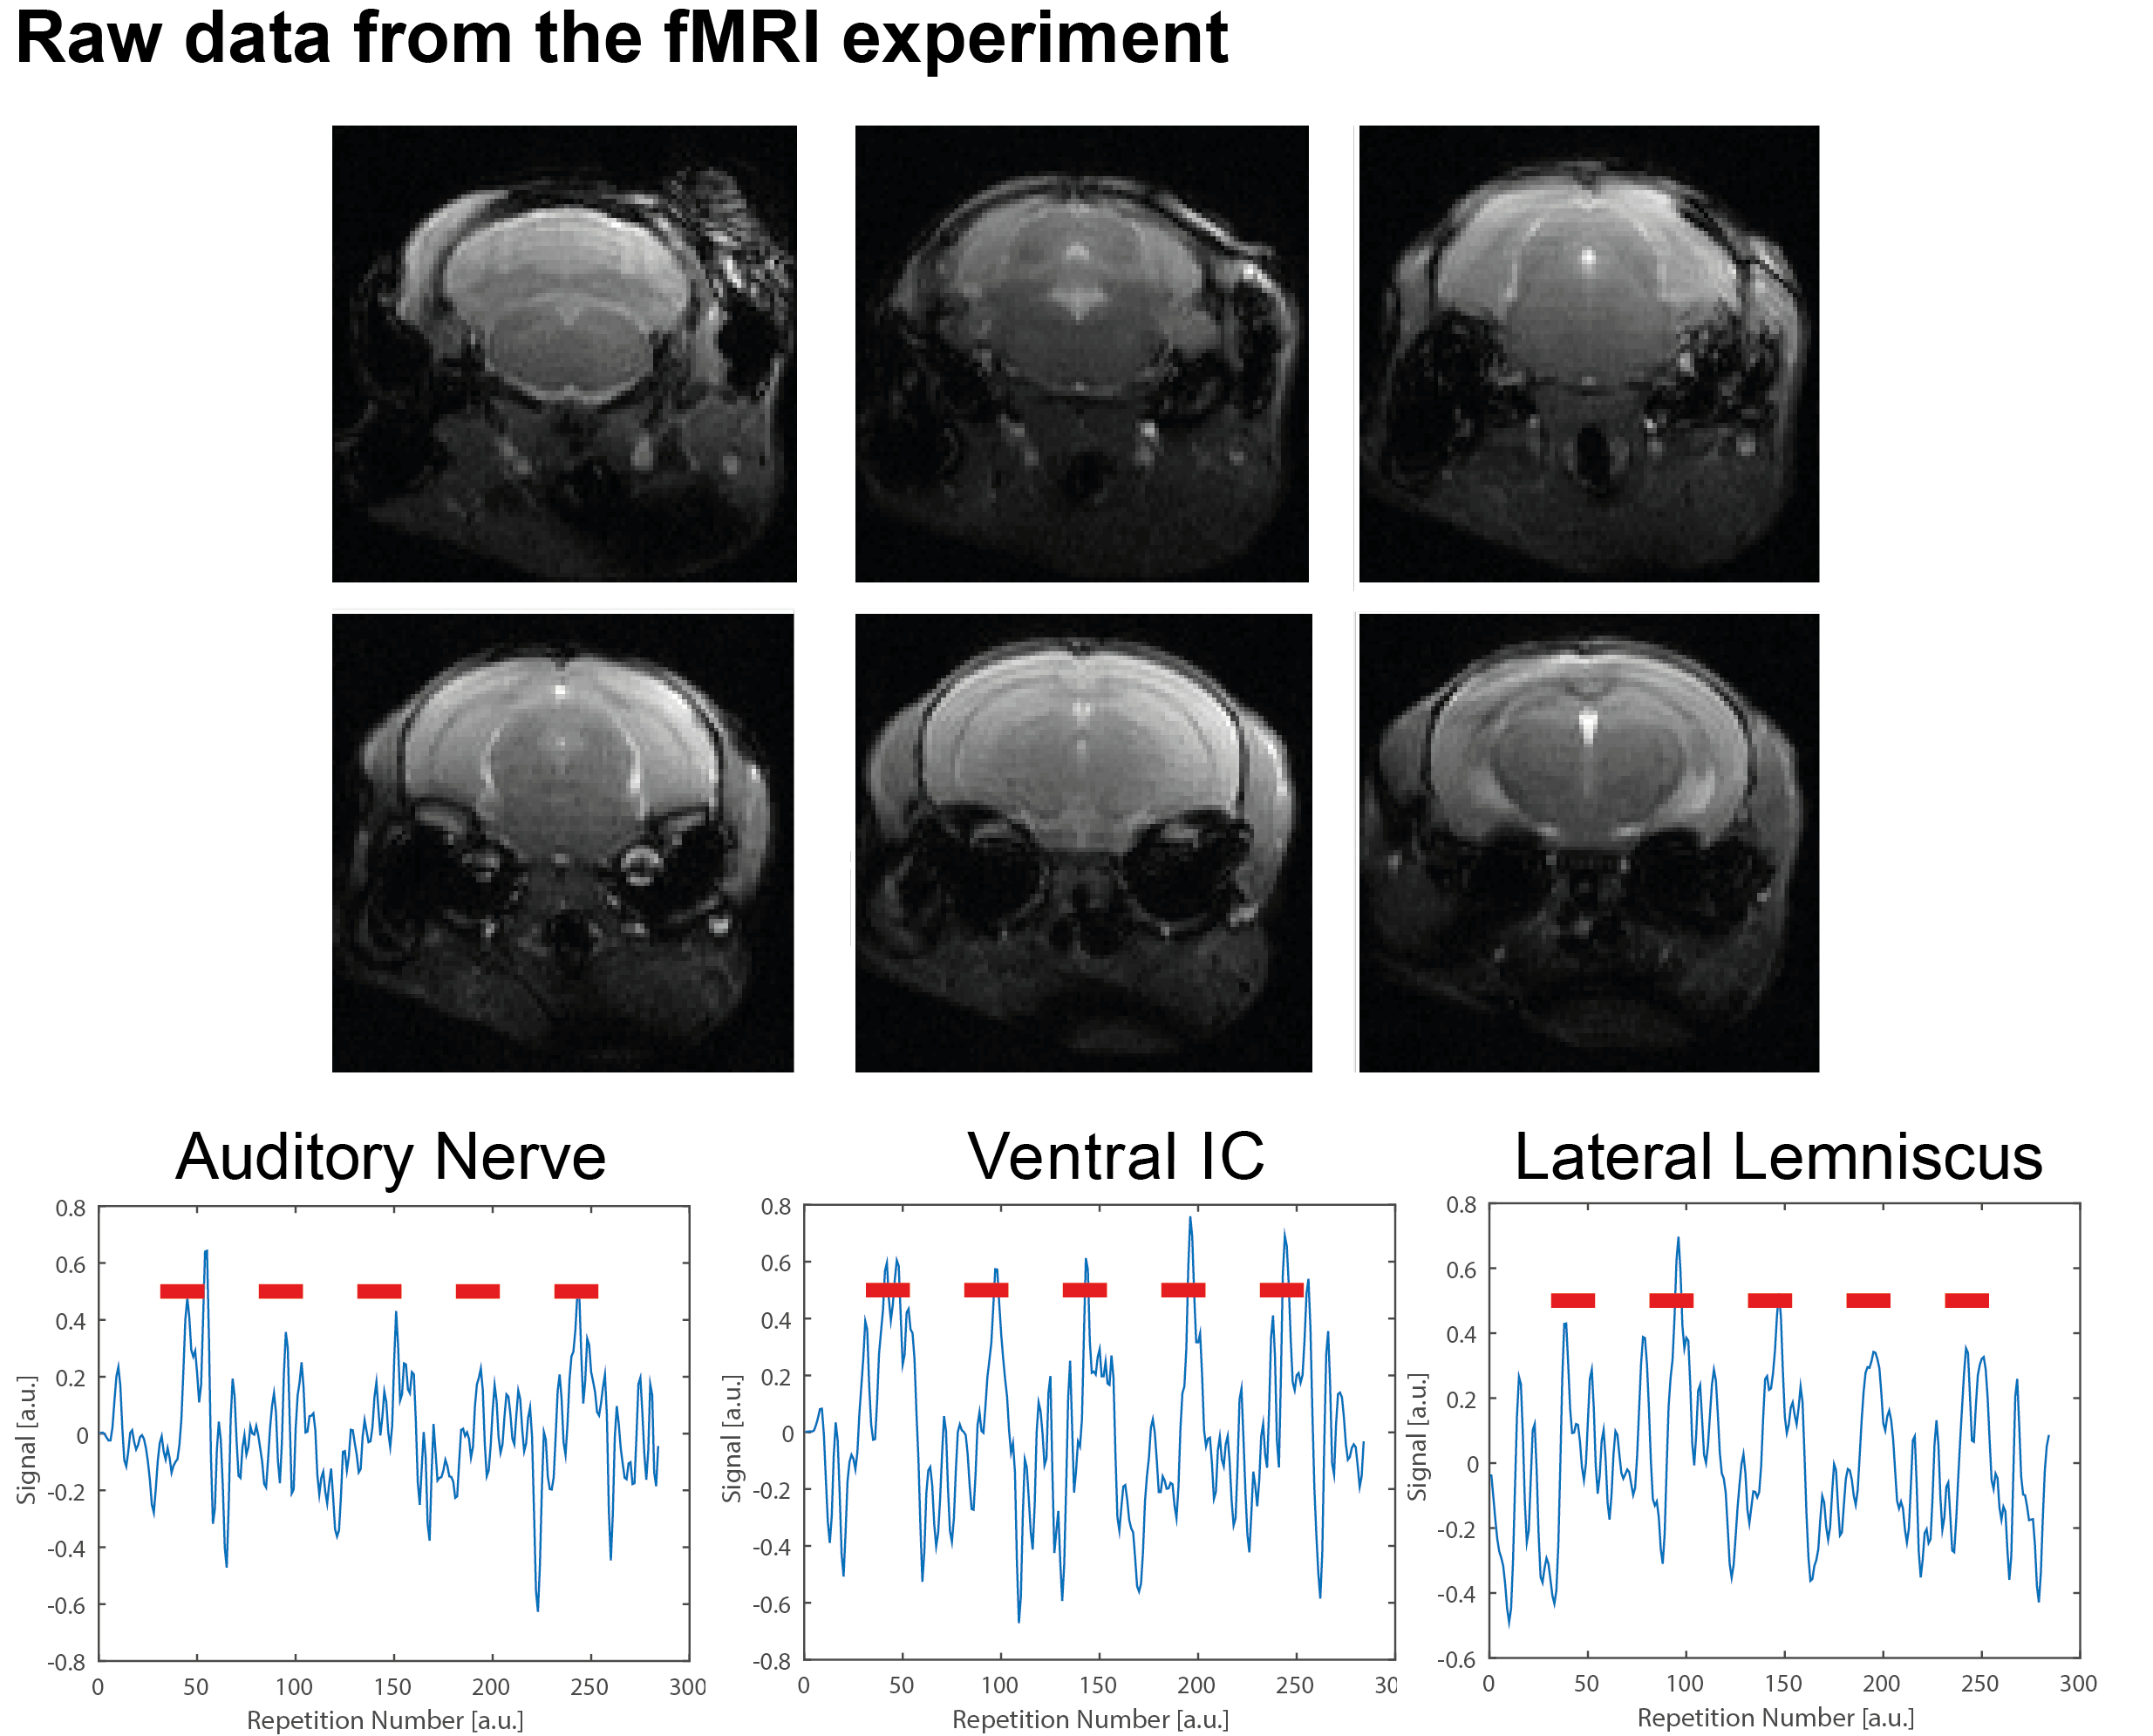
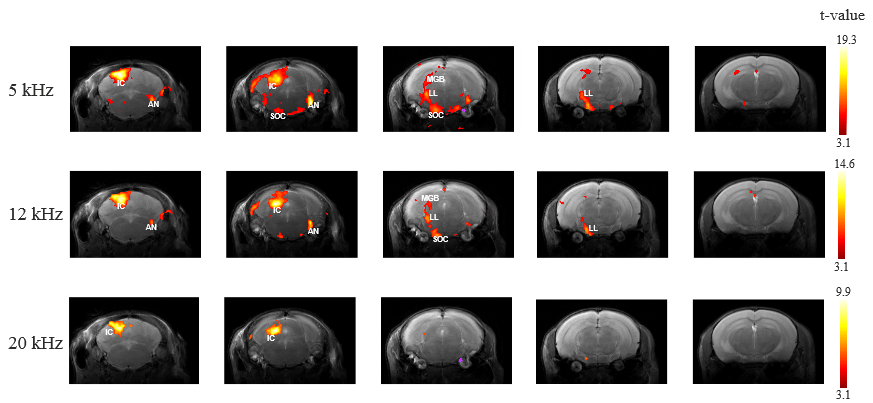
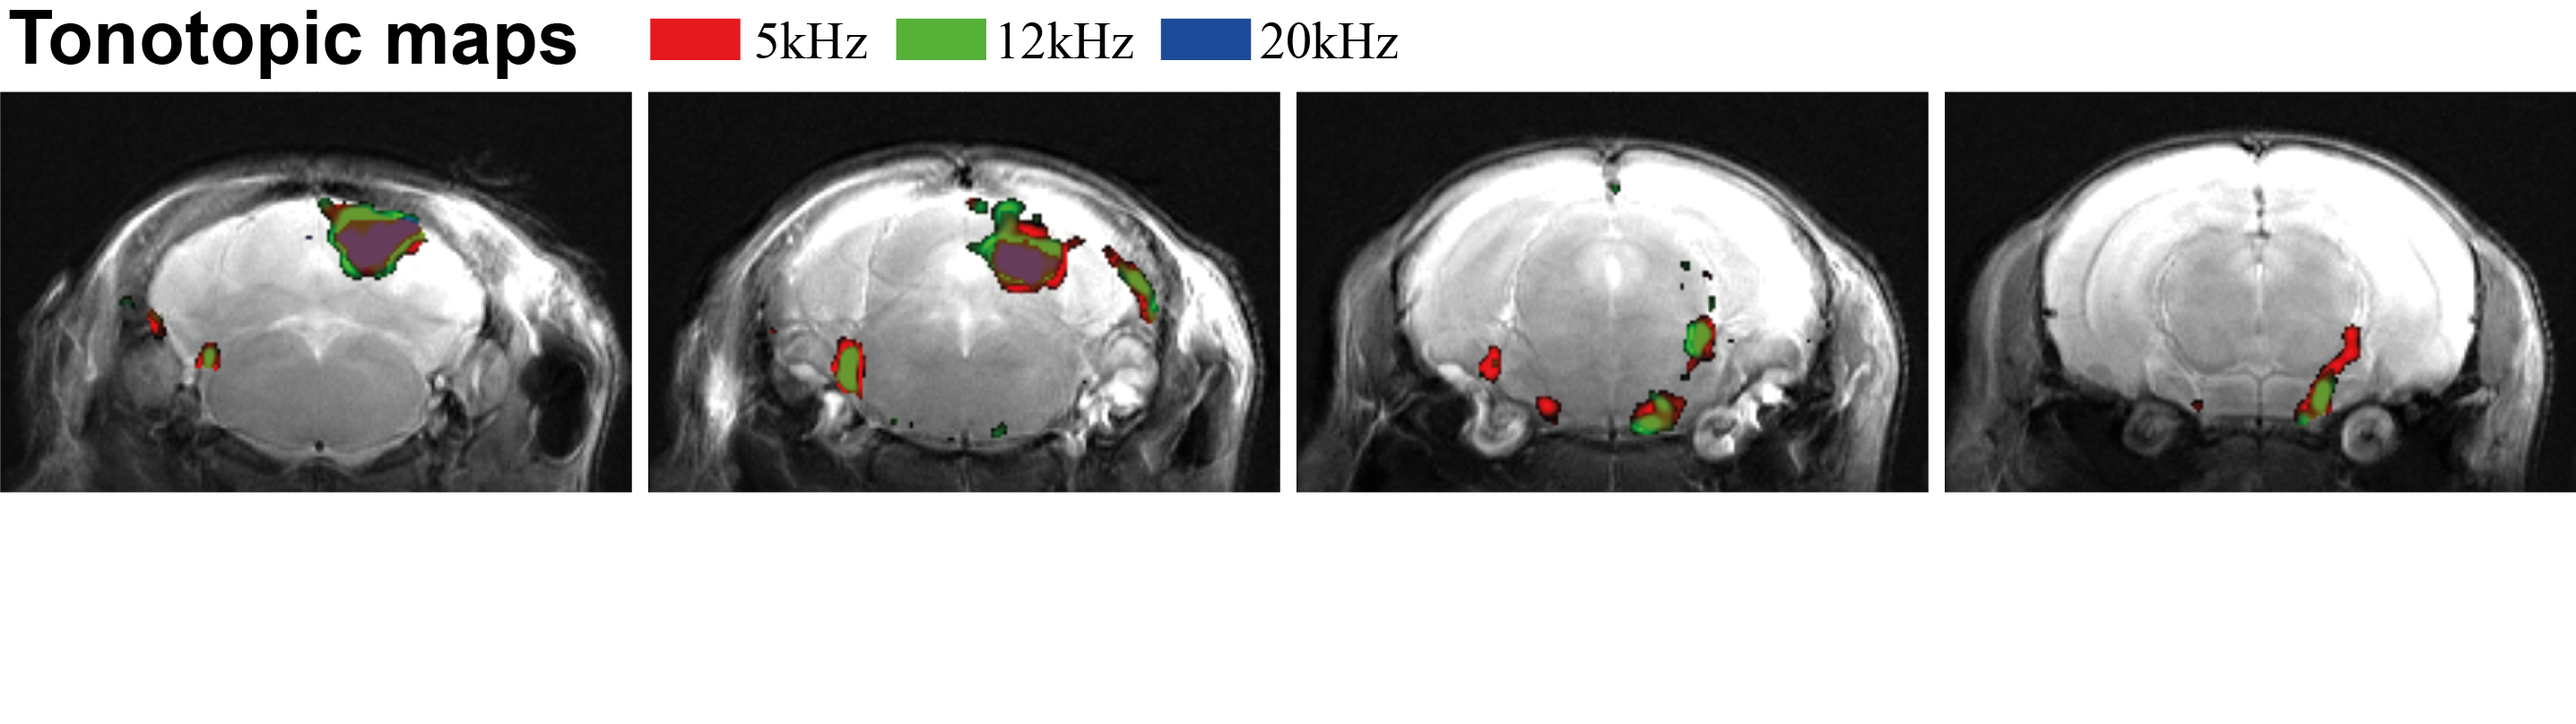
Figure 1 shows the spectral analysis of the FISP sounds as well as the frequencies delivered to the ear of the mouse. The 5kHz stimulation show the most (unwanted) harmonics. The FISP noise, while significant, was still at least 20dB lower compared to the stimuli given, and hence was considered not to significantly affect the experiment. Figure 2 shows raw data from the experiment, including a volume from the FISP experiments (upper panel) and signal time course from a representative experiment (one single run in a single rat) for three selected ROIs within the auditory pathway (lower panel). Excellent SNR was documented, and the BOLD response can be observed with the naked eye. Figure 3 shows t-maps for each frequency; notably, nearly the entire auditory pathway is highlighted, including its major relays: Auditory nerve, Superior Olivary Complex (SOC), Lateral Lemniscus (LL), Inferior Colliculus (IC), and Medial Geniculate Nucleus (MGB), with t-statistics as high as t=19.3. Auditory Cortex (AC) was not demonstrated in these maps, although ROI analysis (not shown) suggests it may be active, but with different BOLD dynamics, thereby reducing its significance levels in Figure 3. Figure 4 shows tonotopic maps in the more posterior slices, where activation was most prominent. Tonotopy was observed in several regions, most notably in IC, where three layers show a clear tonotopic pattern going from dorsolateral regions to medioventral ones with increasing frequency, confirming the electrophysiological findings in mice [15] and fMRI in rats [7]. This study thus bodes well for auditory pathway mapping in the in-vivo mouse in models of plasticity / aberrations.Acknowledgements
The authors acknowledge funding from the European Research Council (ERC) under the European Union’s Horizon 2020 research and innovation programme (Starting Grant, agreement No. 679058). We thank Dr. Daniel Nunes for technical assistance.References
[1] D Ress and B
Chandrasekaran, Tonotopic Organization in the
Depth of Human Inferior Colliculus. Frontiers
in Human Neuroscience, 7:586, 2013.
[2] M Saenz and D.R.M. Langers.
Tonotopic mapping of human
auditory cortex. Hearing Research, 307:42–52, 1 2014.
[3] C Humphries, E
Liebenthal, and JR Binder. Tonotopic
organization of human auditory cortex.
NeuroImage, 50(3):1202–11, 4 2010.
[4] B Wilson,
Y Kikuchi, L Sun, D Hunter, F
Dick, K Smith, A Thiele, TD Griffiths, WD
Marslen-Wilson, and CI Petkov. Auditory sequence processing
reveals evolutionarily conserved
regions of frontal cortex in
macaques and humans. Nature Communications, 6:8901,
2015
[6] C. Lau, M. Pienkowski, J. W. Zhang, B.
McPherson, and E. X. Wu, Chronic exposure to broadband noise at moderate sound
pressure levels spatially shifts tone-evoked responses in the rat auditory
midbrain, NeuroImage, vol. 122, pp. 44–51, 2015.
[7] M. M. Cheung, C. Lau, I. Y. Zhou, K.
C. Chan, J. S. Cheng, J. W. Zhang, L. C. Ho, and E. X. Wu, “BOLD fMRI investigation
of the rat auditory pathway and tonotopic organization,” NeuroImage, vol. 60,
no. 2, pp. 1205–1211, 2012. [8] C. Lau, J. W. Zhang, J. S. Cheng, I. Y.
Zhou, M. M. Cheung, and E. X. Wu, “Noninvasive fMRI Investigation of Interaural
Level Difference Processing in the Rat Auditory Subcortex,” PLoS ONE, vol. 8,
no. 8, 2013.
[9] M. M. Cheung, C. Lau, I. Y. Zhou, K.
C. Chan, J. W. Zhang, S. J. Fan, and E. X. Wu, High fidelity tonotopic mapping
using swept source functional magnetic resonance imaging, NeuroImage, vol. 61,
no. 4, pp. 978–986, 2012.
[10] P. P. Gao, J. W. Zhang, J. S. Cheng,
I. Y. Zhou, and E. X. Wu, “The inferior colliculus is involved in deviant sound
detection as revealed by BOLD fMRI,” NeuroImage, vol. 91, pp. 220–227, 2014.
[11] P. P. Gao, J. W. Zhang, S. J. Fan, D.
H. Sanes, and E. X. Wu, “Auditory midbrain processing is differentially
modulated by auditory and visual cortices: An auditory fMRI study,” NeuroImage,
vol. 123, pp. 22–32, 2015.
[12] P. P. Gao, J. W. Zhang, R. W. Chan,
A. T. L. Leong, and E. X. Wu, BOLD fMRI study of ultrahigh frequency encoding
in the inferior colliculus,” NeuroImage, vol. 114, pp. 427–437, 2015.
[13] F. Schlegel, A. Schroeter, and M.
Rudin, The hemodynamic response to somatosensory stimulation in mice depends on
the anesthetic used: Implications on analysis of mouse fMRI data, NeuroImage,
vol. 116, pp. 40–49, 2015.
[14] C. Chavarrías, V. García-Vázquez, Y.
Alemán-Gómez, P. Montesinos, J. Pascau, and M. Desco, fMRat: an extension of
SPM for a fully automatic analysis of rodent brain functional magnetic
resonance series, Medical & Biological Engineering & Computing, vol.
54, no. 5, pp. 743–752, 5 2016.
[15] D. K. G.Malmierca, M. S. Ryugo,
“Auditory System,” in The Mouse Nervous System, 1st ed., C.Watson, G. Paxinos,
and L. Puelles, Eds., 2012, no. 1, ch. Auditory S, p. 607–645.
Figures