0158
Frequency signature of cortical laminar fMRI1Max Planck Institute for Human Cognitive and Brain Sciences, Leipzig, Germany, 2Donders Centre for Cognitive Neuroimaging, Nijmegen, Netherlands, 3NIMH, Bethesda, MD, United States
Synopsis
The nature of spontaneous oscillations in the blood oxygenation level dependent (BOLD) response is in the focus of current research. For resting-state network studies, the low-frequency band (0.01-0.1 Hz) is usually taken to be relevant for neuronal activity. However, this statement is based on low-resolution functional data, where the effect of the draining vasculature cannot always be characterized. This study investigates the distribution of the amplitude of resting-state BOLD fluctuations using a sub-millimeter resolution and shows that the low-frequency band is dominating at all cortical depths, but most of its power is located at the pial surface.
Purpose
Frequency and amplitude characteristics of the blood oxygenation level dependent (BOLD) response across cortical layers are increasingly being studied, both with fMRI1,2 and EEG.3 The characterization of the frequency signature across depths in gray matter is of particular interest for resting-state studies, since resting-state networks are claimed to be low-frequency networks4. However, this statement is based on low-resolution considerations and could be challenged by high-resolution studies. In fact, the exchange of oxygen and glucose takes place in the capillary bed and elicits changes in cerebral blood flow (CBF), cerebral blood volume (CBV), and the cerebral metabolic rate of oxygen (CMRO2), which give rise to the BOLD effect. As the blood is carried downstream and the vessel network converges to the closest draining vein, an integration of signal fluctuations coming from different capillary beds takes place. The vascular network could then potentially function as a low pass filter, with higher frequency oscillations found at the capillary bed, and lower frequencies in the downstream vasculature.Materials & Methods
Acquisition: N=10 participants took part in the study. The acquisition consisted of a 27-min resting-state scan (split up into three 9-min scans). All data were acquired on a Siemens MAGNETOM 7T scanner (Siemens Healthcare, Erlangen, Germany) using a 3D gradient-echo EPI sequence at a nominal in-plane resolution of 0.8×0.8 mm² and slice thickness of 1.5 mm. Imaging focused on the hand-knob of the primary motor cortex of one hemisphere with the acquisition of 16 slices (one slab) perpendicular to the cortical surface. The following parameters were used: TE = 30 ms, volume TR = 1.008 s, 1620 measurements (split up into 3 runs of 540 measurements each), partial Fourier = 6/8, GRAPPA acceleration factor PE = 4, bandwidth = 782 Hz/Px, no CAIPIRINHA. Cardiac and respiratory traces were recorded using a pulse oximeter and respiratory bellow provided by Siemens.
Methods: All datasets were corrected for physiological noise using RETROICOR (AFNI, http://afni.nimh.nih.gov/afni), for rigid body motion (SPM8, http://www.fil.ion.ucl.ac.uk/spm) and for signal drift. Grand mean scaling was applied prior to concatenation of the three resting-state runs of each participant. Layering was done using an equivolume approach, similarly as previously described1,5. The voxel-wise power-spectrum was obtained using the pspec command of the fslmath library (FSL, http://www.fmrib.ox.ac.uk/fsl) and then averaged over each lamina. The amplitude of frequency fluctuations was calculated for each lamina similarly as for the fractional amplitude of low-frequency fluctuations (fALFF)6, with the difference that the high frequencies were not excluded and that the scaling factor was the band 0.15-0.25 Hz, which should not be strongly affected by physiological noise.
Results
One dataset was excluded due to suboptimal slice orientation. The temporal SNR in the primary motor cortex was found to be between 10 and 15. The profile of the fractional amplitude of resting-state fluctuations was obtained and different frequency bands were considered. Figure 1 shows the whole-band fractional amplitude divided into bins of width 0.1 Hz. Figure 2 shows the low-frequency band (0.01-0.15 Hz) divided into bins of width 0.025 Hz. Figure 3 shows the high-frequency band (0.1-0.45 Hz) divided into bins of width 0.075 Hz. The low-frequency fractional amplitude brain map of a representative participant is shown with no threshold (Fig.4, left) and with an arbitrary chosen threshold (Fig. 4, right), to highlight its specificity to the pial veins.Discussion & Conclusion
The profile of the fractional amplitude of resting-state fluctuations (Fig. 1) shows that the low-frequency band (0.01-0.1 Hz) dominates at all depths, peaking at the pial surface and decaying with depth. This feature was observed for each individual participant and is not a result of the averaging. Figure 2 shows that the curve starts flattening out for frequencies equal or higher than 0.1 Hz. The high-frequency band (Fig. 3) is not significantly different from a flat curve, indicating that (in this band) there is no frequency signature of a specific layer (for example layer V, which is the most prominent layer in the primary motor cortex).
This study shows that the dominant part of the low frequency fluctuations corresponds to the pial surface, which is located away from the site of the dominant metabolic activity. Elimination of the pial frequency contribution through band-pass filtering is not straightforward, as this would probably also eliminate the neuronal component contained in the BOLD signal within the gray matter.
Acknowledgements
We would like to thank Dr. Benedikt Poser for providing the sequence and support, Zahra Fazal for providing help with RETROICOR, Dr. Rasim Boyacioglu for performing a comparative analysis, Olivia Viessmann for help with the preprocessing of resting-state data. MG was supported by the Initial Training Network, HiMR, funded by the FP7 Marie Curie Actions of the European Commission (FP7-PEOPLE-2012-ITN-316716).
References
[1] Guidi M, et al. Lamina-Dependent Calibrated BOLD Response in Human M1. NeuroImage 2016;41:250-61.
[2] Polimeni J, et al. Cortical depth dependence of physiological fluctuations and whole-brain resting-state functional connectivity at 7T. Proc ISMRM 2015;23:592.
[3] Scheeringa R, et al. The relationship between oscillatory EEG activity and the laminar-specific BOLD signal. Proceedings of the National Academy of Sciences 2016;201522577.
[4] Biswal B, et al. Functional connectivity in the motor cortex of resting human brain using echo-planar mri. Magnetic resonance in medicine 1995;34.4:537-541.
[5] Huber L, et al. Cortical lamina-dependent blood volume changes in human brain at 7T. NeuroImage 2015;107:23-33.
[6] Zou Q, et al. An improved approach to detection of amplitude of low-frequency fluctuation (ALFF) for resting-state fMRI: fractional ALFF. Journal of neuroscience methods 2008;172.1:137-141.
Figures

Figure 1. The fractional amplitude of resting-state fluctuations is obtained as a function of depth for four frequency bins: 0.01-0.1 Hz (red), 0.1-0.2 Hz (green), 0.2-0.3 Hz (blue), 0.3-0.4 Hz (yellow).
Lamina 1: pial surface, lamina 25: white matter.
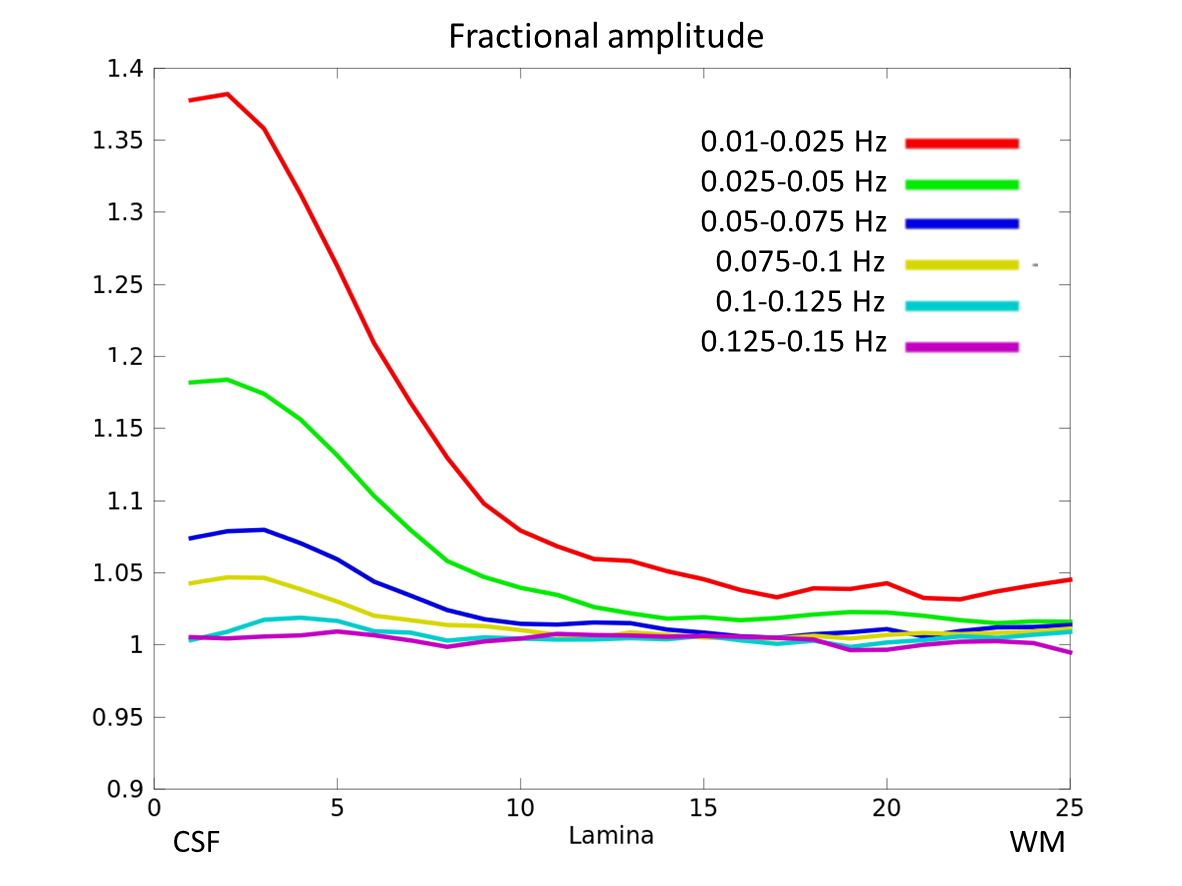
Figure 2. Low-frequency band. The fractional amplitude of resting-state fluctuations is displayed as a function of depth for the low frequency band 0.01-0.15 Hz, split up into 0.025 Hz-wide sub-bands.
Lamina 1: pial surface, lamina 25: white matter.
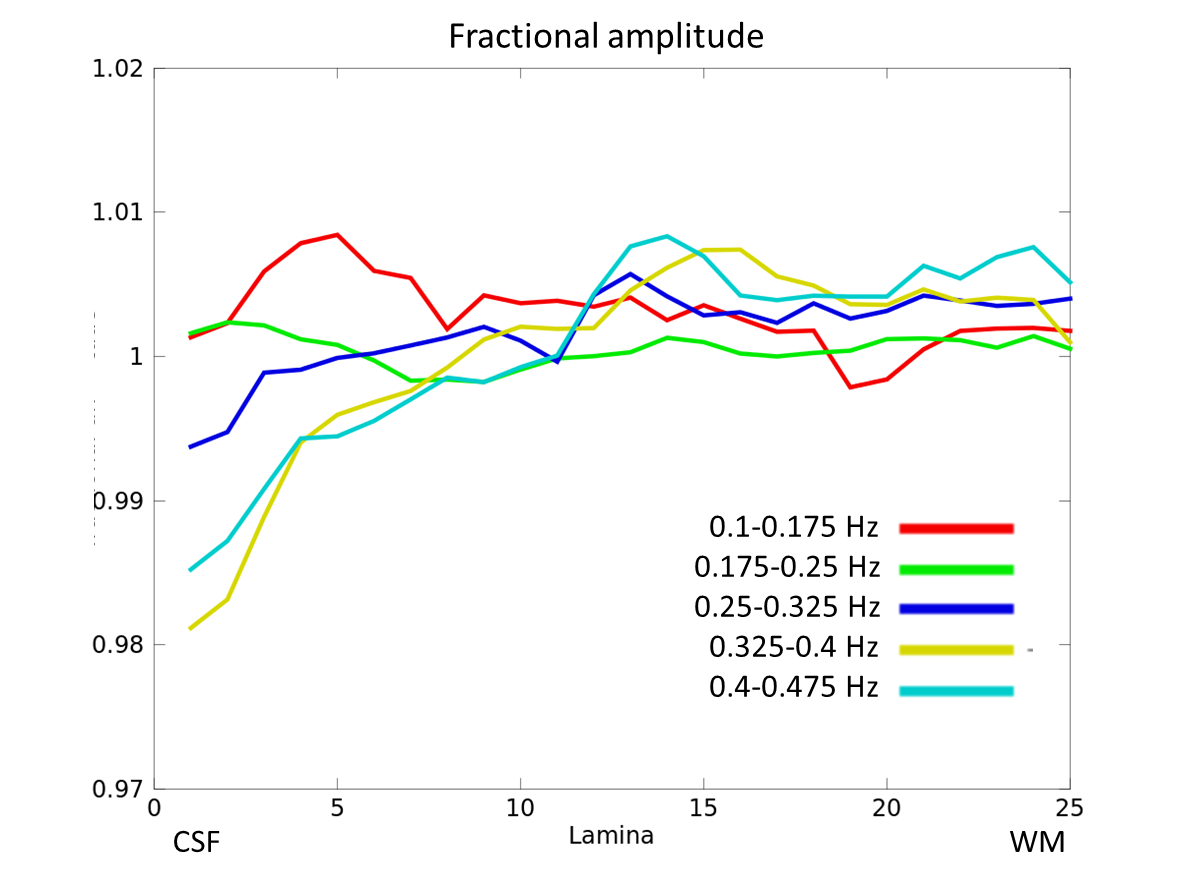
Figure 3. High-frequency band. The fractional amplitude of resting-state fluctuations is displayed as a function of depth for the high frequency band 0.1-0.45 Hz, split up into 0.075 Hz-wide sub-bands.
Lamina 1: pial surface, lamina 25: white matter.
