0157
An in vivo study of BOLD laminar responses as a function of echo time and magnetic field1Donders Centre for Cognitive Neuroimaging, Nijmegen, Netherlands, 2Erwin L. Hahn Institute for Magnetic Resonance Imaging, Essen, Germany
Synopsis
In this study we evaluate the echo time of laminar BOLD responses of the human primary visual cortex at 1.5 and 7T. It is often assumed that lower magnetic field strengths are increasingly biased towards the signal arising from larger veins located towards the pial surface. In this study (performed with an isotropic resolution of 0.75mm) we found similar shaped laminar profiles at 1.5 and 7T.
INTRODUCTION
7T has become the gold standard for measuring high-resolution BOLD fMRI, including layer specific studies, due to its increased functional sensitivity and SNR compared to lower field strengths. Despite this increase in SNR, most layer specific data analysis are performed by integrating the signal from voxels at a given cortical depth over an extended patch of cortex 1,2. Such a framework compensates for the poorer SNR often associated with high resolution and opens the door for using lower field strengths in layer specific fMRI. In this work we compare activation profiles obtained at 1.5T and 7T to study the feasibility of layer specific fMRI at 1.5T. The results here are also relevant for non-layer specific functional studies, as they provide a better understanding of how much of the signal comes directly from the parenchyma and how much from the pial surface at each of the fields.METHODS
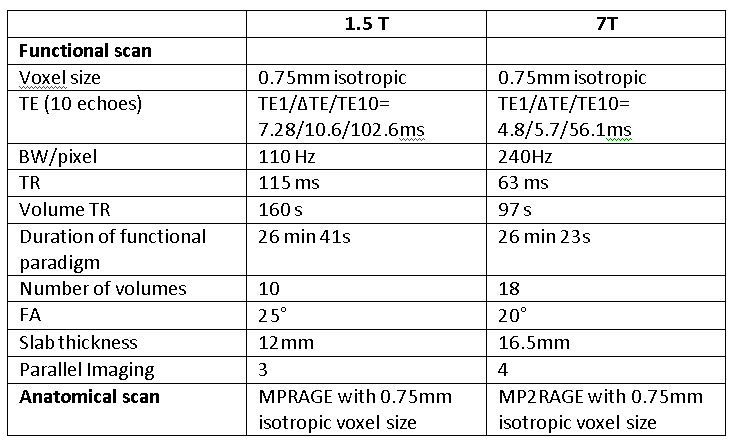
Acquisition: Data from the same 4 subjects were acquired at 1.5T and 7T using multi-echo 3D-FLASH with parameters, e.g. voxel size and echo spacing/range, matched, as far as possible, to minimize anatomical differences in the functional data between fields (see Table 1 for sequence parameters). A flickering checkerboard interleaved with a gray screen was used as stimulus paradigm and the duration of each stimulus condition was one volume TR (160 at 1.5T and 97 s at 7T).
Data processing: Functional volumes were skull stripped using FSL-BET, motion corrected with AFNI using a linearised weighted least squares algorithm and high-pass filtered with fc=1/2.1*volTR. The anatomical volume was co-registered to the first functional scan using a boundary based registration method implemented in Freesurfer. Finally, activation maps were obtained using FSL-FEAT on the motion corrected data applying a 3 mm smoothing kernel. The white matter surface generated in Freesurfer was expanded by 10% of the cortical depth at each vertex to sample the functional volume3. Signal time-courses were averaged over the areas that showed activation at each of the 15 cortical depths and T2* values were computed by fitting to a mono-exponential decay.
RESULTS
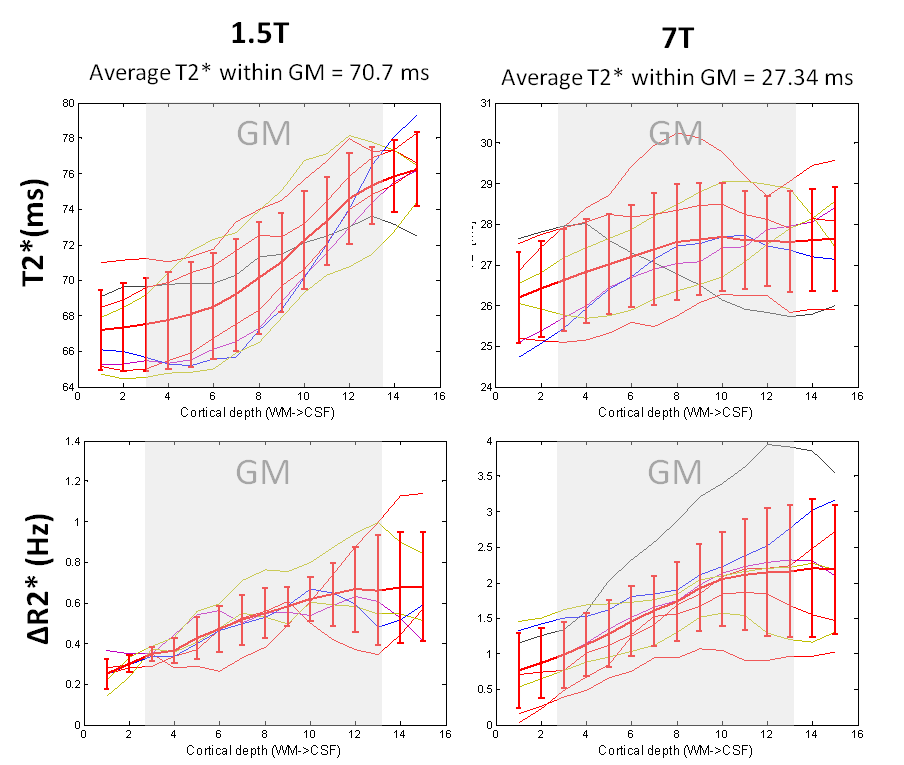
The small voxel size used in this study allows the estimation of T2* relaxation times that suffer less from partial voluming between GM and adjacent tissue and CSF. The average T2* values obtained are in line with what is reported in the literature4,5,6 (Figure 1a,b) .
Although the shape of the resting T2* across the cortex is different between B0=1.5T and B0=7T, the shape of ΔR2*, difference between the activated and rested condition, is comparable between the fields (Figure 1c,d) The ratio of the ΔR2* between fields corresponds to the ratio of the two field strengths on the pial surface, indicating, that ΔR2* varies linearly with field7.
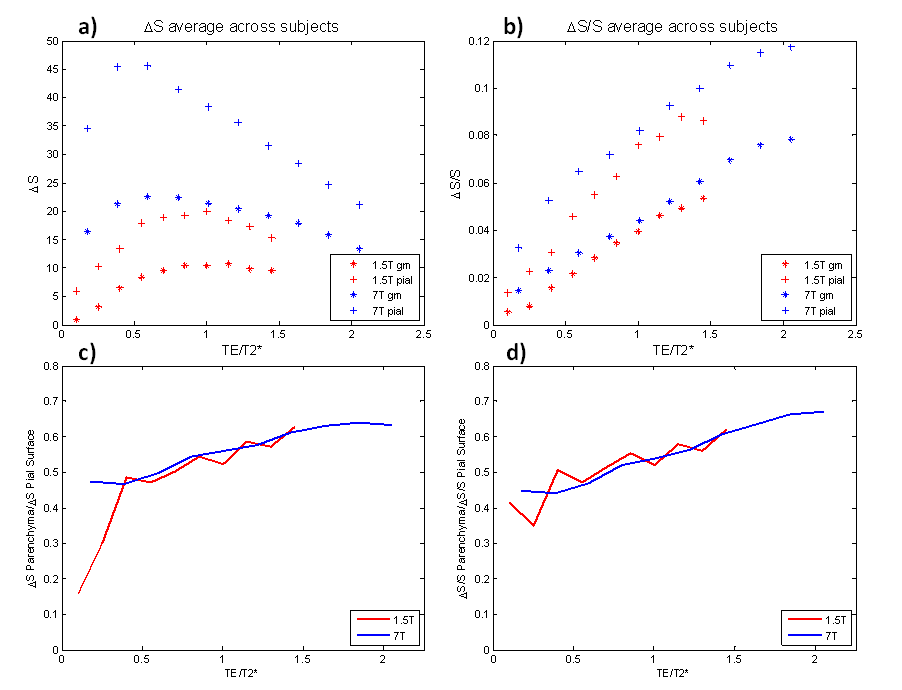
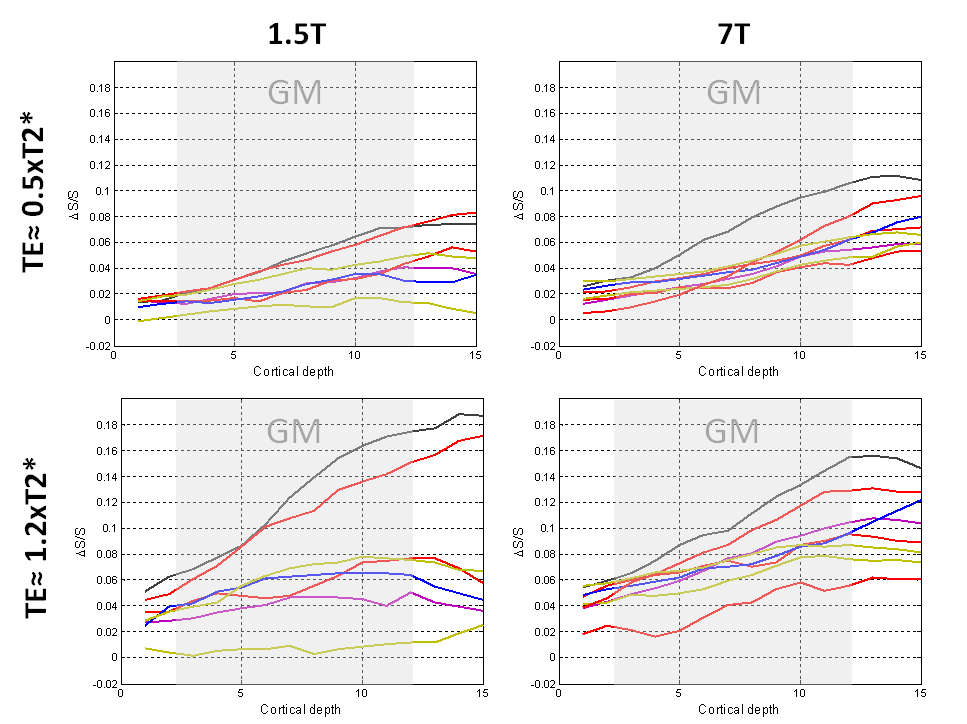
The ratio of the signal change in the parenchyma to signal change on the pial surface is TE-dependent and it increases with TE, suggesting more bias towards the pial surface activity for shorter echo times, although the relative contribution around commonly used echo times (approximating the T2* of grey matter) is very similar (Figure 2a,c). This is also the case for the normalized signal change (Figure 2b,d). At comparable TEs the ∆S/S within the parenchyma is similar in magnitude between 1.5T and 7T (Figure 2b), as predicted by 8 in simulations , but the ∆S/S cortical profiles obtained at the single subject level are noisier (Figure 3).
DISCUSSION
The results shown here indicate that the laminar features of the average BOLD signal change upon functional activation are comparable between 1.5T and 7T: the signal profiles and the relative contribution from the pial surface and the gray matter between these fields are similar at equivalent TEs.
The profiles at the single subject level are, as is to be expected, noisier at 1.5T. Plausible explanations would be that the signal averaging across the cortex does not fully compensate for the poorer SNR at 1.5T and the reduced number of trials (5 and 9, at 1.5T and 7T respectively) that could be obtained in the same amount of time. However, there are also non field related factors that can influence noisier profiles such as the goodness of the anatomical to functional co-registration, and the amount of motion and performance of the motion correction algorithm. In our datasets, both were better at 7T due to superior WM/GM contrast and slightly reduced motion at 7T owing to the tighter fitting head coil.
Acknowledgements
This work was supported by the Initial Training Network, HiMR, funded by the FP7 Marie Curie Actions of the European Commission (FP7-PEOPLE-2012-ITN-316716).References
[1] Koopmans, P.J. et al., 2011. Multi-echo fMRI of the cortical laminae in humans at 7 T. NeuroImage, 56(3), pp.1276–85.
[2] Goense, J.B.M., Zappe, A.-C. & Logothetis, N.K., 2007. High-resolution fMRI of macaque V1. Magnetic resonance imaging, 25(6), pp.740–7.
[3] Polimeni, J.R. et al., 2010. Laminar analysis of 7T BOLD using an imposed spatial activation pattern in human V1. NeuroImage, 52(4), pp.1334–46.
[4] Cox, E. & Gowland, P., 2008. Measuring T2 and T2’ in the brain at 1.5T, 3T and 7T using a hybrid gradient echo-spin echo sequence and EPI. Proceedings 16th Scientific Meeting, International Society for Magnetic Resonance in Medicine, Toronto, p.1411.
[5] Gati, J.S. et al., 1997. Experimental determination of the BOLD field strength dependence in vessels and tissue. Magnetic Resonance in Medicine, 38(2), pp.296–302.
[6] Yacoub, E. et al., 2001. Imaging Brain Function in Humans at 7 Tesla. , 594(September 2000), pp.588–594.
[7] van der Zwaag, W. et al., 2009. fMRI at 1.5, 3 and 7 T: characterising BOLD signal changes. NeuroImage, 47(4), pp.1425–34.
[8] Uludag, K., Müller-Bierl, B. & Ugurbil, K., 2009. An integrative model for neuronal activity-induced signal changes for gradient and spin echo functional imaging. NeuroImage, 48(1), pp.150–65.
Figures