0156
Empirical Mode Decomposition and Frequency Characteristics of the Default Mode Network on Group fMRI Resting-State Data1Cleveland Clinic Lou Ruvo Center for Brain Health, LAS VEGAS, NV, United States, 2University of Colorado Boulder, Boulder, CO, United States, 3University of Management & Technology, Lahore, Pakistan
Synopsis
In this project, high-frequency contributions to functional connectivity of the Default Mode Network (DMN) are studied. Rather than relying on user-defined frequency bands, Empirical Mode Decomposition (EMD) is used to decompose the natural occurring frequency bands of the DMN. The novelty of our approach lies in the data-adaptive and user-independent decomposition of fMRI data using EMD, and identification of a resting-state network based on the frequency characteristics of intrinsic modes in the data, instead of using wavelet- or windowed-Fourier-transform methods. Results are shown for multiband MB8 resting-state data of a group of 22 healthy subjects.
INTRODUCTION
Analysis of functional networks in resting-state data were traditionally obtained by using low-pass-filtered data with frequencies in the range 0.01Hz to 0.1Hz1. Recently, it was argued that high frequencies above 0.1Hz may also contribute to functional connectivity in resting-state data2,3. To shed more light on this phenomenon, we acquired 30min resting-state data from 22 subjects by using a high sampling rate allowing to investigate the frequency content up to 0.65Hz. Rather than relying on user-defined frequency bands, we use Empirical Mode Decomposition (EMD)4 to study the natural occurring frequency bands of the DMN. The novelty of our approach lies in the data-adaptive and user-independent decomposition of fMRI data using EMD, and identification of resting-state networks based on the frequency characteristics of intrinsic modes in the data, instead of using wavelet- or windowed-Fourier-transform methods.METHODS
Functional MRI was performed on 22 (age 18-25) healthy subjects in a 3T Trio Tim Siemens MRI scanner equipped with a 32channel head coil using multiband EPI with imaging parameters: MB8, TR 765ms, TE = 30ms, flip 44deg, partial Fourier 7/8 (phase), FOV = 19.1 x 14.2 cm, 80 slices in oblique axial orientation, resolution 1.65mm x 1.65mm x 2mm, BW =1724 Hz/pixel (echo spacing = 0.72ms), 2380 time frames (30min scanning duration). Due to the short TR, no slice-timing correction was performed. The usual preprocessing steps included field-map-based distortion correction, realignment, spatial smoothing (8mm), and normalization to the MNI 152 template using ANTS software (http://stnava.github.io/ANTs/). All voxels were resampled to a 2mm x 2mm x2mm grid. Obtained motion parameters were less than 0.6mm on average in all directions (and equivalently the parameters for rotations). Group ICA (based on the FastICA algorithm5) was performed by stacking all data in the temporal domain to obtain the major resting-state networks. Using spatial regression of the found DMN network on the group time series data, the group time series signature of the DMN was obtained. The DMN group time signature was decomposed using EMD, which allows a signal being partitioned into its intrinsic modes of oscillation, called intrinsic mode functions (IMFs), without any assumptions of stationarity or linearity, or imposition of a priori assumptions on frequencies of interest. The IMF with index 1 (IMF 1) contains the highest frequencies, and IMF k contains the lowest frequency components. It has been shown that the frequency arrangement in IMFs mimics that of a dyadic filter bank. After the group IMFs were obtained, the corresponding group spatial maps were calculated by regression of each individual IMF on the original stacked group data. The obtained group spatial maps resembled the spatial characteristics of each IMF. To obtain instantaneous frequency characteristics, the Hilbert Huang Transform (HHT) was applied on each IMF. The spectrum of each IMF was obtained with standard kernel density estimation algorithm in Matlab to study the frequency characteristics of each IMF.RESULTS
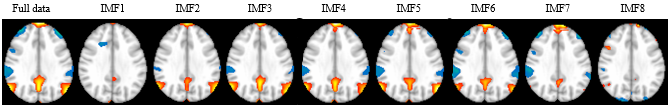
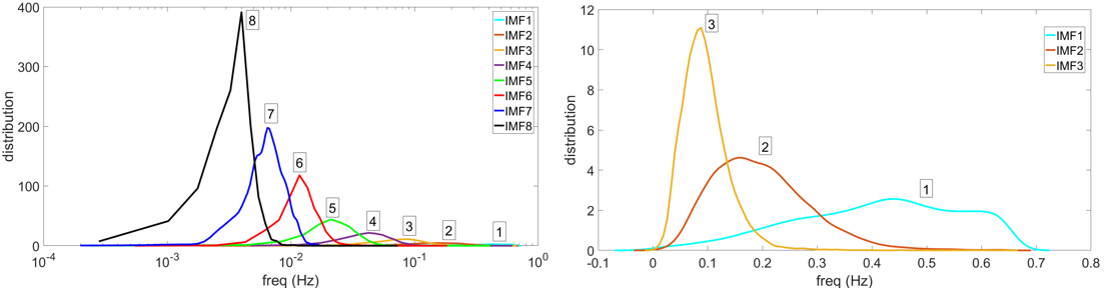
Fig.1 shows one slice of the spatial map for the DMN obtained by group ICA and the decomposition maps of the full data into maps belonging to 8 IMFs. The DMN can be reliably identified in IMFs 2 to 6. Fig.2 shows the frequency spectra of the obtained IMFs. Note that each IMF corresponds to a frequency band which partially overlaps with bands from neighboring IMFs. Peak frequencies and effective range (FWHM) of the first 3 high-frequency IMFs are given by 0.43Hz (0.64Hz-0.22Hz), 0.16Hz (0.28Hz-0.08Hz), and 0.088Hz (0.122Hz-0.047Hz), respectively.DISCUSSION
The frequency range where the DMN could be reliably identified was found to be in the range 0.01Hz to 0.28Hz covered by IMFs 2 to 6 for the group data. In the frequency range above 0.28Hz which is essentially covered by IMF 1, no pattern resembling the DMN could be identified. IMF 1 appears to be a wide spectrum noise component which may be used in denoising fMRI data. We found that with increasing frequency range, the DMN pattern for IMFs 2 to 6 shows only minor changes in the positive (yellow colored) pattern. Regarding negative changes (blue colored), most changes are observed in the high frequency range between IMF2 and IMF3.CONCLUSION
We have studied the frequency dependence of the DMN in group fMRI resting-state data using EMD. Given our sampling rate (TR 0.765s) we were able to show that the DMN could be reliably found in 5 different frequency bands covered by IMF 2 to IMF 6 which covered an effective frequency range up to 0.28Hz.Acknowledgements
The study was supported in parts by National Institute of General Medical Sciences (grant: P20GM109025) and National Institute of Biomedical Imaging and Bioengineering (grant: 1R01EB014284).References
[1] Cordes D, et al. Frequencies contributing to functional connectivity in the cerebral cortex in resting-state data. AJNR 2001, 22:1326-1333.
[2] Niazy RK, et al. Spectral characteristics of resting-state networks. Prog. Brain Res. 2011, 193:259-276.
[3] Chen JE, Glover GH. BOLD fractional contribution to resting-state functional connectivity above 0.1Hz. NeuroImage 2014, 107:207-218,
[4] P. Flandrin, et al. Empirical mode decomposition as a filter bank, IEEE Sig. Proc. Letters 2004, 11(2), 112-114.
[5] Hyvärinen A. Fast and Robust Fixed-Point Algorithms for Independent Component Analysis. IEEE Transactions on Neural Networks 1999, 10(3):626-634.
Figures