0153
Submillimeter 9.4 T fMRI of the human auditory cortex with tones, ripples, and real life sounds1Cognitive Neuroscience, Maastricht University, Maastricht, Netherlands, 2Center for Magnetic Resonance Research, University of Minnesota, MN, United States
Synopsis
This study demonstrates auditory human fMRI conducted at 9.4T field strength and submillimeter resolution for the first time. Tonotopic maps were measured robustly and reliably. Further, cortical regions with preference for natural sound categories were delineated. We generated ripple control sounds that closely match low level acoustical properties of natural sounds in four natural sound categories, such that the original category is not recognizable. We show that, in areas preferring speech sounds over other natural sounds, ripple control sounds of speech elicit stronger responses than ripple control sounds of non-speech. This indicates tuning to the low-level acoustical properties of speech.
Purpose
Functional neuroimaging investigations of sound-frequency representation in the human brain revealed a large-scale topographic organization of the auditory cortex (AC) with multiple tonotopic maps, i.e. with multiple orderly representations of best frequency preference. At higher processing levels, fMRI studies consistently detected multiple regions in non-primary AC exhibiting selective responses to specific sound categories, such as speech 1, voice 2, and music 3. It remains debated to what extent these responses reflect functional specialization or tuning to (combinations of) low level acoustic features. This study examines lower and higher levels of sound processing in human AC using submillimeter resolution fMRI at 9.4 T. We first obtained tonotopic maps of primary and non-primary areas using tones. We then examined the functional responses to sounds from four real life categories and to corresponding low level matched control sounds. We tested the hypothesis that the “selectivity” of responses for a specific sound category (e.g. speech) is preserved for control sounds whose acoustic properties are matched to the corresponding category but are unrecognizable.Methods
Participants and set-up: 7 healthy human volunteers participated in the fMRI measurements performed with a 9.4 T scanner (Siemens, Erlangen, Germany) equipped with a head gradient set (80mT/m @ 400mT/m/s) and an 8Ch-TX/32ch-RX coil (Life Services LLC, Minneapolis, MN) focused on temporal lobe. 2 participants were excluded due to large motion artefacts or technical problems. A non-subject-specific B1+ shim was used, which was optimized for efficiency in bilateral auditory cortex and validated for safety through SAR modeling.
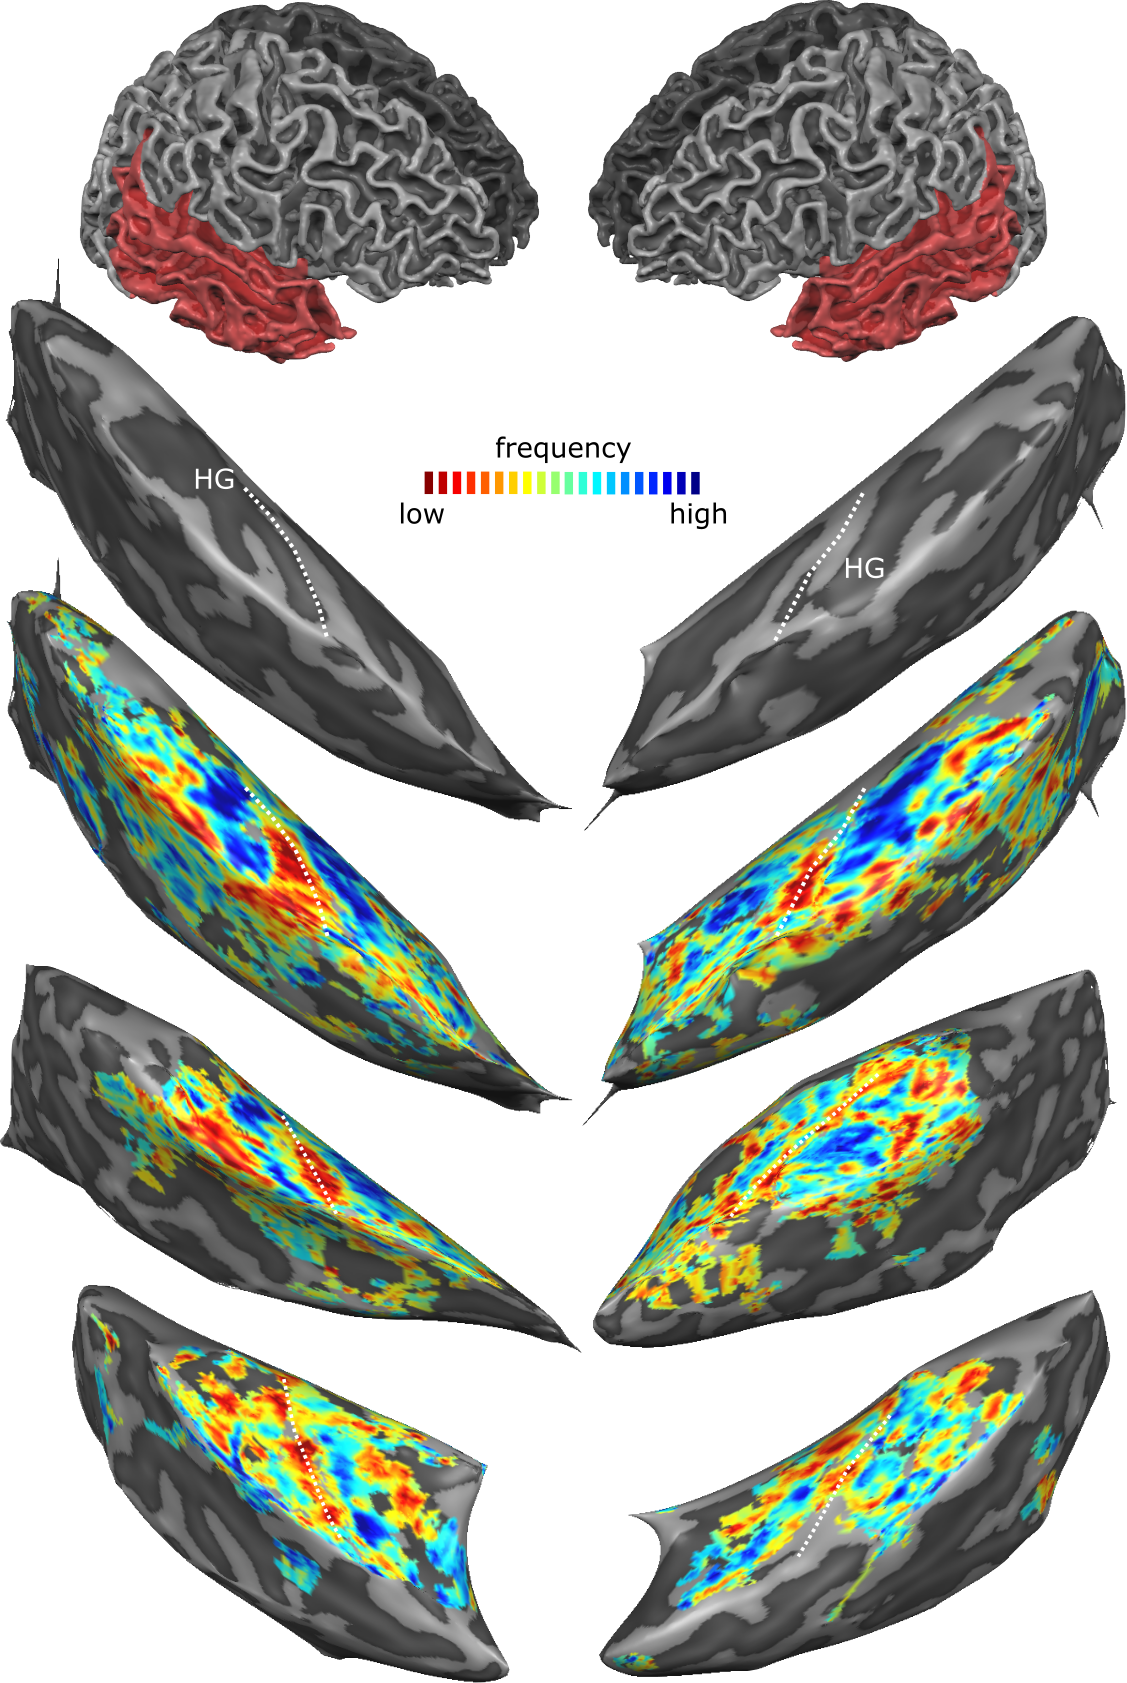
Stimuli and analysis: Amplitude modulated tone stimuli (0.25 – 4.0 kHz) were presented in a block design for tonotopic mapping (see Fig. 1 caption for design details). Tonotopic maps were obtained after standard pre-processing by best frequency mapping. 4 For the second experiment, stimuli were real life sounds from 4 categories (human speech, human voices, animal calls, and instruments/music). Control sounds were generated from the real life stimuli and consisted of ripples having the same main spectro-temporal modulation as the corresponding sound, and additionally matched in spectral envelope and dynamic temporal envelope. 14 stimuli of all eight categories (4 original + 4 control) were presented in a fast event-related design in silent gaps during MB-EPI acquisitions (in pseudo-randomized order, 112 stimuli in total, 5 repetitions each), while participants performed a 1-back task (by pressing a button). Target trials (5%) were discarded. We analyzed the time series by applying GLM denoise 5 to determine noise regressors and estimated the single voxel responses to all sound categories using multiple regression (i.e. General Linear Model).
BOLD fMRI imaging parameters: 48 transversal slices, TE/TR/TA = 17/2400/1200 ms, silent gap 1200 ms, matrix size 156x200, 0.8 mm isotropic nominal resolution, MB/GRAPPA-Factor 2/3 (FLEET reference lines 6), nominal flip angle 90°.
Anatomical imaging: T1-weighted weighted MPRAGE: TE/TR/TI = 2/3600/1200 ms, matrix size 384x384x256, 0.6 mm isotropic nominal resolution, GRAPPA-Factor 3, nominal flip angle 4°. Proton density-weighted MPRAGE: Same as T1-weighted MPRAGE except no inversion and TR = 1260 ms.
Results
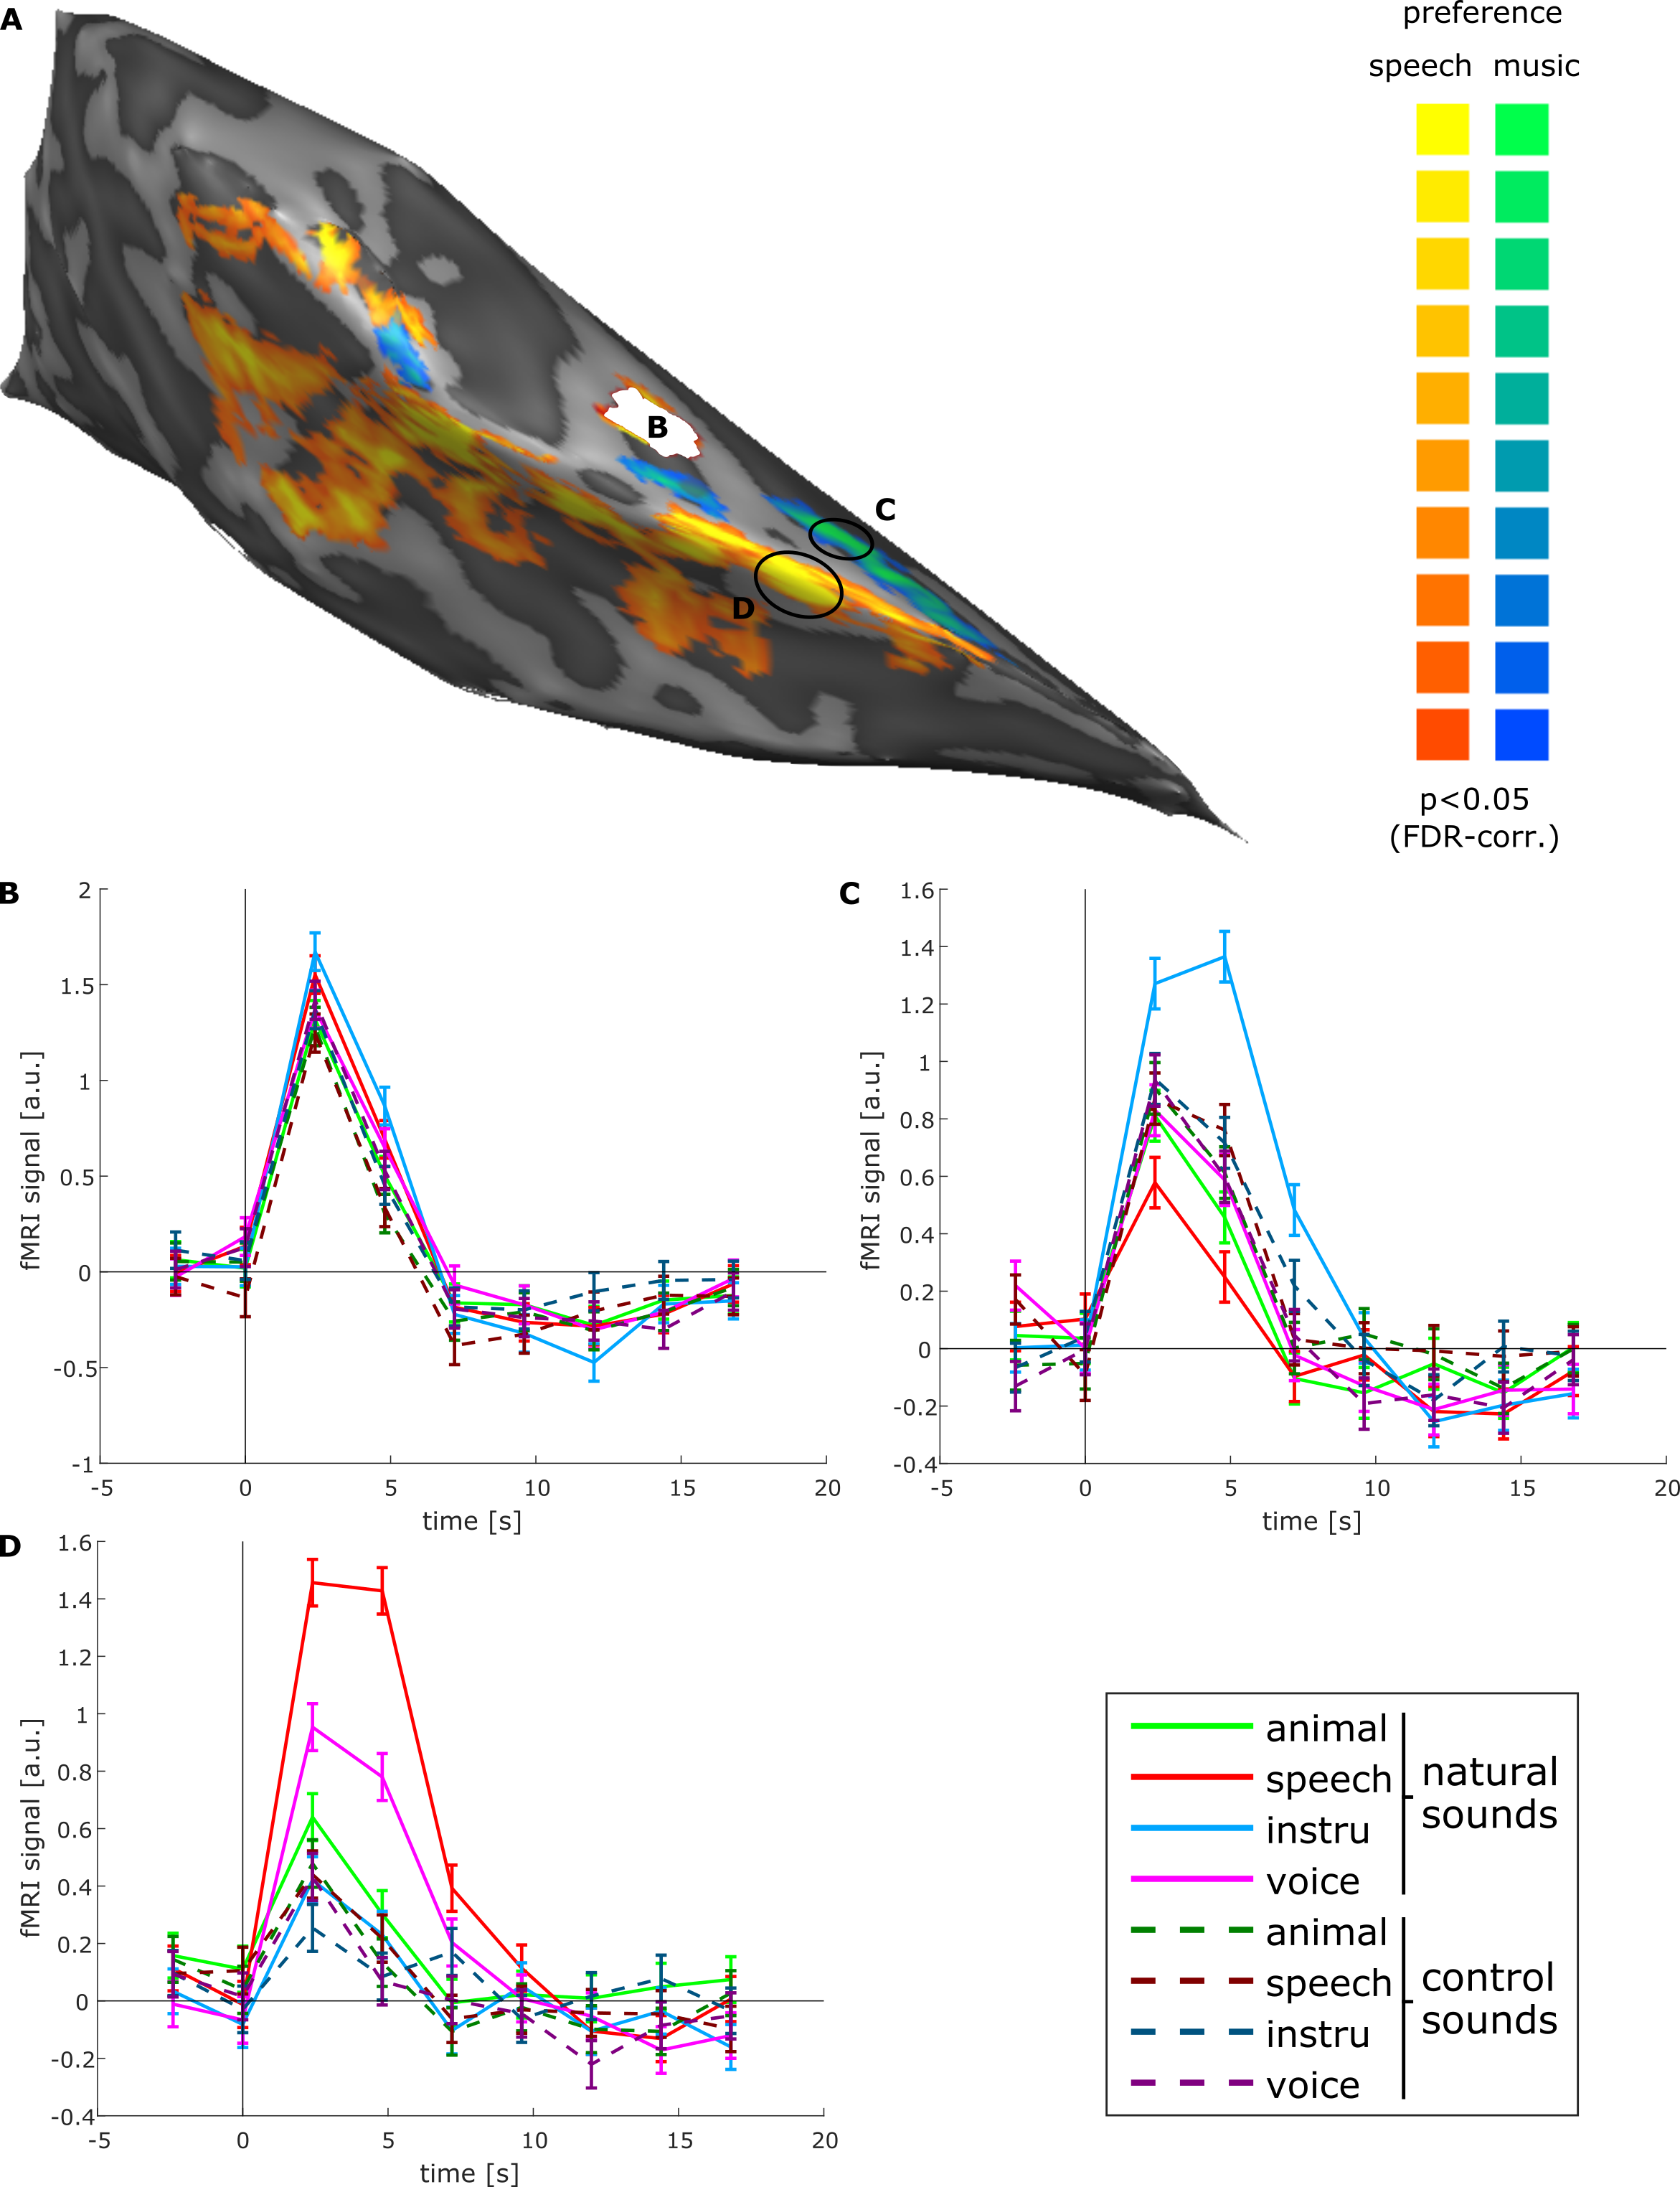
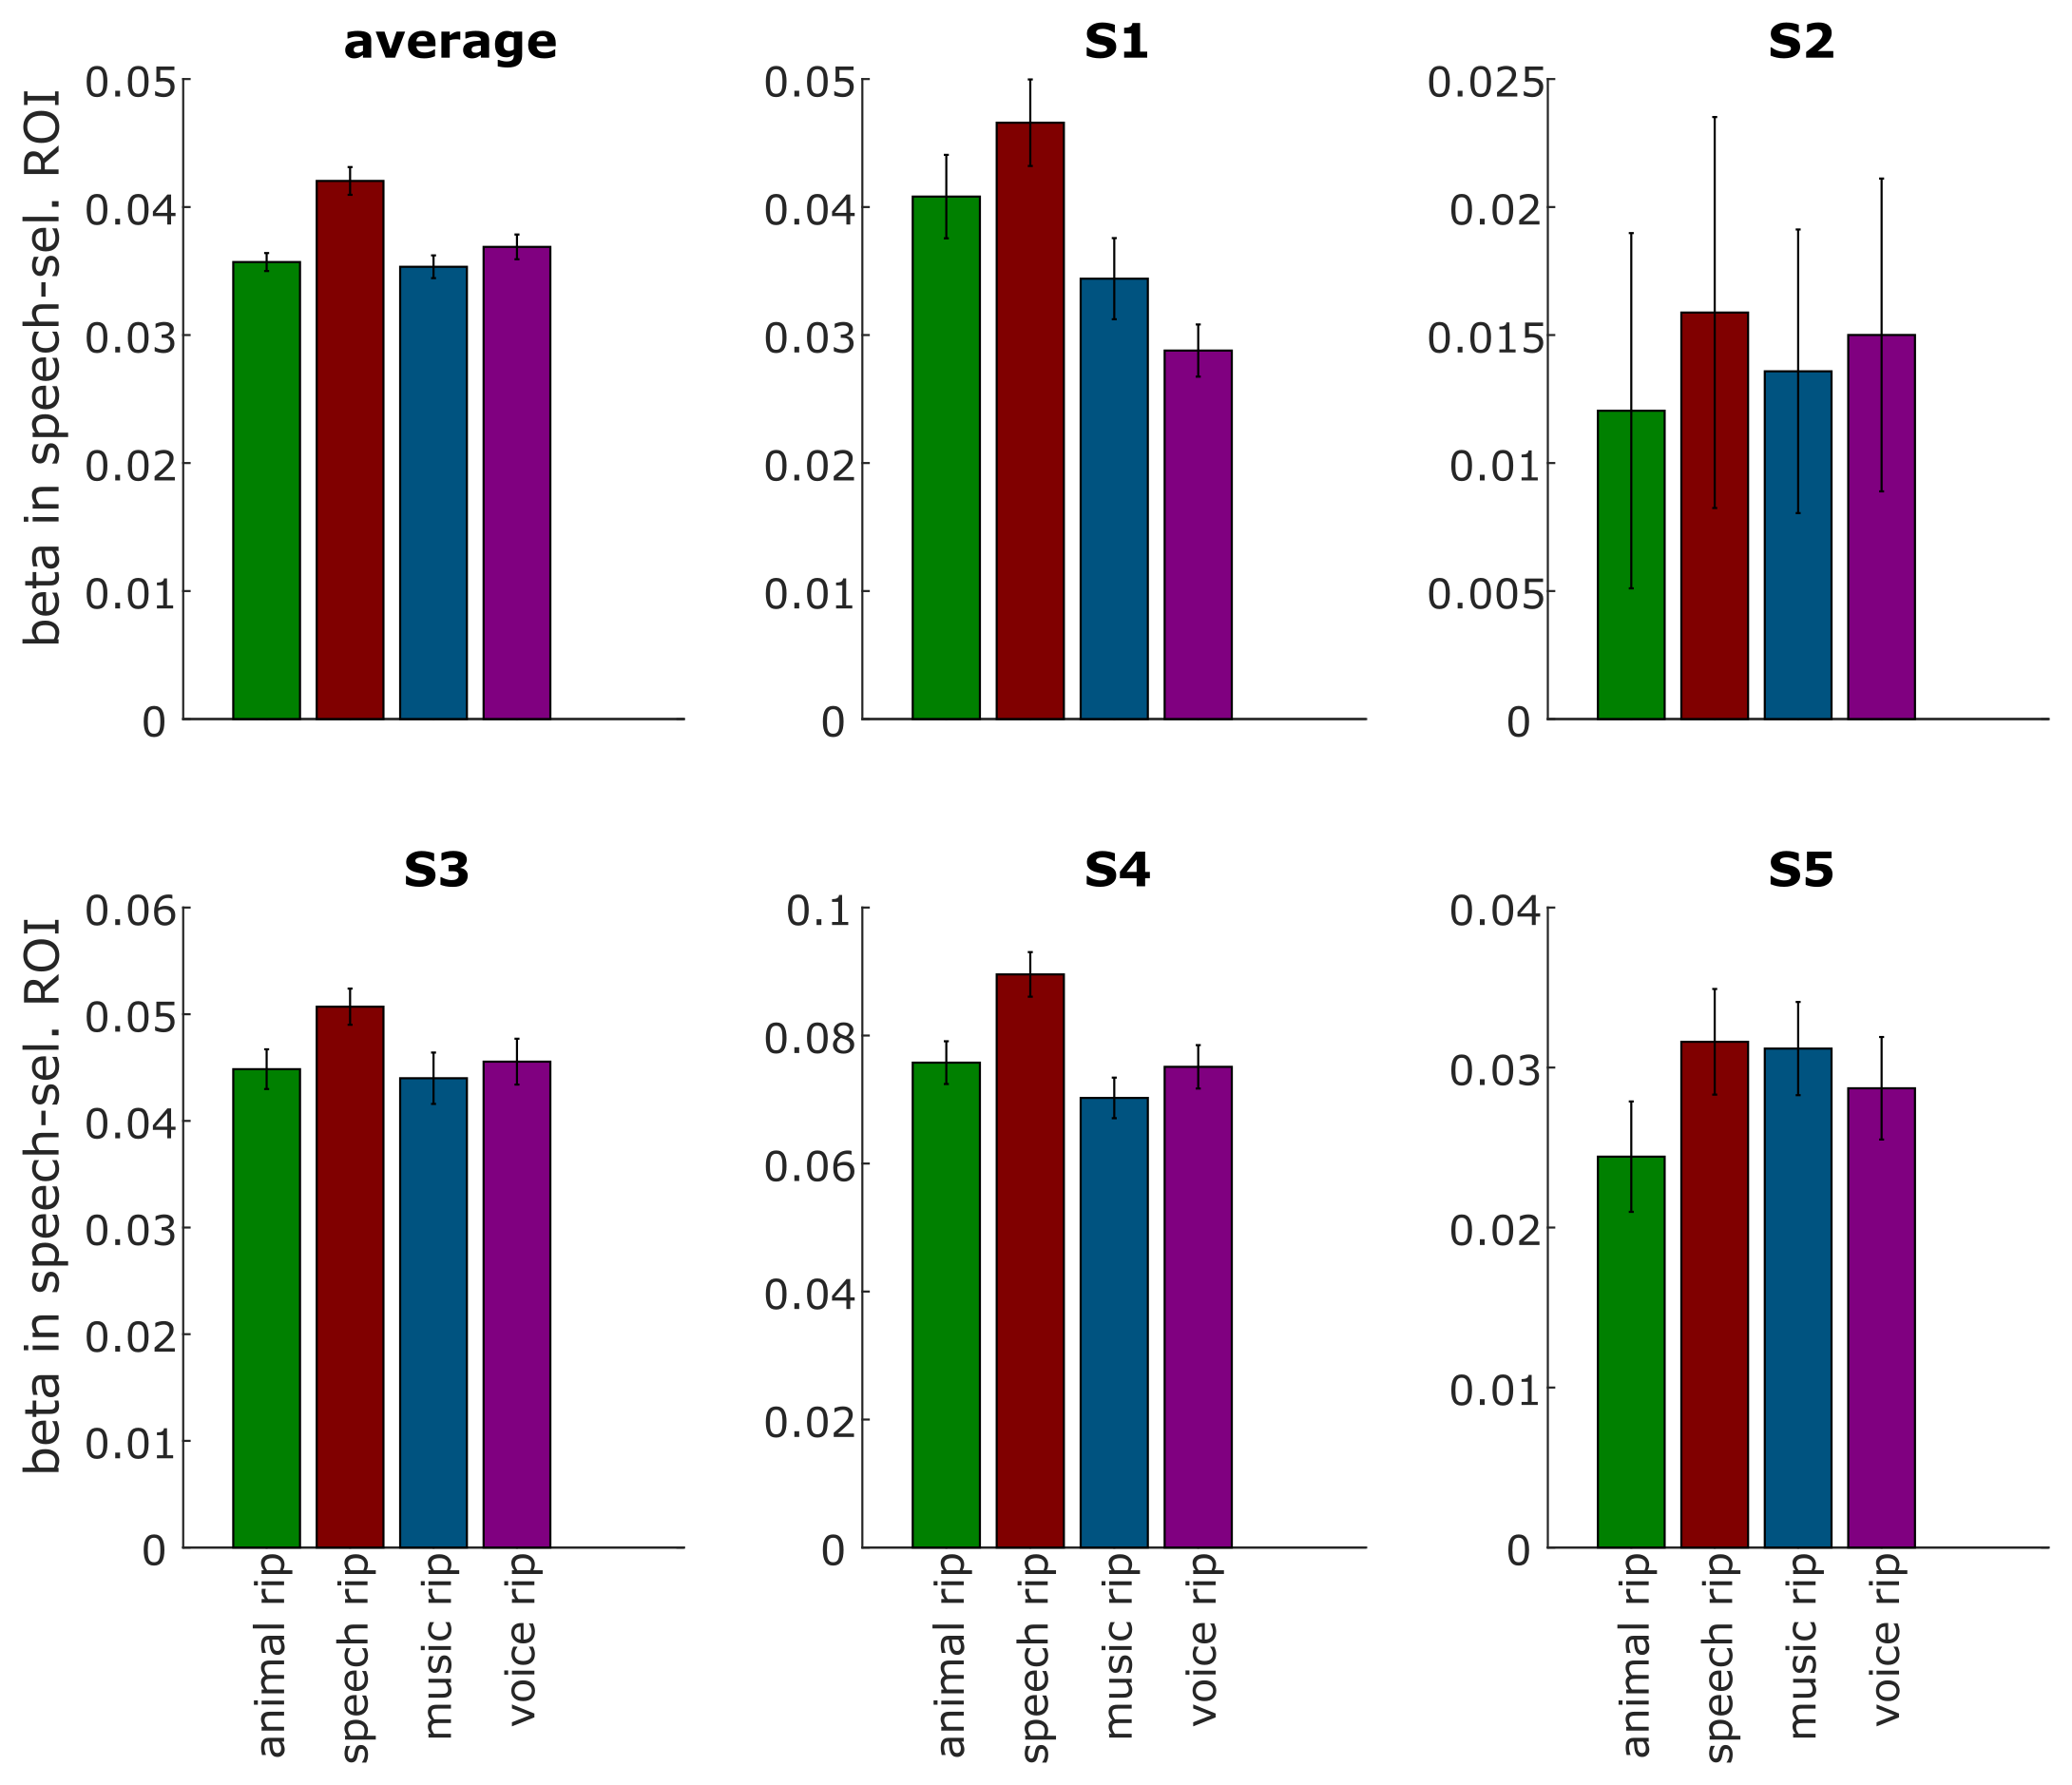
Fig. 1 shows best frequency maps (tonotopy) for 3 subjects. As expected, a frequency gradient reversal (high-low-high) is observable with the low frequency region corresponding with Heschl’s Gyrus (HG) and two high frequency regions posteriorly and anteriorly. Fig. 2 shows, for one representative subject, regions of the right medial temporal lobe that exhibit a significantly (FDR corrected) stronger response to speech sounds (red-yellow) or music (blue-green) compared to other natural sounds. The deconvolved hemodynamic response to all stimulus categories is presented for a region on the medial HG, and two regions that show a preference to speech sounds and music. Fig. 3 shows bar plots of fMRI signal responses to synthetic sound stimuli from the 4 categories in speech selective areas selected using only the natural sound stimuli. Interestingly, in all participants, control stimuli derived from speech sound elicited the strongest responses compared to the other control sounds.Discussion and Conclusion
For the first time, this study shows auditory human fMRI conducted at 9.4 T field strength and submillimeter resolution. Tonotopic maps as well as category selective responses could be robustly and reliably measured. In addition, for speech selective areas, a similar preference was observed for control stimuli preserving many acoustic properties of speech but that were not recognizable as speech. This may indicate that tuning to low-level properties contributes to category selective responses. In future work, we will exploit the achieved submillimeter resolution to investigate the cortical-depth dependence of these effects.Acknowledgements
The authors thank Dr. Desmond Tse for support with the measurements. This work was supported by the Netherlands Organization for Scientific Research (NWO; VIDI grant 864-13-012 to F.D.M., and VICI grant 453-12-002 to E.F).References
1. Binder JR, Frost JA, Hammeke TA, Bellgowan PS, Springer JA, Kaufman JN, Possing ET. Human temporal lobe activation by speech and nonspeech sounds. Cerebral cortex 2000;10(5):512-528.
2. Belin P, Zatorre RJ, Lafaille P, Ahad P, Pike B. Voice-selective areas in human auditory cortex. Nature 2000;403(6767):309-312.
3. Norman-Haignere S, Kanwisher NG, McDermott JH. Distinct Cortical Pathways for Music and Speech Revealed by Hypothesis-Free Voxel Decomposition. Neuron 2015;88(6):1281-1296.
4. Formisano E, Kim DS, Di Salle F, van de Moortele PF, Ugurbil K, Goebel R. Mirror-symmetric tonotopic maps in human primary auditory cortex. Neuron 2003;40(4):859-869.
5. Kay KN, Rokem A, Winawer J, Dougherty RF, Wandell BA. GLMdenoise: a fast, automated technique for denoising task-based fMRI data. Front Neurosci 2013;7(247):10.3389.
6. Polimeni JR, Bhat H, Witzel T, Benner T, Feiweier T, Inati SJ, Renvall V, Heberlein K, Wald LL. Reducing sensitivity losses due to respiration and motion in accelerated echo planar imaging by reordering the autocalibration data acquisition. Magnetic resonance in medicine 2015.
Figures