0147
Analysis of cerebrovascular watershed areas in patients with high-grade carotid artery stenosis using DSC-based time-to-peak maps1Neuroradiology, Technical University of Munich, Munich, Germany, 2Radioonkology and Radiotherapy, Charité Berlin, Berlin, Germany, 3Philips Healthcare, Best, Netherlands, 4Philips Research, Hamburg, Germany, 5TUM Neuroimaging Center (TUM-NIC), Technical University of Munich, Munich, Germany, 6Neurology, Technical University of Munich, Munich, Germany
Synopsis
Internal carotid artery stenosis (ICAS) is one of the leading causes for thromboembolic and hemodynamic cerebral infarction. Here, we present data from an ongoing clinical MRI-study in patients with asymptomatic, high-grade ICAS and healthy controls. Our major aim was to establish a method to delineate individual watershed areas in patients and controls using MRI-based dynamic susceptibility contrast (DSC) time-to-peak (TTP) maps, also including the anatomical information of magnetic resonance angiography (MRA) to define individual vascular territories. Watershed areas were enlarged and shifted in many of the vascular territories of stenosed carotid arteries, being verified by ss-pCASL in a subgroup.
Purpose
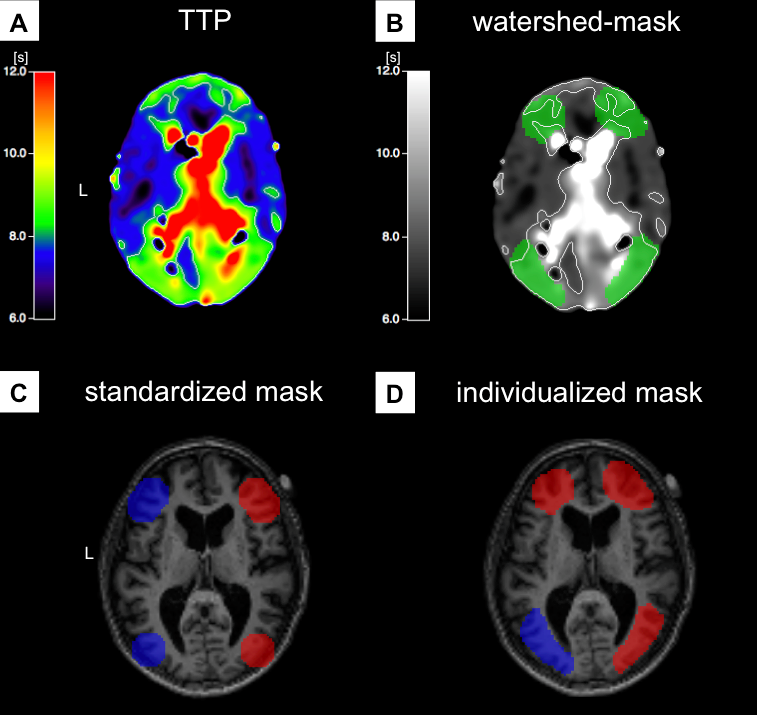
High-grade internal carotid artery stenosis (ICAS) accounts for approximately 20% of ischemic strokes due to thromboembolism and hemodynamic infarction in cerebral watershed areas.1 These most vulnerable areas are located between intracranial vessel territories, where arterial blood supply is physiologically compromised.2,3 Patients showing good collateralization via the Circle of Willis (CoW) often remain asymptomatic and have a lower risk for cerebral infarction.5 Analyzing the impact of ICAS on these watershed areas, we previously used non-individualized watershed masks based on the standard anatomy of vascular territories to analyse cerebral perfusion in ICAS (Fig.3C).6 However, the individual variants of the CoW and the relative enlargement and displacement of watershed areas in chronic hypoperfusive states produced inconclusive results.2,6 Therefore, the aim of this study was to manually define individualized watershed masks based on dynamic susceptibility contrast (DSC)-derived time-to-peak (TTP) maps accounting for the individual vascular anatomy of the CoW.Methods
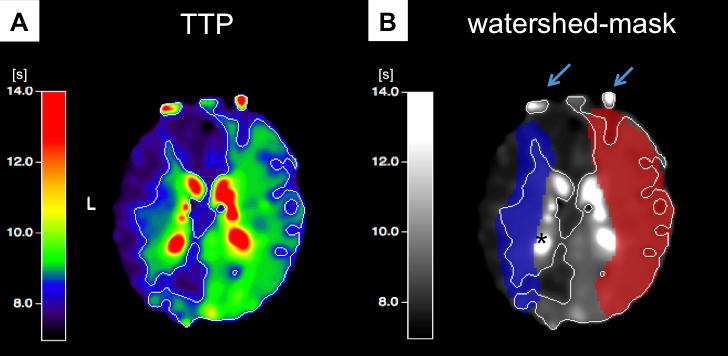
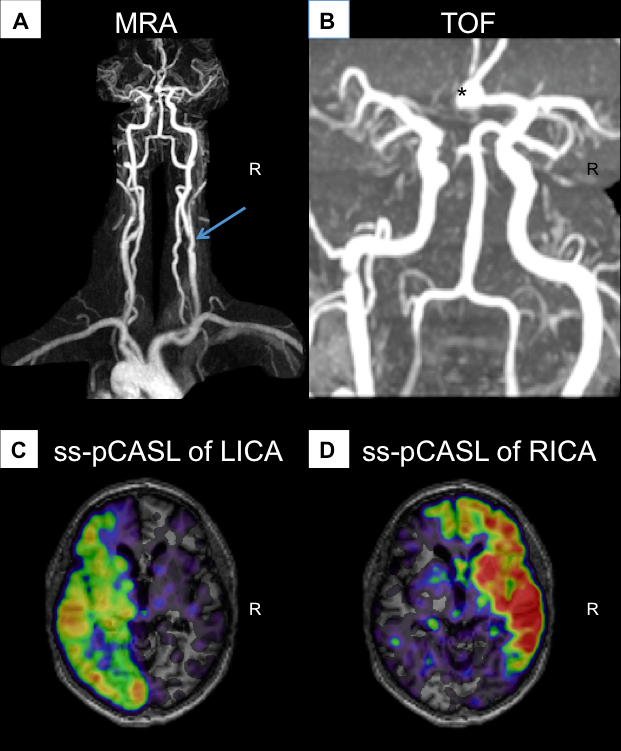
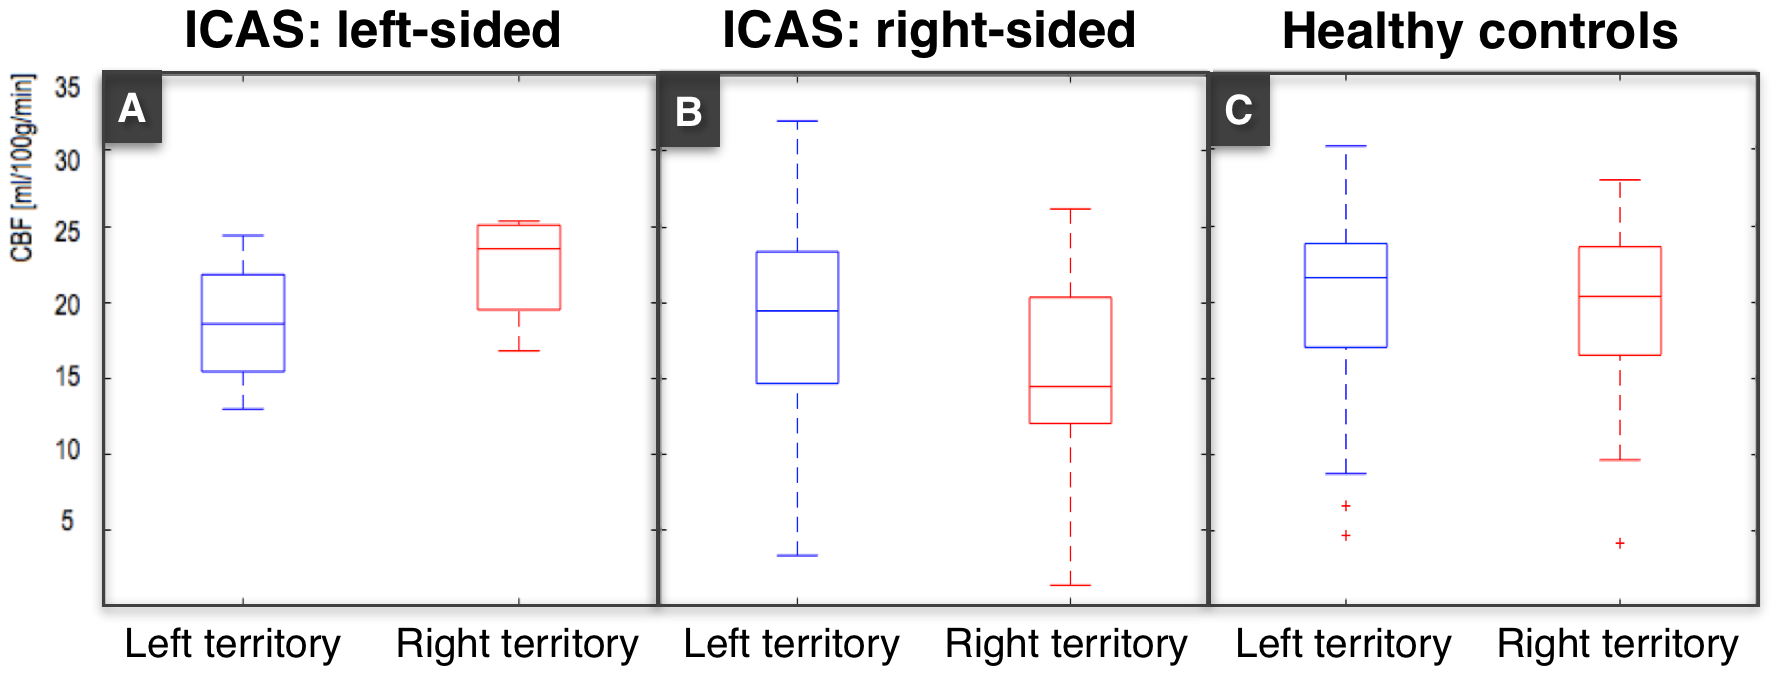
In this ongoing clinical study, we enrolled to date 23 patients (70.5±6.8y, 15 males) with unilateral ICAS (>70% according to the NASCET criteria), and 29 healthy controls (70.3±4.7y, 13 males), who underwent an MRI examination on a clinical 3T Ingenia MR-Scanner (Philips Healthcare, Best, Netherlands). A 16-channel head-coil was used for acquisition of pseudo-continuous arterial spin labeling (pCASL) data (background suppression, label duration=1800ms, post label delay=2000ms, segmented 3D-GRASE readout, 3 repetitions including M0, TE=7.4ms, TR=4403ms, voxel size 2.7x2.9x6mm3, 16 slices). Afterwards, we conducted a contrast enhanced magnetic resonance angiography (MRA) of the neck (17ml Gd-DTPA) and obtained DSC-data during a bolus injection of 15ml Gd-DTPA (flow 4 ml/s) using single-shot GE-EPI (TR=1516ms, TE=30ms, α=60°, 80 repetitions). Data evaluation used custom programs in MATLAB (MathWorks) and SPM12 (http://www.fil.ion.ucl.ac.uk/spm/). Evaluation of pCASL followed recent recommendations of the ISMRM perfusion study group and DSC data were processed as described previously.7,8 TTP maps derived from slice-timing corrected DSC data served as a reference for contour forming of watershed masks using a visually defined reasonable binary threshold in Vinci (http://www.nf.mpg.de/vinci3/). The initial masks included venous blood flow and the ventricular system, which had to be excluded manually (Fig.1). Other parts of the masks required extrapolating extension, since they did not reach into grey matter. The individual anatomy of the CoW was assessed via MRA, which guided the splitting into left and right vascular territories of the bilateral carotid arteries (Fig.2). In a subgroup of patients, we additionally used superselective-pCASL (ss-pCASL) to visualize the individual vascular perfusion territories for verification of the masks (Fig.2).9 For evaluation of cerebral hypoperfusion, masks were used to extract mean pCASL-based CBF values (Fig.4).Results
Watershed areas could well be delineated on TTP maps. Considering variations of the CoW, MRA-imaging enabled a correlation between brain tissue and vascular territories. Additionally, ss-pCASL, available in a subgroup of patients, proofed expected individual collateralizations and allowed an even more precise delineation of individual perfusion territories (Fig.2). In contrast to healthy controls, watershed area masks of our patients showed a lateralization with enlarged masks on the affected hemisphere (Fig.1). A VOI evaluation of pCASL-based CBF maps using the watershed area masks demonstrated symmetric perfusion in healthy controls, while patients showed reduced perfusion on the affected hemisphere (Fig.4).Discussion
These preliminary results of individualized, manually defined masks of watershed areas based on DSC-derived TTP maps are promising. We could clearly demonstrate lateralization of perfusion impairment in patients with unilateral ICAS, which was not observed using non-individualized masks based on common vascular anatomy.6 Manual delineation of individualized watershed masks revealed large deviations from standard vascular anatomy in many patients, demonstrating the importance of taking into account individual variants of the vascular territories when comparing perfusion between hemispheres. In the literature, TTP is considered a very sensitive parameter to estimate impaired perfusion and might serve as a diagnostic and prognostic tool to delineate areas of higher risk for hemodynamic infarction.10, 11Acknowledgements
The authors acknowledge the financial support by the Leonhard-Lorenz Stiftung.References
1. Petty GW, Brown RD, Whisnant JP, Sicks JD, O’Fallon WM & Wiebers DO. Ischemic stroke subtypes: a population-based study of incidence and risk factors. Stroke, 30:2513-2516. (1999)
2: Momjian-Major MD, Baron MD, FRCP, FMedSci, The Pathophysiology of Watershed Infarction in Internal Carotid Artery Disease. Stroke, 36:567-577(2005).
3. Mangla et al., Border Zone Infarcts: Pathophysiology and Imaging Characteristics. RadioGrapphics, 31:1201–1214 (2011).
4. Jian-wei Ni, Hiroyuki Ohta, Kinzo Matsumoto, Hiroshi Watanabe. Progressive cognitive impairment following chronic cerebral hypoperfusion induced by permanent occlusion of bilateral carotid arteries in rats. Brain Research, 653(1-2):231-236. (1994)
5. Schaller. Imaging of Carotid Artery Stenosis. Springer, p.157. (2007)
6. Kaczmarz et al. Evaluation of perfusion and hypoxia parameters in healthy subjects and patients with high-grade carotid artery stenosis, Proc. Intl. Soc. Mag. Reson. Med. 24. Abstract 4383. (2016)
7.Alsop DC, Detre JA, Golay X, Günther M, Hendrikse J, Hernandez-Garcia L, Lu H, MacIntosh BJ, Parkes LM, Smits M, van Osch MJ, Wang DJ, Wong EC, Zaharchuk G. Recommended implementation of arterial spin-labeled perfusion MRI for clinical applications: A consensus of the ISMRM perfusion study group and the European consortium for ASL in dementia. Magn Reson Med. 2015 Jan; 73(1):102-16. (Epub 2014)
8.Kluge A, Lukas M, Toth V, Pyka T, Zimmer C, Preibisch C. Analysis of three leakage-correction methods for DSC-based measurement of relative cerebral blood volume with respect to heterogeneity in human gliomas. Magn Reson Imaging. 34(4):410-21. (2016)
9. Helle M, Norris DG, Rüfer S, Alfke K, Jansen O, van Osch MJ. Superselective pseudocontinuous arterial spin labeling. Magn Reson Med.; 64(3): 777-786 (2010)
10. Sobesky et al. Which Time-to-Peak Threshold Best Identifies Penumbral Flow? A Comparison of Perfusion-Weighted Magnetic Resonance Imaging and Positron Emission Tomography in Acute Ischemic Stroke. Stroke. (2004)
11. Salvolini, Scarabino. High Field Brain MRI. p.96-98. (2006)
Figures