0144
T2-relaxation-under-spin-tagging (TRUST) and Arterial Spin Labeling MRI elucidate discrepant hemo-metabolic mechanisms underlying elevated oxygen extraction fraction (OEF) in moyamoya and sickle cell anemia (SCA) patients1Radiology & Radiological Sciences, Vanderbilt University Medical Center, Nashville, TN, United States, 2Department of Pediatrics, Division of Pediatric Neurology, Vanderbilt University Medical Center, 3Vanderbilt Memory & Alzheimer's Center, Vanderbilt University Medical Center, Nashville, TN, 4Department of Neurology, Vanderbilt University Medical Center, 5Department of Psychiatry, Vanderbilt University Medical Center
Synopsis
T2-relaxation-under-spin-tagging (TRUST-MRI) was performed in patients with intracranial stenosis due to moyamoya for determination of whole-brain oxygen extraction fraction (OEF). Elevated OEF was observed in this group compared to controls. In15O PET studies in individuals with intracranial stenosis, it has been shown that OEF increases regionally when cerebral blood volume (CBV) is inadequate to maintain cerebral blood flow (CBF) over a normal range, and importantly that regionally elevated OEF and CBV may be prognostic for recurrent stroke risk. This work has motivated the development and application of TRUST-MRI for use in patients with intracranial stenosis at risk for stroke.
Purpose
The overall purpose of this work is to apply novel multi-modal MRI approaches in sequence to investigate mechanisms of hemodynamic impairment and compensation adequacy in patients with cerebrovascular disease. More specifically, elevated oxygen extraction fraction (OEF), is a well-known marker of hemo-metabolic impairment in patients with cerebrovascular disease based on prior 15O-PET studies1 and MRI methods have more recently been developed to assess OEF in vivo and without exogenous contrast. The purpose of this study is to apply multi-modal metabolic (OEF-weighted) and hemodynamic (cerebral blood flow (CBF)-and cerebrovascular reactivity (CVR)-weighted) MRI to evaluate mechanisms of parenchymal impairment in patients with hypothesized globally elevated OEF secondary to bilateral vasculopathy and moyamoya or reduced oxygen carrying capacity and sickle cell anemia (SCA). The underlying hypothesis is that OEF is elevated (i) secondary to reduced CBF in patients with moyamoya, and (ii) secondary to reduced blood oxygen carrying capacity in patients with SCA.Methods
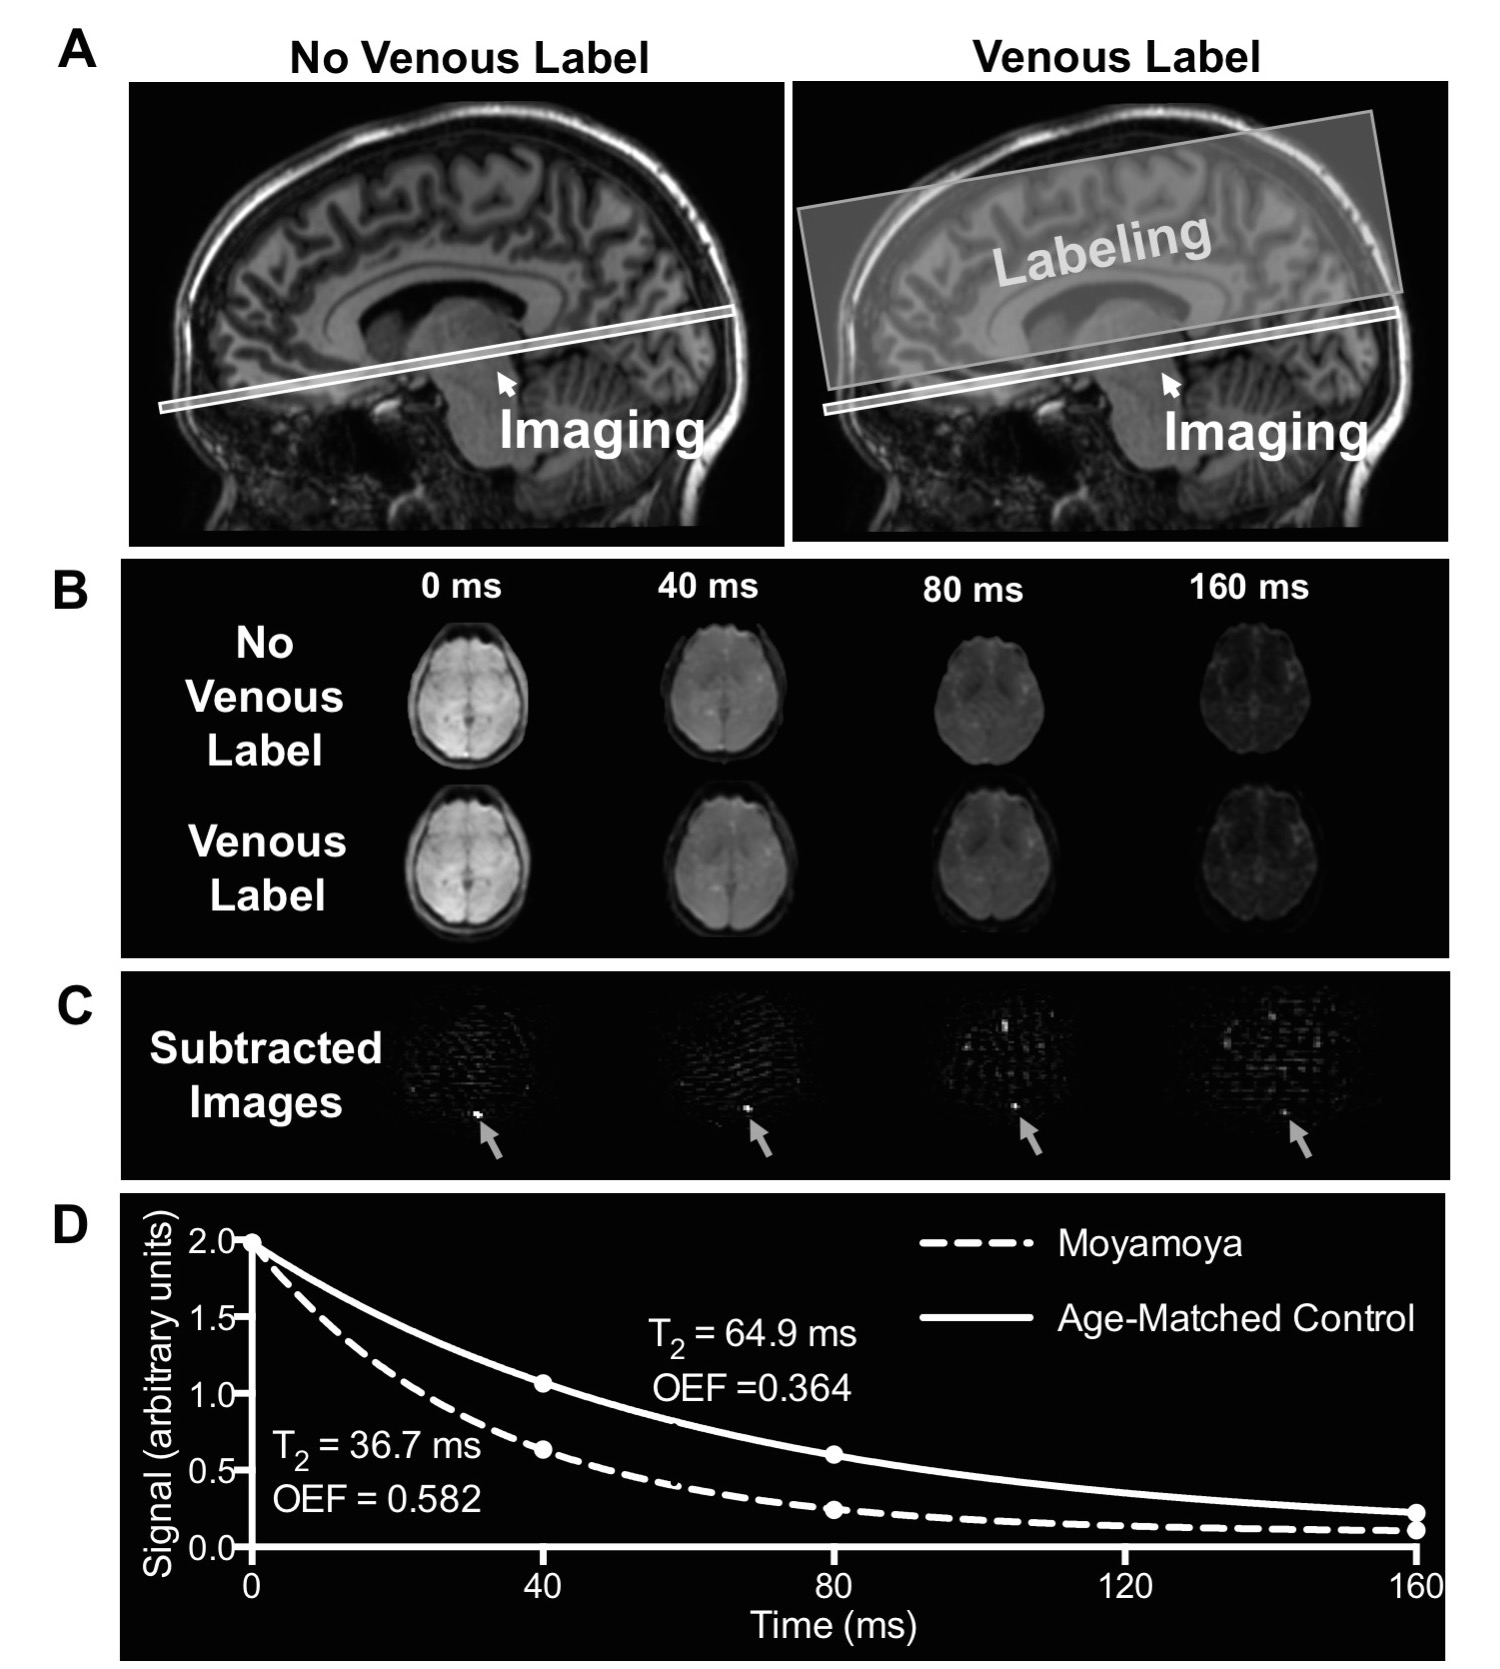
All volunteers provided informed, written consent and were scanned at 3T (Philips Achieva). T2-relaxataion-under-spin-tagging (TRUST-MRI; Figure 1) was applied in patients with intracranial stenosis due to moyamoya (n=18), a population in which OEF is hypothesized to be elevated due to hypoperfusion, and in patients with SCA (n=18), a population in which OEF is hypothesized to be elevated due to reduced blood oxygen carrying capacity. Additionally, age-matched control participants for both the moyamoya cohort (n=43) and SCA cohort (n=11) were imaged. To determine OEF, CPMG-T2 was calculated in the sagittal sinus for each participant by performing pair-wise subtraction of the label from the unlabeled control image at four effective echo times (eTEs)=0, 40, 80, and 160ms. CPMG-T2 was then converted to venous oxygenation (Yv) using knowledge of blood water T2, and measured hematocrit2, 3. Arterial oxygenation (Ya) was measured by pulse oximetry and used to calculate OEF=(Ya-Yv)/Ya. For CBF determination, pseudo-continuous arterial spin labeling (pCASL) was applied using ISMRM Perfusion Study Group guidelines4. For cerebrovascular reactivity (CVR) determination, BOLD data (spatial resolution: 3.5x3.5x3.5 mm3; TE/TR=35/2000ms) were acquired during mild hypercapnia (5% CO2) and signal changes normalized by end tidal CO2 change recorded. Non-parametric tests were applied to compare study variables (significance: two-sided p<0.05).Results
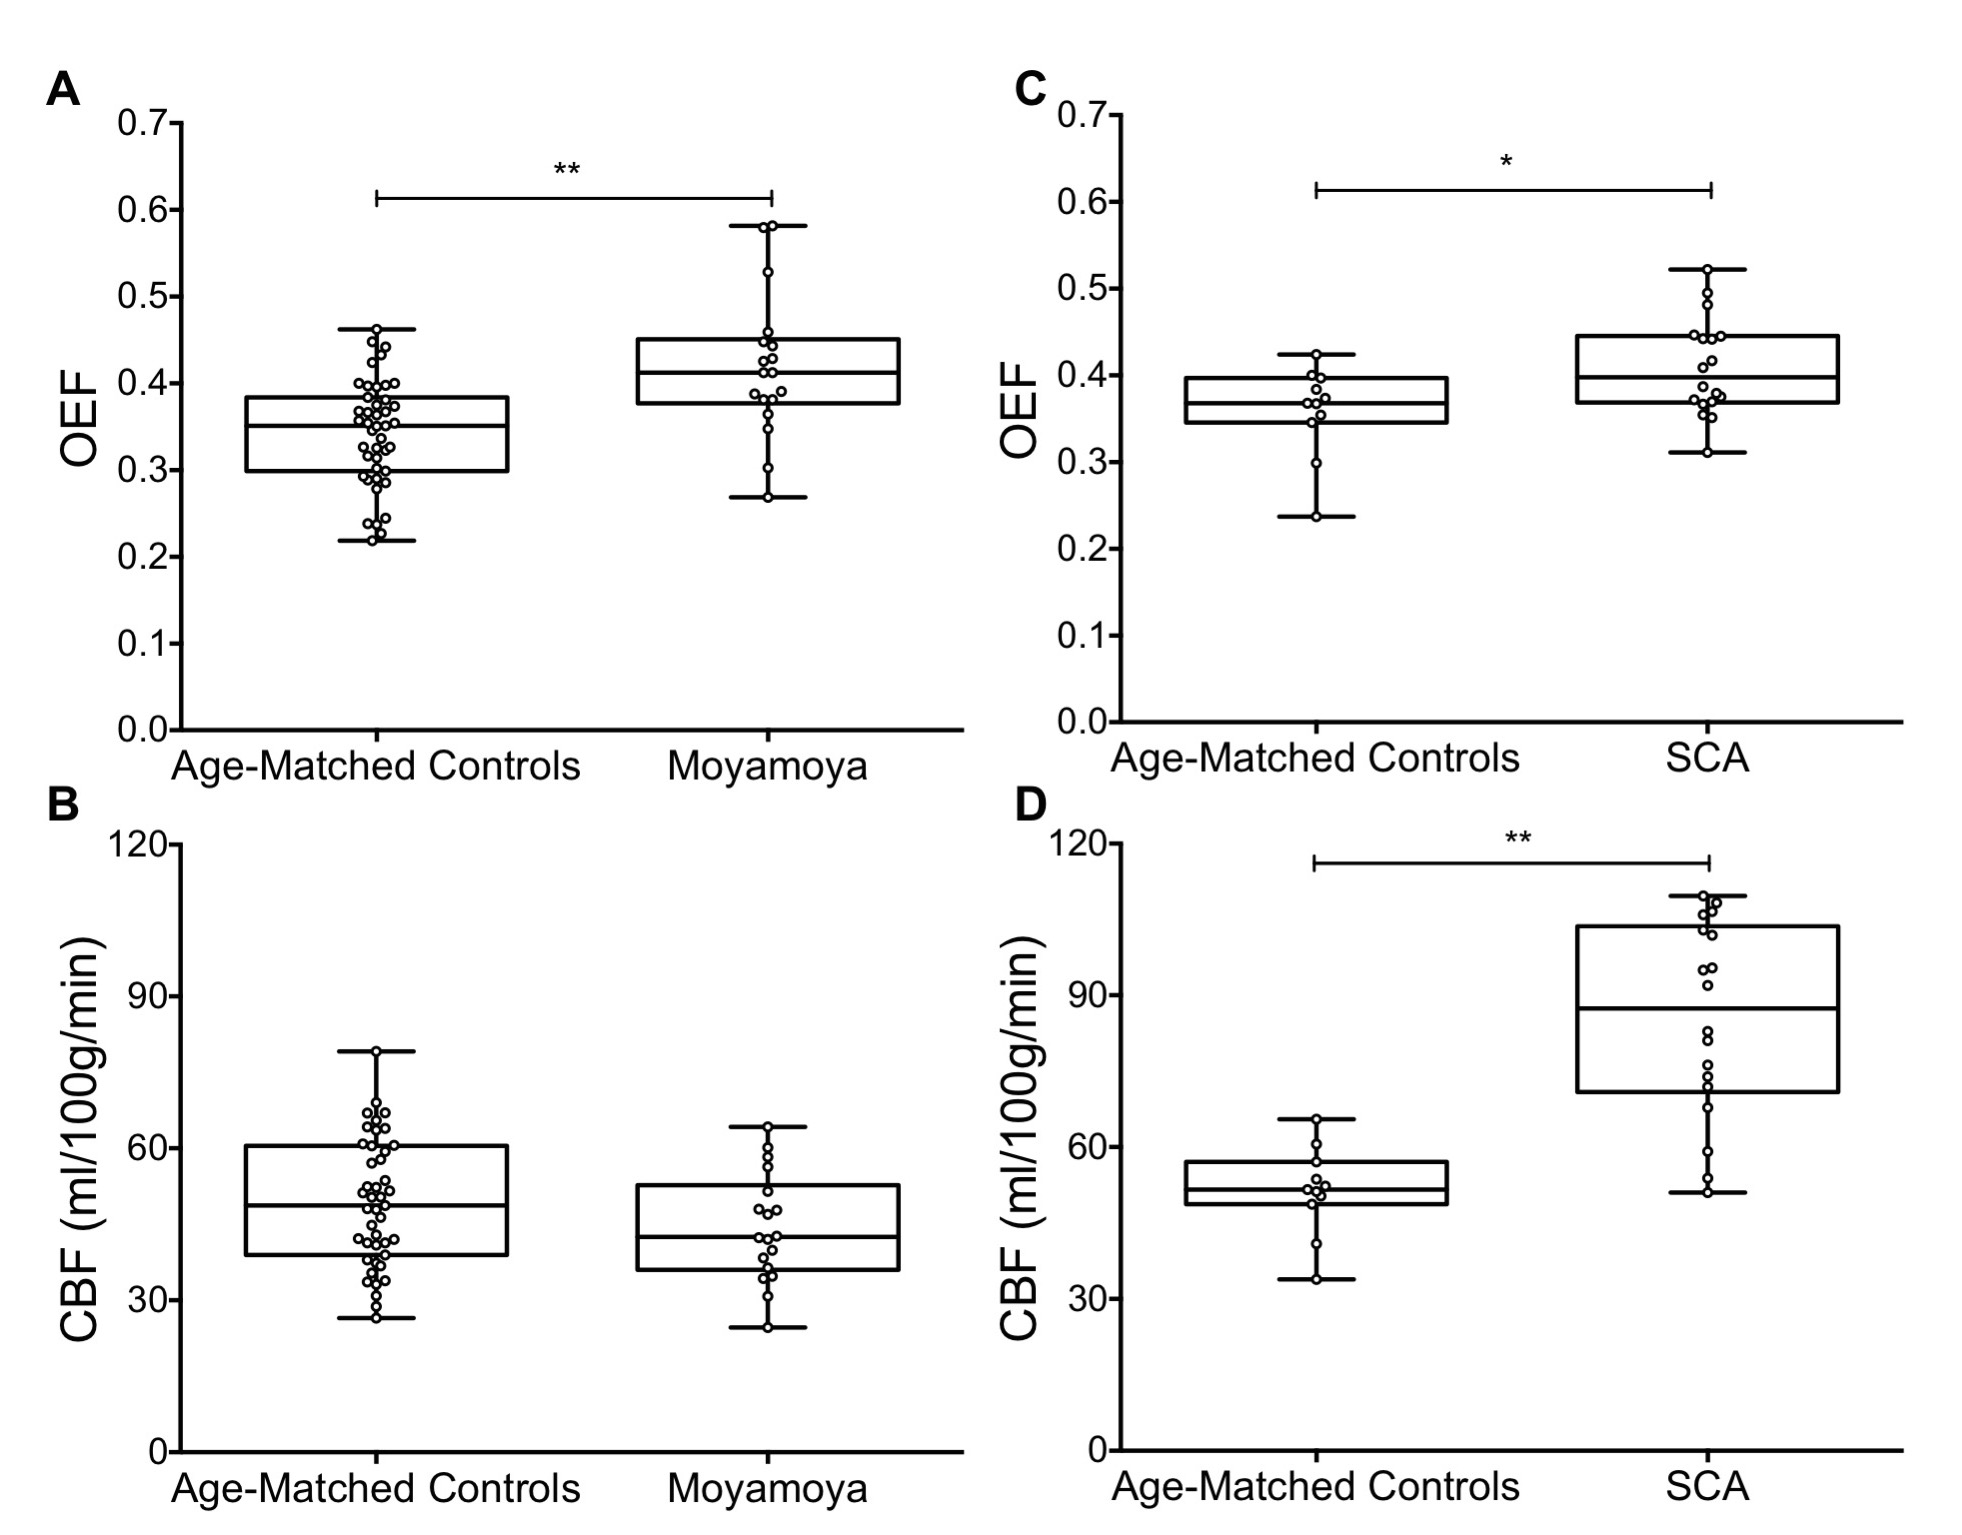
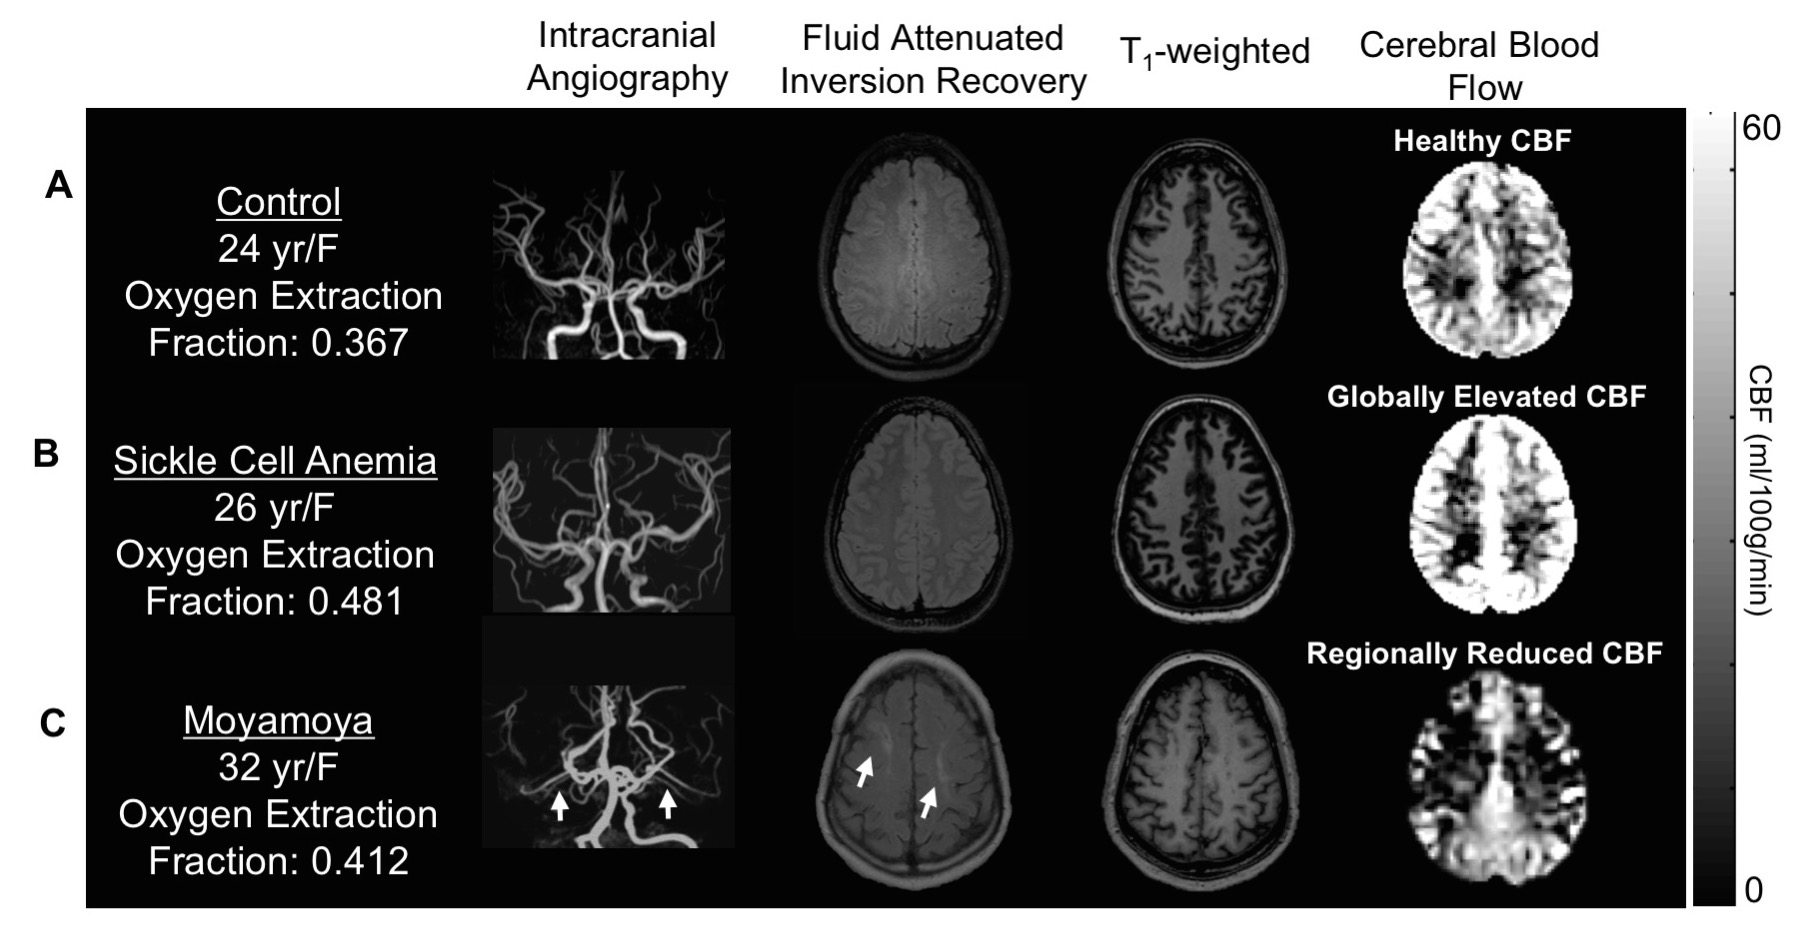
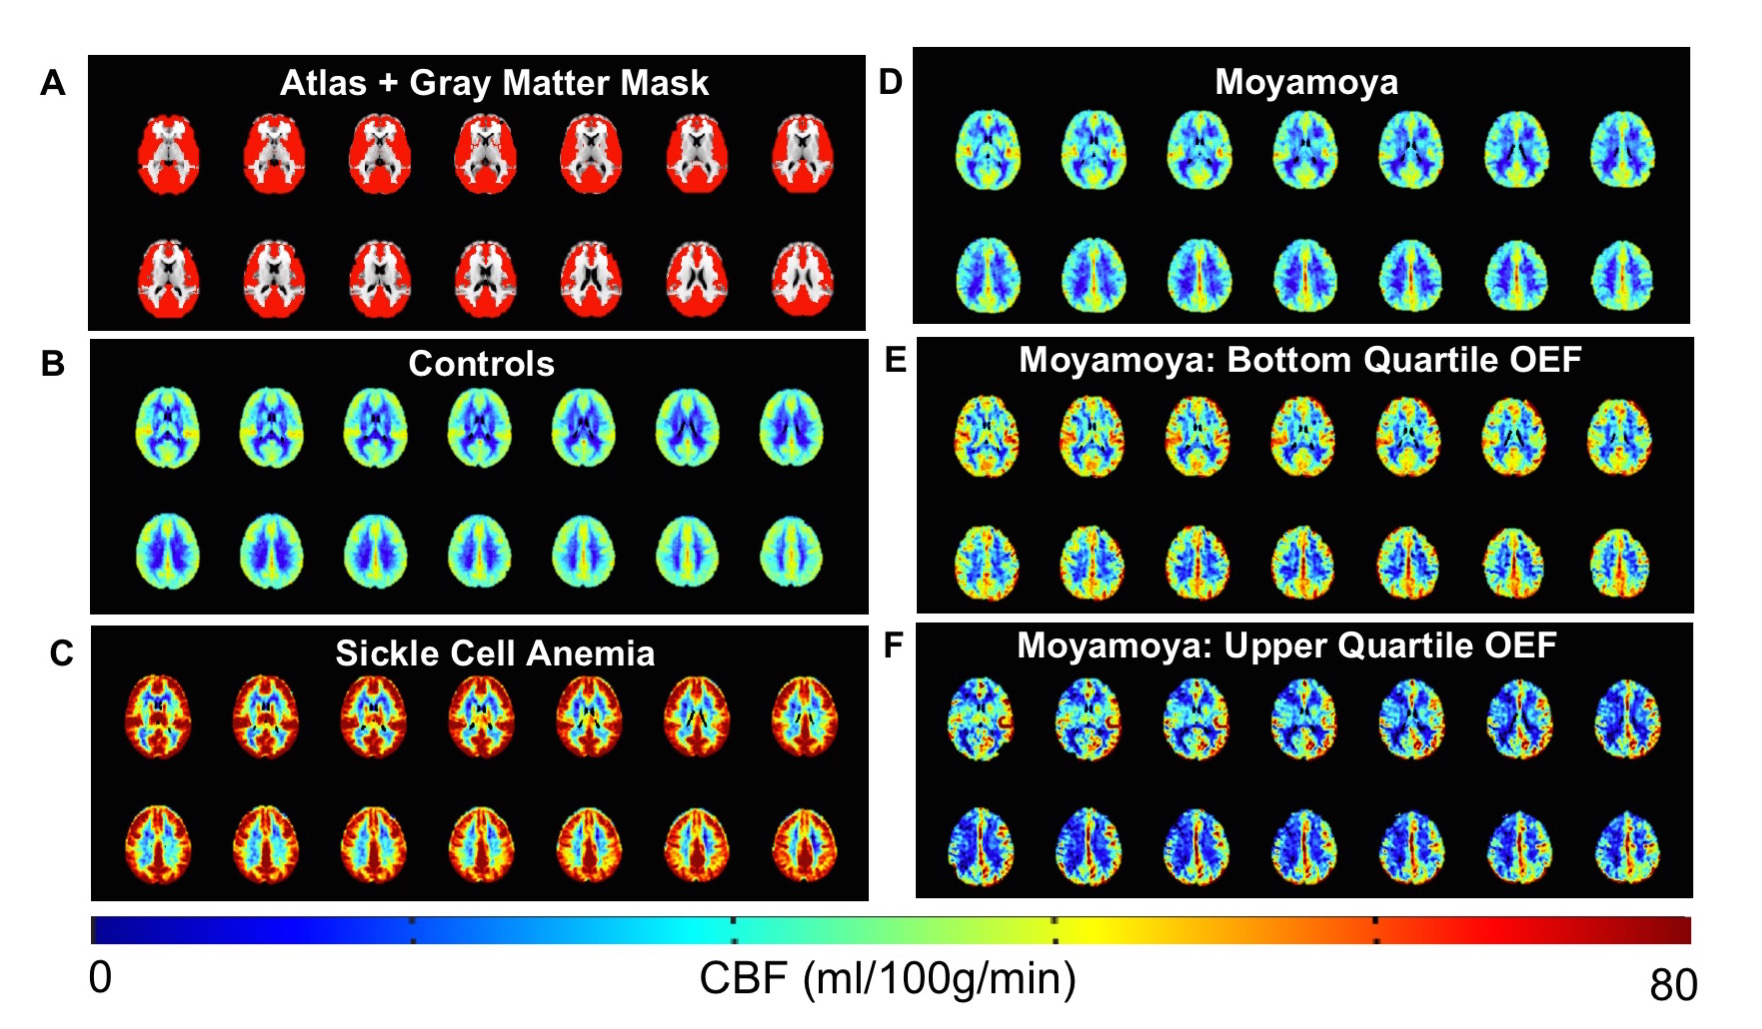
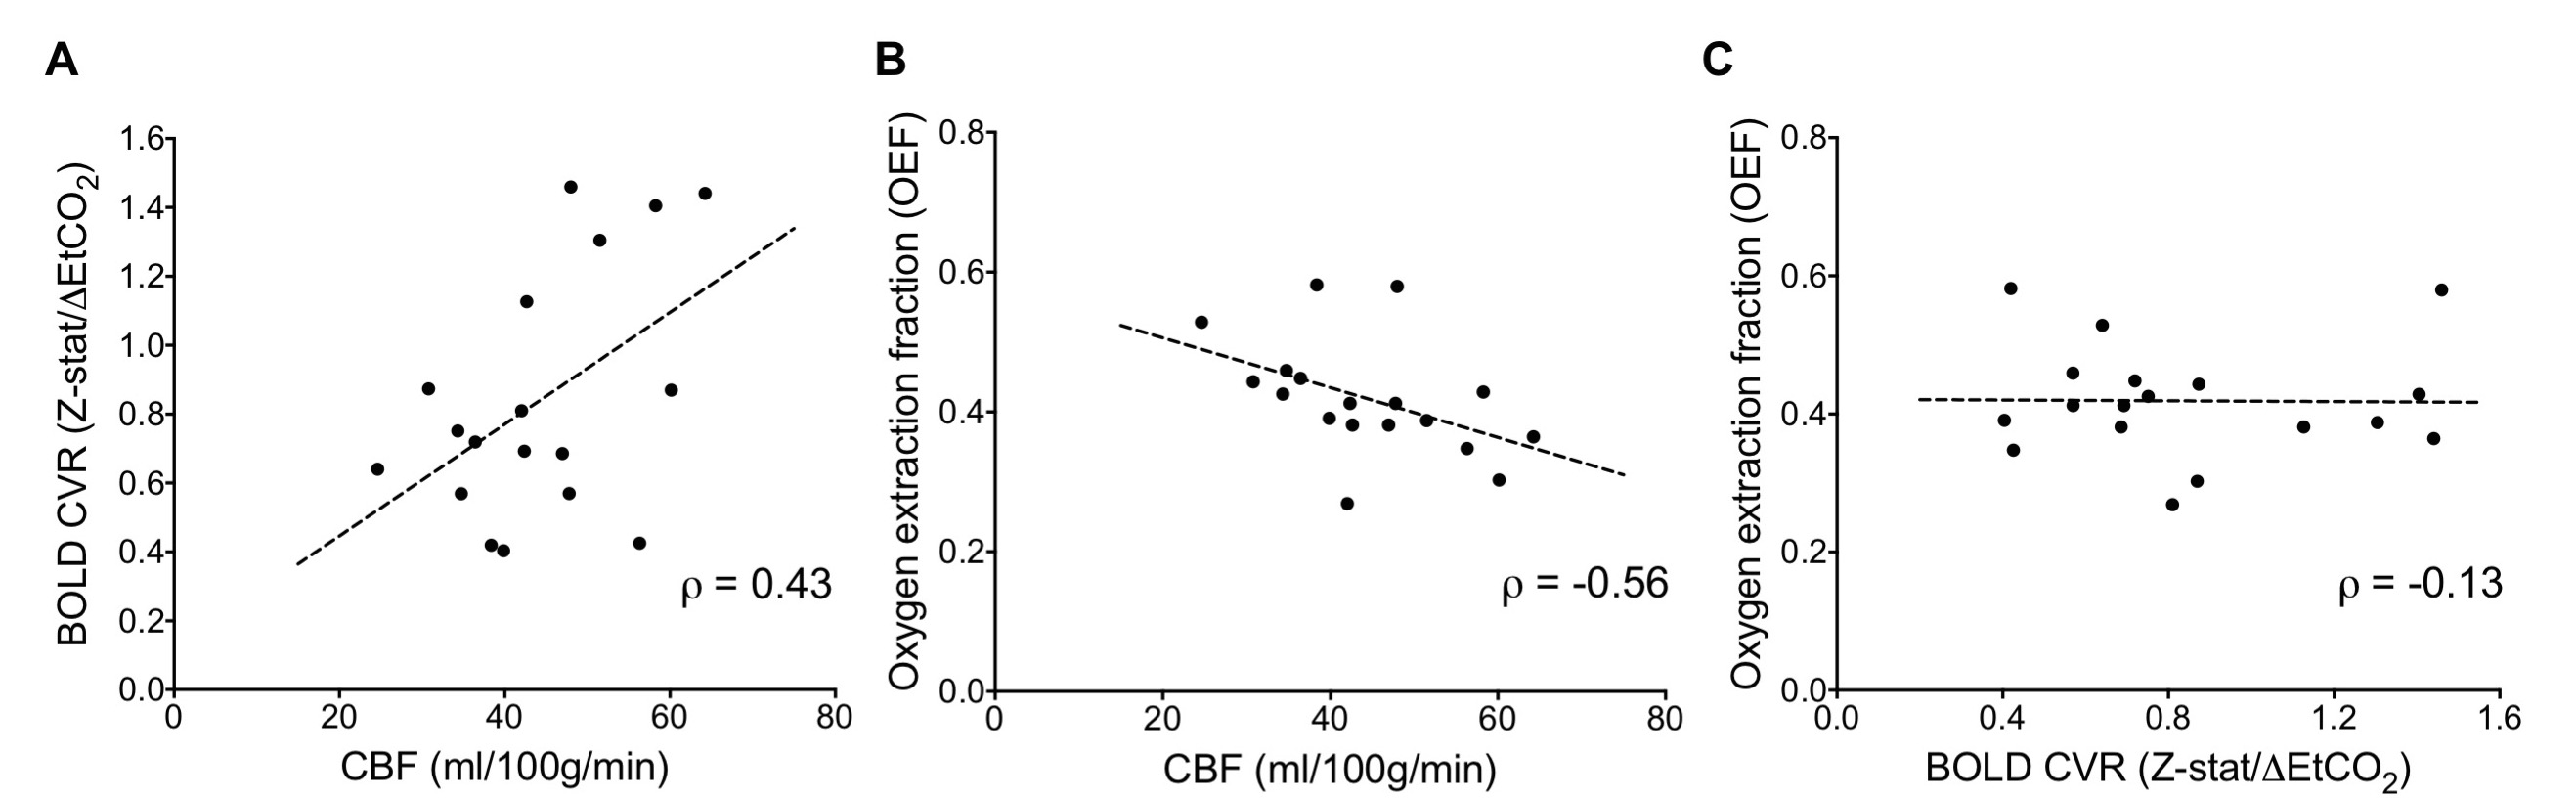
Moyamoya. OEF values (mean±s.d.) of moyamoya participants (OEF=0.419±0.083) were significantly (P<0.001) elevated compared to age-matched controls (Figure 2A; OEF=0.343±0.061). Gray matter (GM) CBF values (mean±s.d.) of age-matched controls (CBF=49.2±12.5 ml/100g/min) and moyamoya participants (Figure 2B; CBF=44.4±10.7 ml/100g/min) were determined, and a trend for a reduction in mean GM CBF in moyamoya participants compared to control participants was observed. SCA. OEF was significantly elevated in participants with SCA (OEF=0.410±0.056) compared to age-matched control participants (Figure 2C; OEF=0.359±0.052). GM CBF values in SCA participants (CBF=85.3±19.4 ml/100g/min) were significantly elevated compared to age-matched controls (Figure 2D; CBF=51.4±8.6 ml/100g/min). Figure 3 summarizes case examples of structural and functional imaging data from representative controls and patients. Mean CBF maps for each participant group are shown in Figure 4. In subjects with moyamoya, BOLD-weighted CVR positively trended with CBF (Figure 5A; ρ=0.43, P=0.073). A significant inverse relationship between OEF and CBF was observed in patients with moyamoya (Figure 5B; ρ=-0.56, P=0.016), however there was only a weak and non-significant inverse relationship between CVR and OEF in moyamoya patients (Figure 5C; ρ=-0.13, P=0.082).Discussion
To our knowledge, this is the first time elevated whole-brain OEF has been reported in participants with moyamoya using TRUST-MRI. Inter-subject variation in this parameter may provide a biomarker of hemodynamic compensation and possibly stroke risk, which is a logical extension of these initial findings. While the moyamoya participants as a group exhibited a strong inverse relationship between CBF and OEF, group-level pCASL-measured CBF was only marginally reduced in moyamoya subjects relative to control volunteers which may be due to intravascular signal from delayed blood arrival5. Elevated OEF was only weakly related to reductions in CVR, consistent with basal CBF level, rather than vascular reserve capacity, being most closely associated with OEF. In the SCA cohort, elevated OEF and elevated CBF was detected, consistent with prior studies6.Conclusion
Multi-modal hemo-metabolic MRI methods were applied in patients with distinct origins of elevated OEF.Acknowledgements
No acknowledgement found.References
1. Derdeyn CP, Videen TO, Yundt KD, et al. Variability of cerebral blood volume and oxygen extraction: Stages of cerebral haemodynamic impairment revisited. Brain. 2002;125:595-607
2. Lu H, Xu F, Grgac K, et al. Calibration and validation of trust mri for the estimation of cerebral blood oxygenation. Magnetic resonance in medicine. 2012;67:42-49
3. Lu H, Ge Y. Quantitative evaluation of oxygenation in venous vessels using t2-relaxation-under-spin-tagging mri. Magn Reson Med. 2008;60:357-363
4. Alsop DC, Detre JA, Golay X, et al. Recommended implementation of arterial spin-labeled perfusion mri for clinical applications: A consensus of the ismrm perfusion study group and the european consortium for asl in dementia. Magn Reson Med. 2015;73:spcone
5. Zaharchuk G, Do HM, Marks MP, et al. Arterial spin-labeling mri can identify the presence and intensity of collateral perfusion in patients with moyamoya disease. Stroke. 2011;42:2485-2491
6. Bush AM, Kato RM, Coates TD, et al. Cerebral tissue transit time in patients with sickle cell anemia. Blood. 2015;126:280-280
Figures