0142
4D Flow MRI for Assessment of Venous Pressure in Dural Arteriovenous Fistulas1Dept. of Medical Physics, University of Wisconsin-Madison, MADISON, WI, United States, 2Dept. of Radiology, University of Wisconsin-Madison, Madison, WI, United States
Synopsis
Dural arteriovenous fistulas (DAVFs) are vascular malformations that can present aggressively. Venous hypertension is the pathophysiologic mechanism thought to be responsible for aggressive presentation. 4D flow MRI has demonstrated success generating pressure maps from velocity data in vessels. In this work we measure relative pressure in the dural sinuses in DAVFs patients using 4D flow MRI. Results support the hypothesis that DAVFs result in venous hypertension which may be the mechanism ultimately leading to aggressive presentation. 4D flow MRI allows blood flow directionality assessment along the dural sinuses, which helps to detect retrograde flow and classify the severity of DAVFs.
Purpose:
Dural arteriovenous fistulas (DAVFs) are vascular malformations that can present aggressively with seizure, hypertensive encephalopathy, intracranial hemorrhage, or progressive myelopathy. Venous hypertension is the pathophysiologic mechanism thought to be responsible for aggressive presentation. Intraoperative ultrasound studies have shown that dural venous pressure is elevated in spinal DAVF patients with myelopathy.1 Venous pressure measurements of intracranial DAVFs have not been reported. 4D Flow MRI has emerged as a powerful tool to characterize the cerebrovasculature noninvasively. Previous work using 4D Flow MRI has demonstrated the feasibility of generating relative pressure maps from velocity data in blood vessels. This technique has been used to measure pressure noninvasively in cerebral aneurysms, the carotid artery, and across aortic coarctations.2,3 The purpose of this feasibility study is to measure flow relative pressure in the dural sinuses in the context of DAVFs and healthy controls. We report anatomical variations, and measures of flow and relative pressure in the dural sinuses. We hypothesized that venous pressure is elevated on the side of a DAVF compared to the contralateral side.Methods:
Subjects: The study population consisted of 20 healthy subjects (age range 45-75y, mean=64y, 12F) and 7 subjects diagnosed with unilateral DAVFs affecting the transverse/sigmoid sinus (5 Type I and 2 Type IIa) (age range 33-72y, mean =52y, 2F). Subjects were scanned using a 3T clinical MRI system (MR750, GE Healthcare, Waukesha, WI) with an eight-channel head coil (Excite HD Brain Coil, GE Healthcare, Waukesha, WI). Volumetric PC MRI data with three-directional velocity encoding were acquired with a 3D radially undersampled sequence (PC VIPR4), with the following imaging parameters: velocity encoding (Venc) =80cm/s for controls and Venc= 100 cm/s for DAVF subjects, imaging volume=(22x22x16cm3), isotropic spatial resolution=(0.7mm)3, TR/TE=7.4/2.7ms, 14,000 projection angles, scan time~7min, flip angle α= 10 degrees, bandwidth= 83.3 kHz.4 Time averaged velocity data were generated via an offline reconstruction for all subjects. Vessel segmentation and pressure quantification were performed in a customized post-processing tool (MATLAB, Mathworks, Natick, MA) based on the Navier-Stokes equations, and assumes blood to be both incompressible and Newtonian.3 Interactive visualization of flow streamlines and pressure maps were carried out in Ensight (CEI, Apex, NC). The anatomy of the dural sinus including the transverse sinus (TS), straight sinus (STS) and superior sagittal sinus (SSS) were classified according Gorkce et.5 Two cut planes in each TS (left & right) were place proximal (25 mm) and distal (50mm) to the torcular Herophili for quantification of pressure differences and flow. All exams were conducted using IRB approved protocols. Statistical analysis was performed using paired student’s t-test (significance at P<0.05).Results:
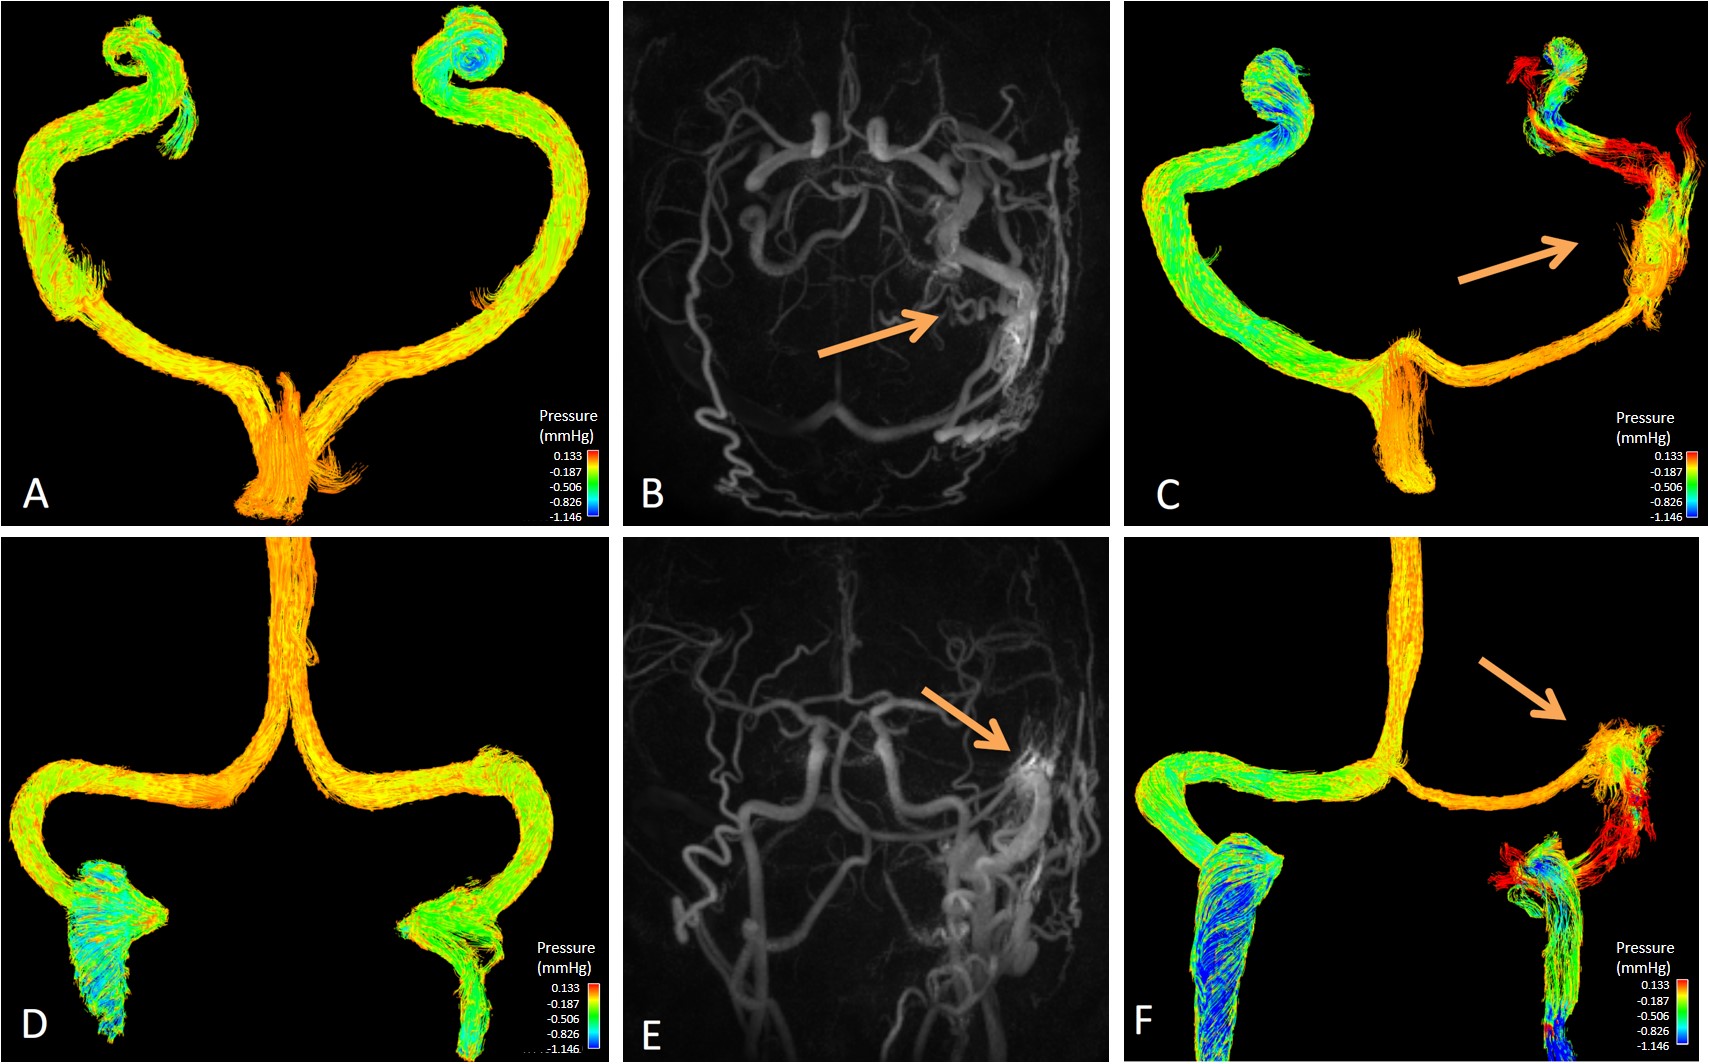
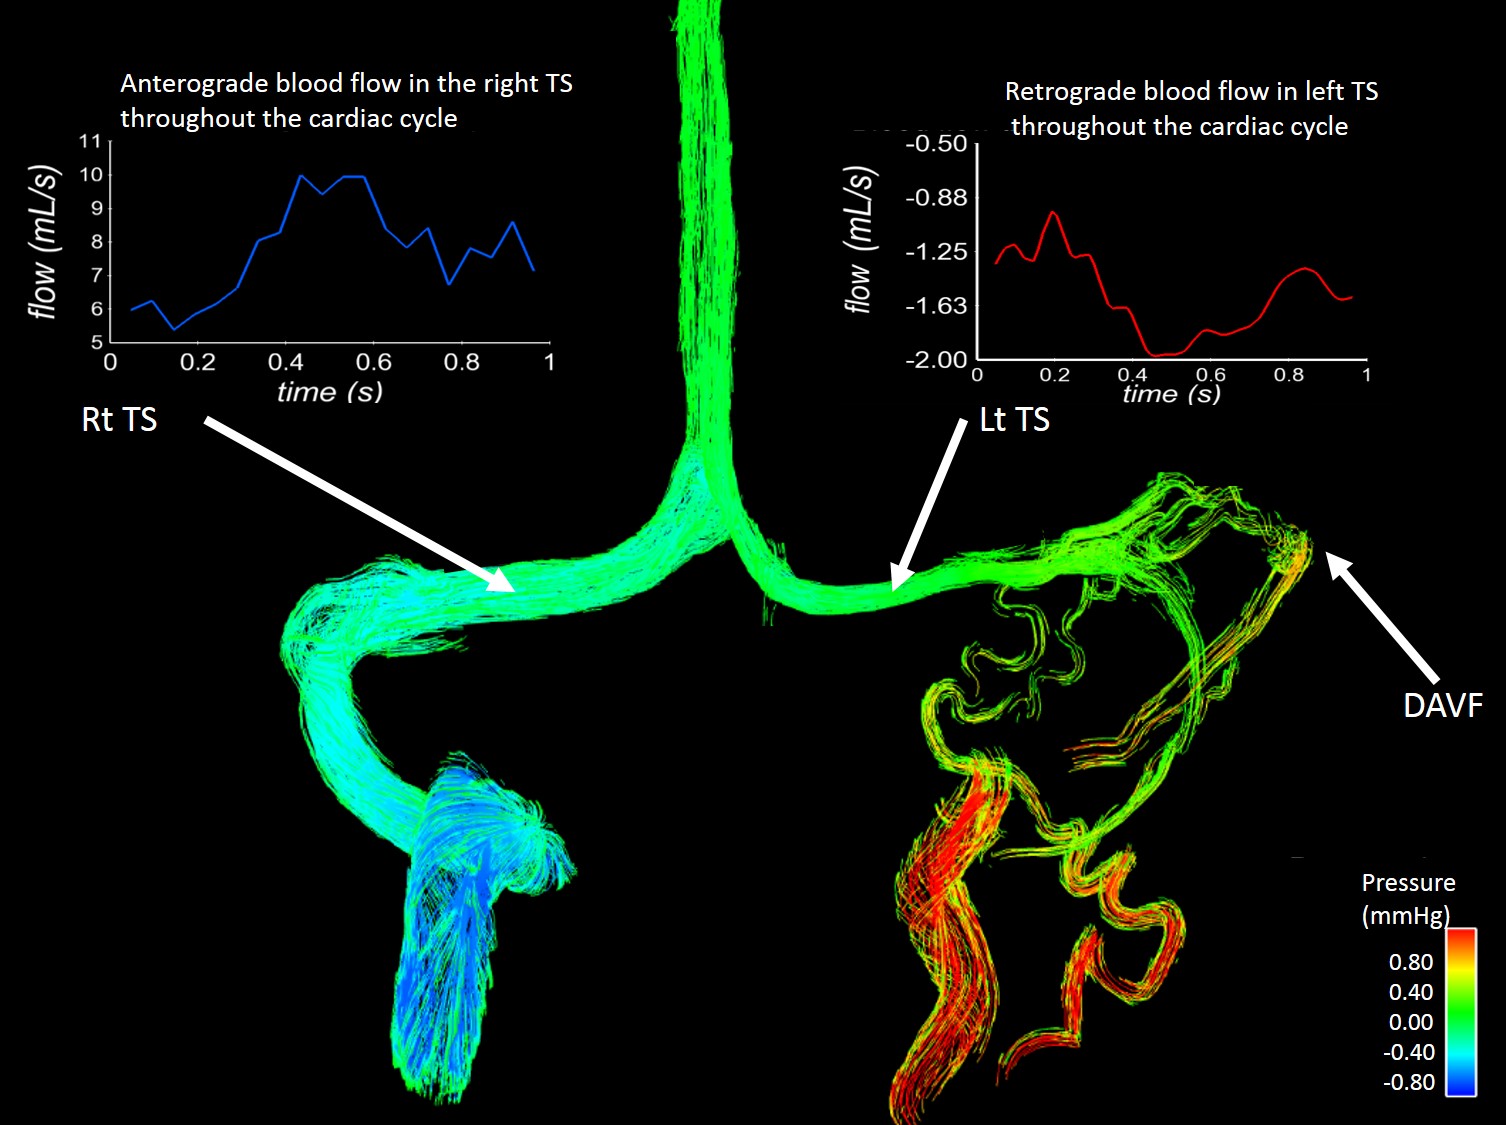
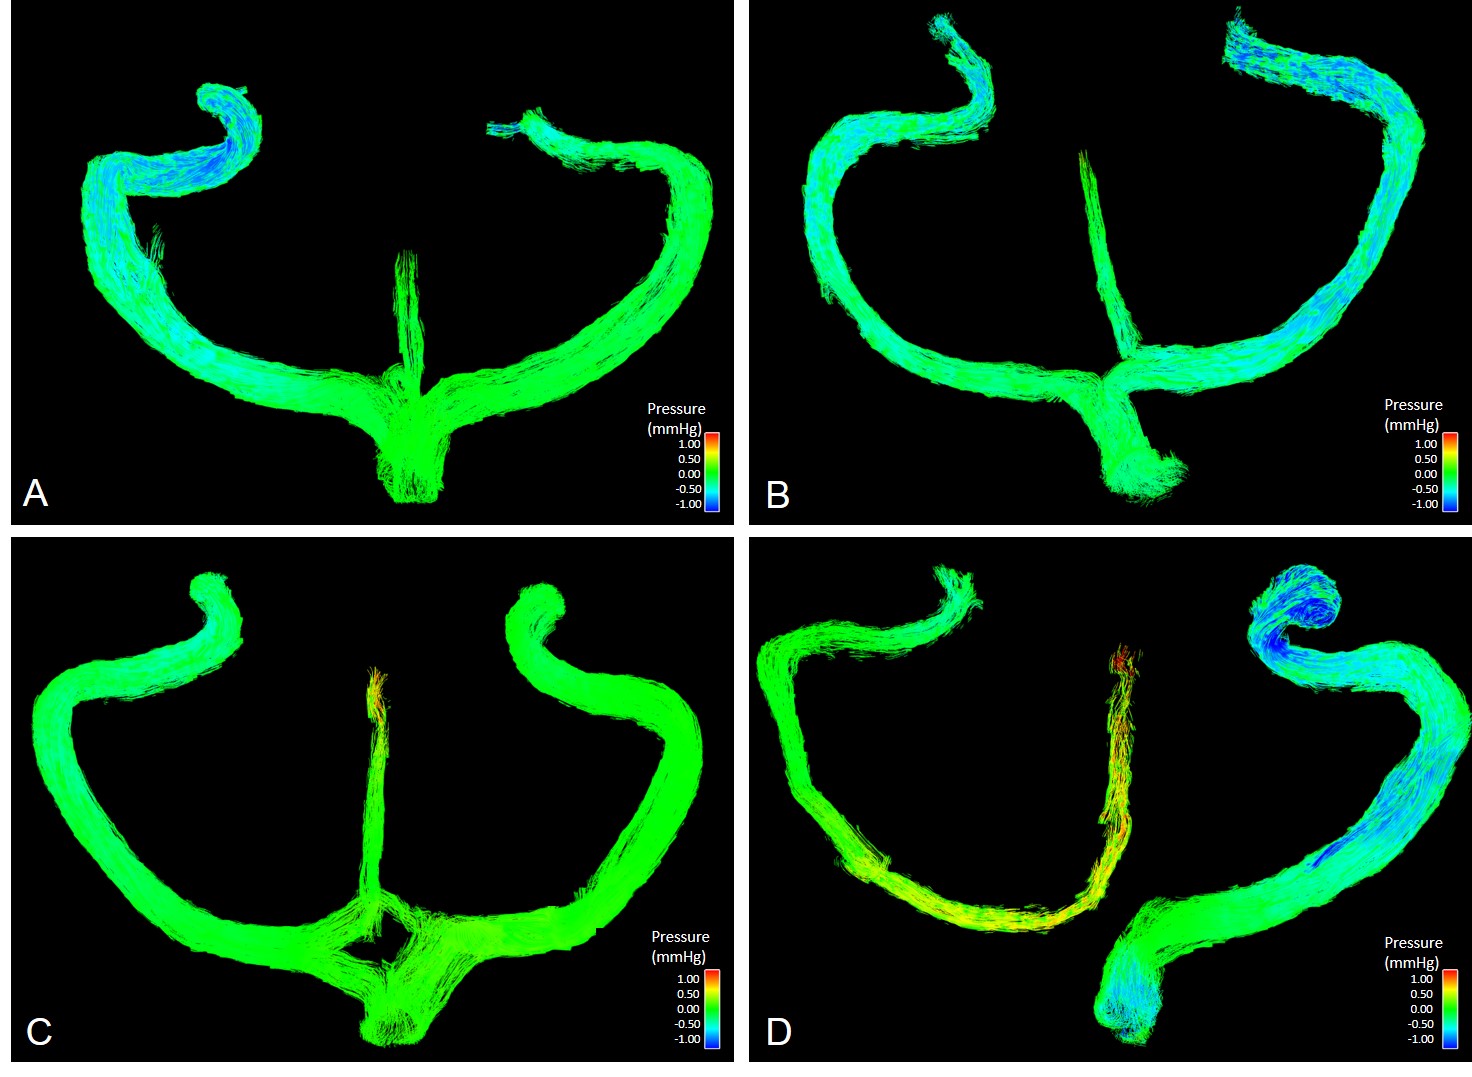
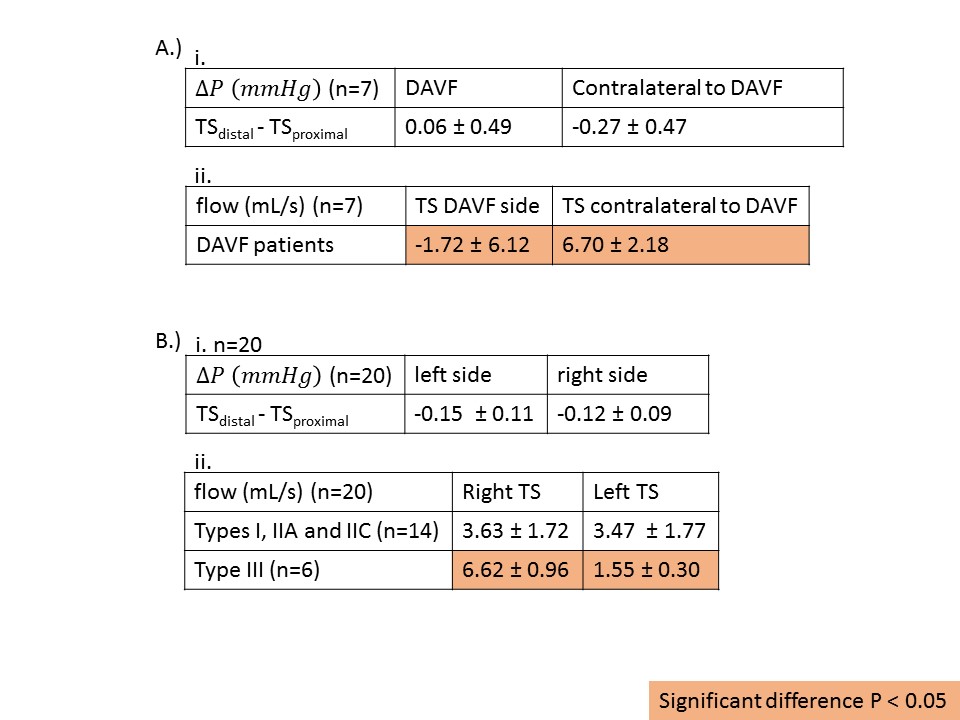
Figure 1 shows that dural sinus pressure is elevated on the side of the DAVF compared to the contralateral side and to pressure measurements in a healthy control. Venous pressure variations in the dural sinuses were more common in DAVFs compared to normal controls were pressure differences were similar bilaterally. Figure 2 shows another pressure color map in a DAVF patient and corresponding blood flow curves were generated from the 4d Flow MRI data. The blood flow in the left TS is retrograde, while in the right TS is anterograde, confirming the presence of a Type IIa DAVF on the left side. Figure 3 shows color pressure maps of four common types of dural sinus anatomies in healthy controls. Figure 4 shows numerical values for pressure changes and flow in the left and right TS in DAVF patients and healthy controls. Pressure slightly increases downstream along the TS with the DAVF, while it decreases downstream on the contralateral side. The average flow in the TS with DAVF is retrograde, while flow is anterograde in the contralateral side. In healthy controls pressure drops downstream in the TS bilaterally. Blood flow measurements are similar in the TS bilaterally for Types I, IIA and IIC anatomies, but significantly different for Type III as expected.Discussion and Conclusion:
Noninvasive relative pressure measurements in the dural sinuses are feasible with 4D Flow MRI. Initial findings support the hypothesis that DAVFs result in venous hypertension which may be the mechanism ultimately leading to aggressive presentation. Venous pressure measurements must be interpreted in the context of dural sinus anatomical variants, which are associated with pressure variation in healthy controls. 4D Flow MRI allows blood flow directionality assessment along the dural sinuses, which helps to detect retrograde flow and classify the severity of DAVFs. 4D Flow MRI can provide insight to the pathophysiological conditions of this disease, and can help clinicians in the characterization and classification of DAVFs.Acknowledgements
We gratefully acknowledge ASNR Alzheimer’s Grant Award and GE Healthcare for assistance and support.References
1. Hassler et al Hemodynamics of spinal dural arteriovenous fistulas J. Neurosurg 70:360-370, 1989.
2. Nett et al Noninvasive Pressure Measurement with 4D phase contrast MRI in Patients with Aortic Coarctation J Cardiovascular Mag Res 14 (Supp1):P106, 2012.
3. Moftakhar et al Noninvasive Measurement of Intra-Aneurysmal Pressure and Flow Pattern Using Phase Contrast with Vastly under sampled projection Imaging,AJNR 28:1710-1714, 2007.
4. Johnson K, Lum D, Turski P, et al. Improved 3D phase contrast MRI with off-resonance corrected dual echo VIPR. Magn Reson Med 2008; 60: 1329–1336.
5. Gökçe E1, Pinarbasili T, Acu B, Firat MM, Erkorkmaz Ü.. Torcular Herophili classification and evaluation of dural venous sinus variations using digital subtraction angiography and magnetic resonance venographies.Surg Radiol Anat. 2014 Aug;36(6):527-36. doi: 10.1007/s00276-013-1223-0. Epub 2013 Oct 24.
Figures