0138
Highly accelerated DCE imaging with integrated T1 mapping1GE Healthcare, Calgary, AB, Canada, 2Radiology, University of Calgary, Calgary, AB, Canada, 3Seaman Family Centre, Calgary, AB, Canada, 4Electrical Engineering, University of Southern California, Los Angeles, CA, United States
Synopsis
Dynamic contrast enhanced (DCE) MRI requires accurate and precise baseline T1 and M0 maps for pharmacokinetic modeling. Advances in dynamic acquisitions and reconstructions have enabled high resolution DCE imaging with full anatomical coverage. Rapidly obtaining high SNR T1/M0 maps with the same spatial resolution has become a limiting factor for advanced DCE methods. We present a single highly accelerated acquisition that first performs the T1/M0 mapping then dynamic imaging. A model-based reconstruction is used to estimate the T1/M0 maps. This method makes effective use of scan time and generates maps that are superior to separately acquired ones.
Purposes
To develop a method for accelerated dynamic contrast enhanced (DCE) imaging incorporating baseline T1 and M0 mapping. To simply workflow, save scan time, and improve reliability of DCE MRI by combining multiple previously separate acquisitions.Methods
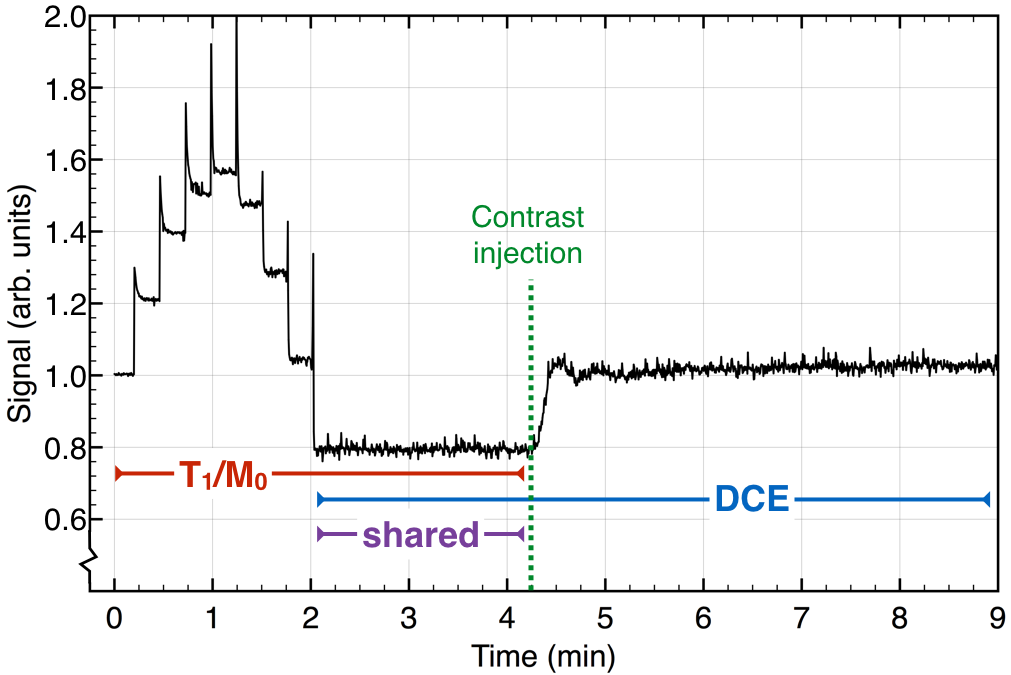
T1 mapping and DCE imaging were combined into a single 3D spoiled gradient echo acquisition. Data were acquired on a 3T GE MR750. The two phase encode directions were sampled sparsely according to a phyllotaxis spiral pattern suitable for dynamic imaging. The flip angle increased incrementally from 1.5° to 15°. Eight flip angle increments were performed every 3400 TR periods (totaling 9 flip angles and 27200 TR periods) after which the flip angle was held constant at 15° for the remainder of the scan. The contrast injection occurred approximately midway through the entire scan, well after the flip angles reached 15°. TR was 5.0 ms; TE was 1.8 ms, FOV was 240x240x240 mm3, matrix size was 256x240x120. The signal in the centre of k-space acquired in each spiral arm is shown in Figure 1. The global signal first increases with increasing flip angle then decreases as the flip angle approached 15°.
T1 and Mo maps were obtained using data acquired prior to the contrast injection (Figure 1). Parameter maps ($$$p$$$, a concatenated vector representation of T1 and Mo) were reconstructed by solving the constrained minimization problem given by:
$$p=\min_p \left\{ ||\text{F}_u\text{S}\text{D}p - k||_2^2+\lambda||\Psi\text{D}p||_1 \right\}$$
Where $$$\text{F}_u$$$ is the undersampled Fourier transform,
$$$\text{S}$$$ is the coil sensitivity, $$$\text{D}$$$ transforms parameter maps into variable flip angle
images, $$$\Psi$$$ is a 3D spatial wavelet transform, $$$k$$$ is the sparsely sampled k-space
data, and $$$\lambda$$$ is a regularization factor. This was solved with a POCS algorithm
that alternated between enforcing data consistency and
soft thresholding wavelet sparsity. Maps
were compared to separately acquired variable flip angle data using flip angles
of 2°, 7°, and 15°.
Results
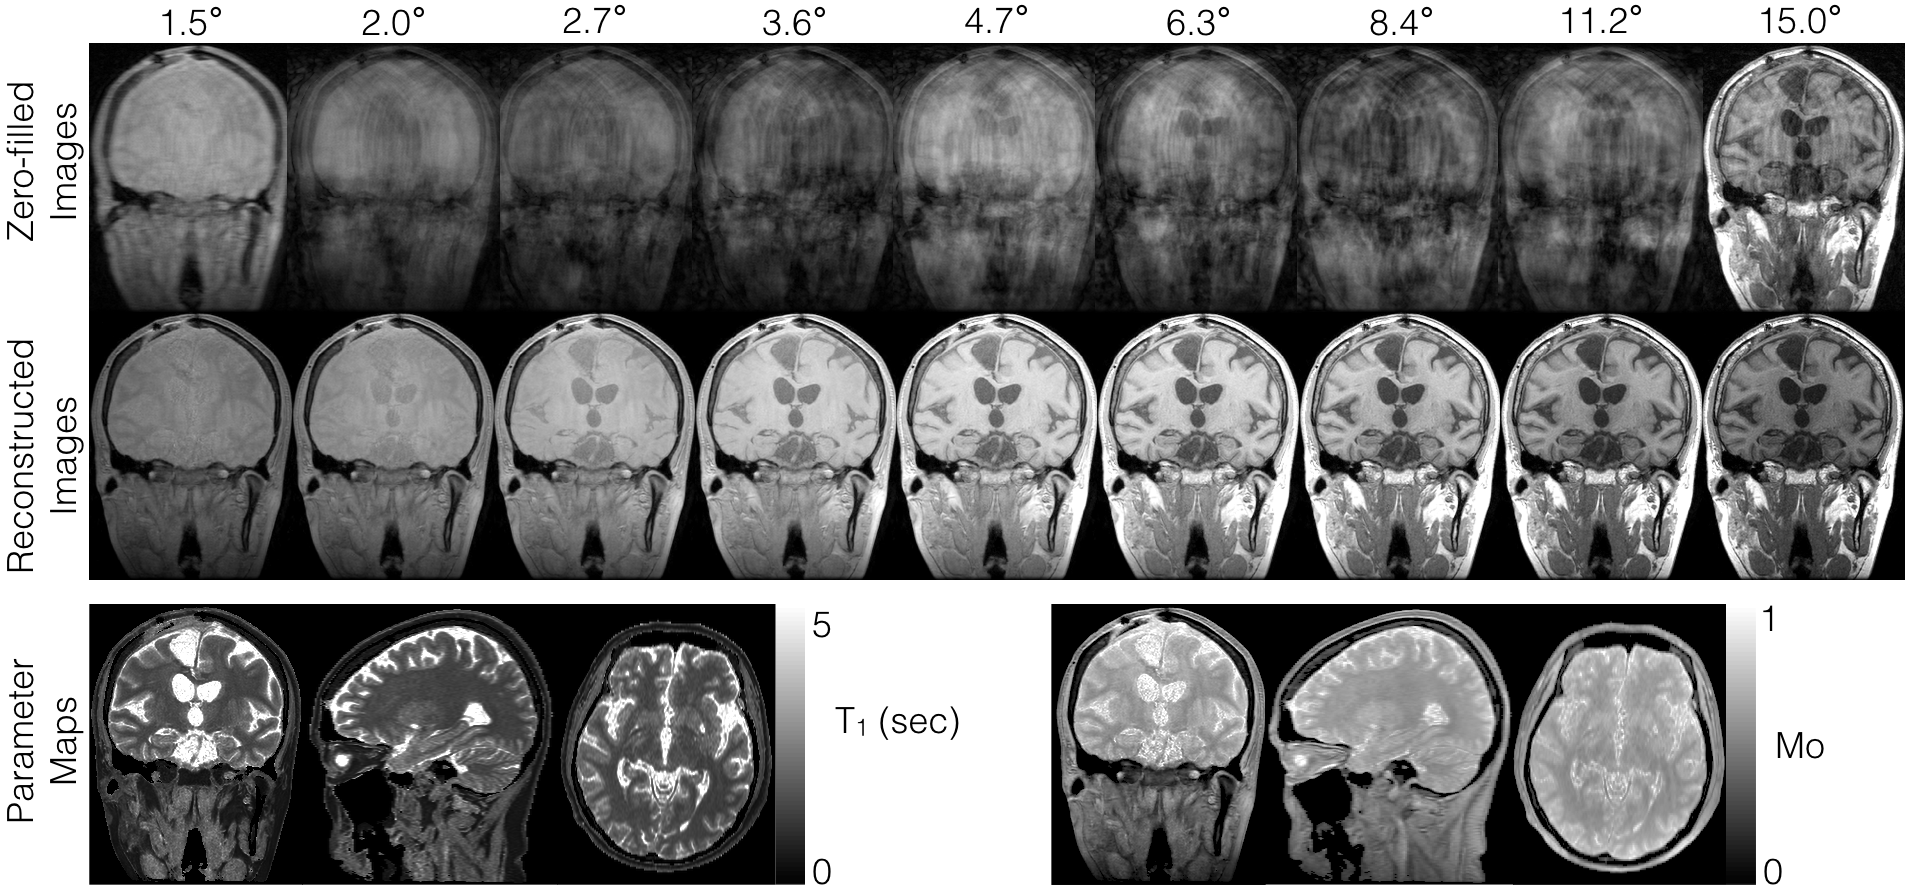
Zero-filled images prior to reconstruction and those obtained after model-based reconstruction at all nine flip angles and the final parameters maps are shown in Figure 2. Model based reconstruction provides effective reconstruction of variable flip angle images and produces high quality T1 and M0 maps suitable for pharmacokinetic modelling.
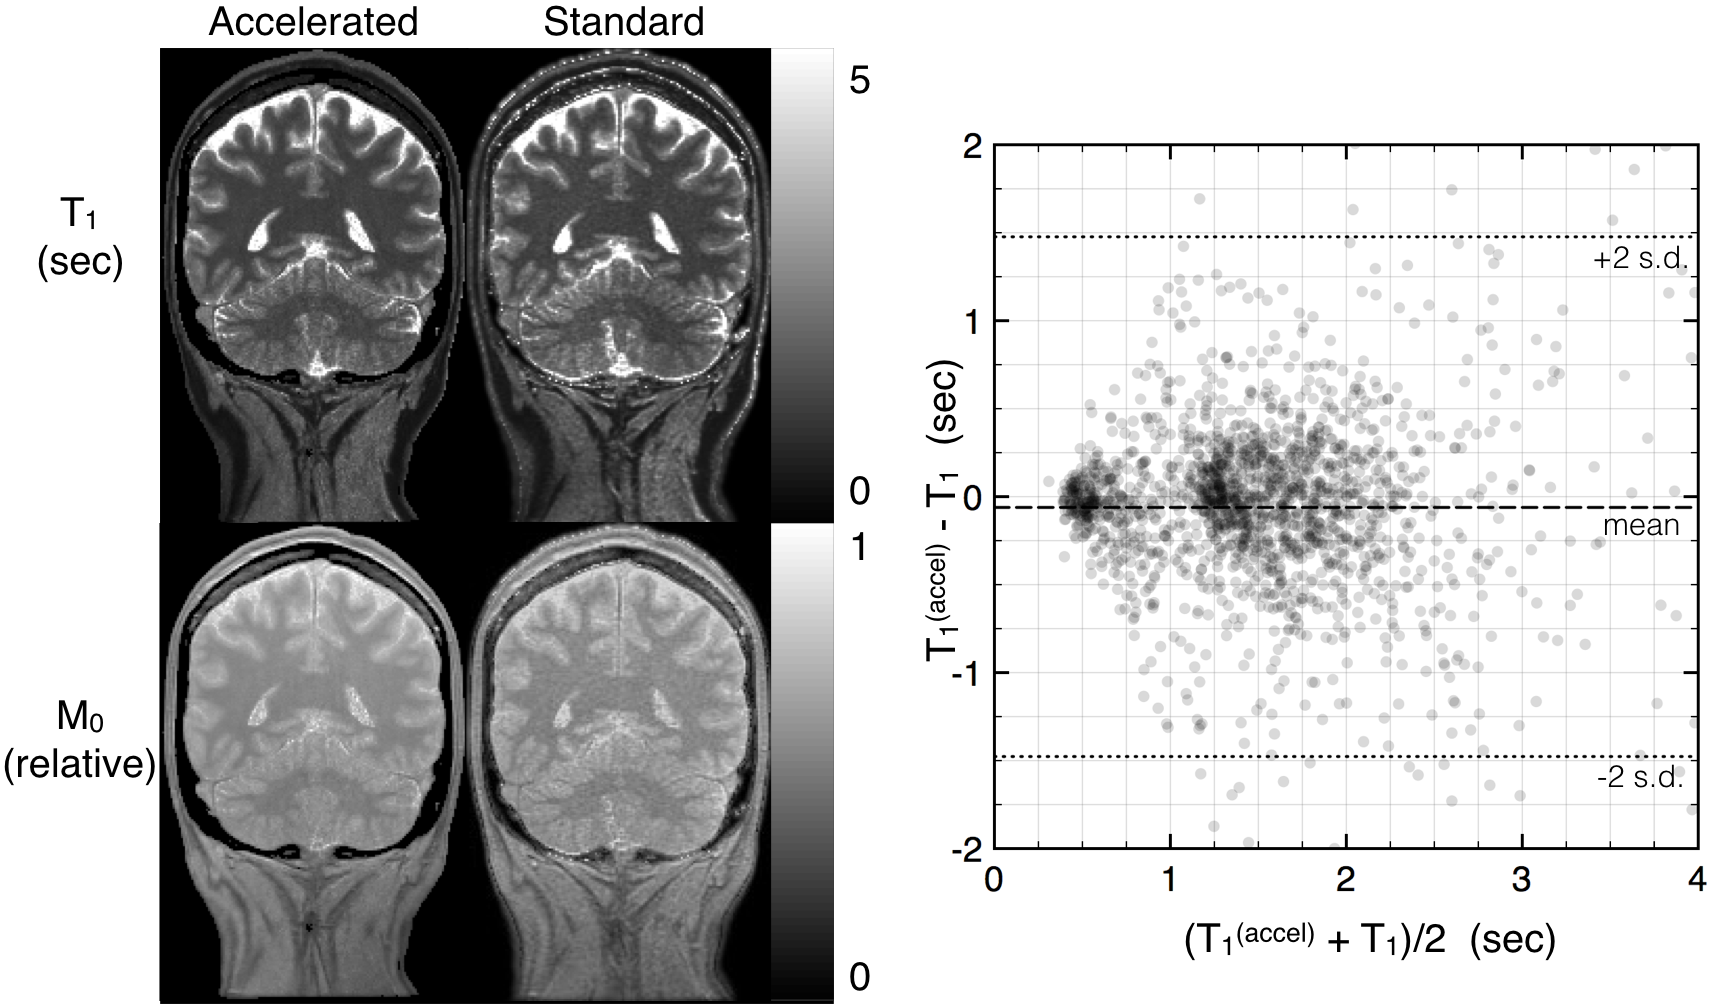
T1 and M0 maps obtained with the accelerated method demonstrated better SNR than those obtained with standard DESPOT1 (Figure 3). The Bland-Altman plot comparing the T1 values of both methods confirmed no relevant bias (mean difference of -61 ms), suggesting the accelerated method is equally accurate as conventional DESPOT1. The proposed method provided higher SNR parameter maps: the variance in a small homogenous white matter region (~200 voxels) was 103 ms with standard DESPOT1 and 66 ms with the proposed method.
Discussion
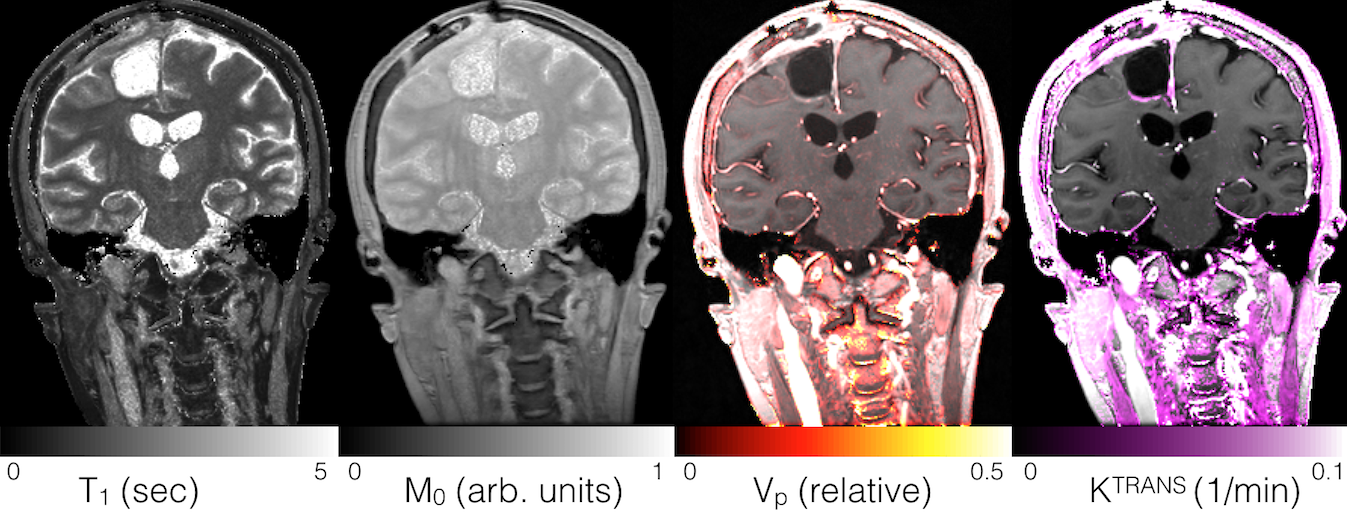
This approach allows efficient acquisition of high resolution, full brain, T1 and M0 maps by combining their collection into the same scan as the dynamic imaging sequence. This provides a substantial reduction in total acquisition time relative to separately acquired maps for three reasons: First, this eliminates multiple prescriptions, scanner-user interactions, and pre-scan calibrations. Second, we employ high acceleration rates during the T1 mapping portion (~10x undersampling). Third, the data acquired after the flip angle increments but before contrast arrival is used in both T1/M0 mapping and to create the pre-contrast baseline image for DCE analysis. Additionally, this approach ensures that system settings, including transmit and receive gains, and imaging scaling are identical between T1/M0 mapping and the subsequent DCE acquisition, thus facilitating pharmacokinetic modeling. This approach will also facilitate joint modeling of T1, M0, and contrast concentration [1]. Ultimately this method provides an integrated and effective means for performing full coverage, high resolution, quantitative DCE imaging (Figure 4).Conclusion
This method provides a practical approach to obtain the high quality T1 and M0 maps needed for pharmacokinetic modeling of DCE data. This approach is faster and provides higher SNR maps than does conventional DESPOT1 while simplifying workflow and possibly improving reliability of quantitative permeability maps.Acknowledgements
This work was funded by the Natural Sciences and Engineering Research Council of Canada.References
[1] Dickie, B. R., et al. (2016). Improved accuracy and precision of tracer kinetic parameters by joint fitting to variable flip angle and dynamic contrast enhanced MRI data. Magnetic Resonance in Medicine, 76(4), 1270–1281.Figures