0136
Magnetic Resonance Fingerprinting - Evaluation of Brain Gliomas in Comparison to a Conventional Advanced Tumor Protocol - Preliminary Study1Department of Biomedical Imaging and Image-guided Therapy, Medical University of Vienna, High Field MR Center, Vienna, Austria, 2Christian Doppler Laboratory for Clinical Molecular MR Imaging, Vienna, Austria, 3Siemens Healthineers, Erlangen, Germany, 4Department of Biomedical Imaging and Image-guided Therapy, Medical University of Vienna, Vienna, Austria
Synopsis
Synopsis: MR Fingerprinting (MRF) was compared to an advanced brain tumor protocol in 10 patients with surgically proven gliomas. The T1 and T2 relaxation times provided by MRF in one scan showed a high correlation with conventionally measured T1 and T2 values. MRF obtained T1 and T2 values allowed a statistically significant differentiation between low and high grade gliomas. MRF with quantitative data and the possibility to generate synthetic MR contrast images may replace conventional MR sequences in the future.
Target audience:
Physicians, radiologists and physicists interested in multi-parametric imaging of brain tumors.Introduction
Introduction: Recently introduced MR Fingerprinting (MRF) [1] takes a completely different approach to data acquisition, post-processing and visualization. MRF uses a pseudo randomized acquisition that causes the signals from different tissues to have a unique signal evolution or ‘fingerprint’ that is simultaneously a function of the multiple tissue properties. The processing after acquisition involves a pattern recognition algorithm to match the fingerprints to a predefined dictionary of predicted signal evolutions. These can then be translated into quantitative maps of the region of interest. There have already been promising preliminary reports [2] [3] on the use of MRF in different clinical applications, but its value in comparison to a conventional advanced MR protocol for the evaluation of brain tumors has not yet been demonstrated. Therefore the aim of our study was twofold: 1) to compare MRF generated T1 and T2 relaxation times in patients with brain gliomas to conventionally acquired T1 and T2 relaxation time measurements. 2) to compare the results of MRF generated T1 and T2 values to the results of a conventional advanced MR brain tumor protocol.Methods
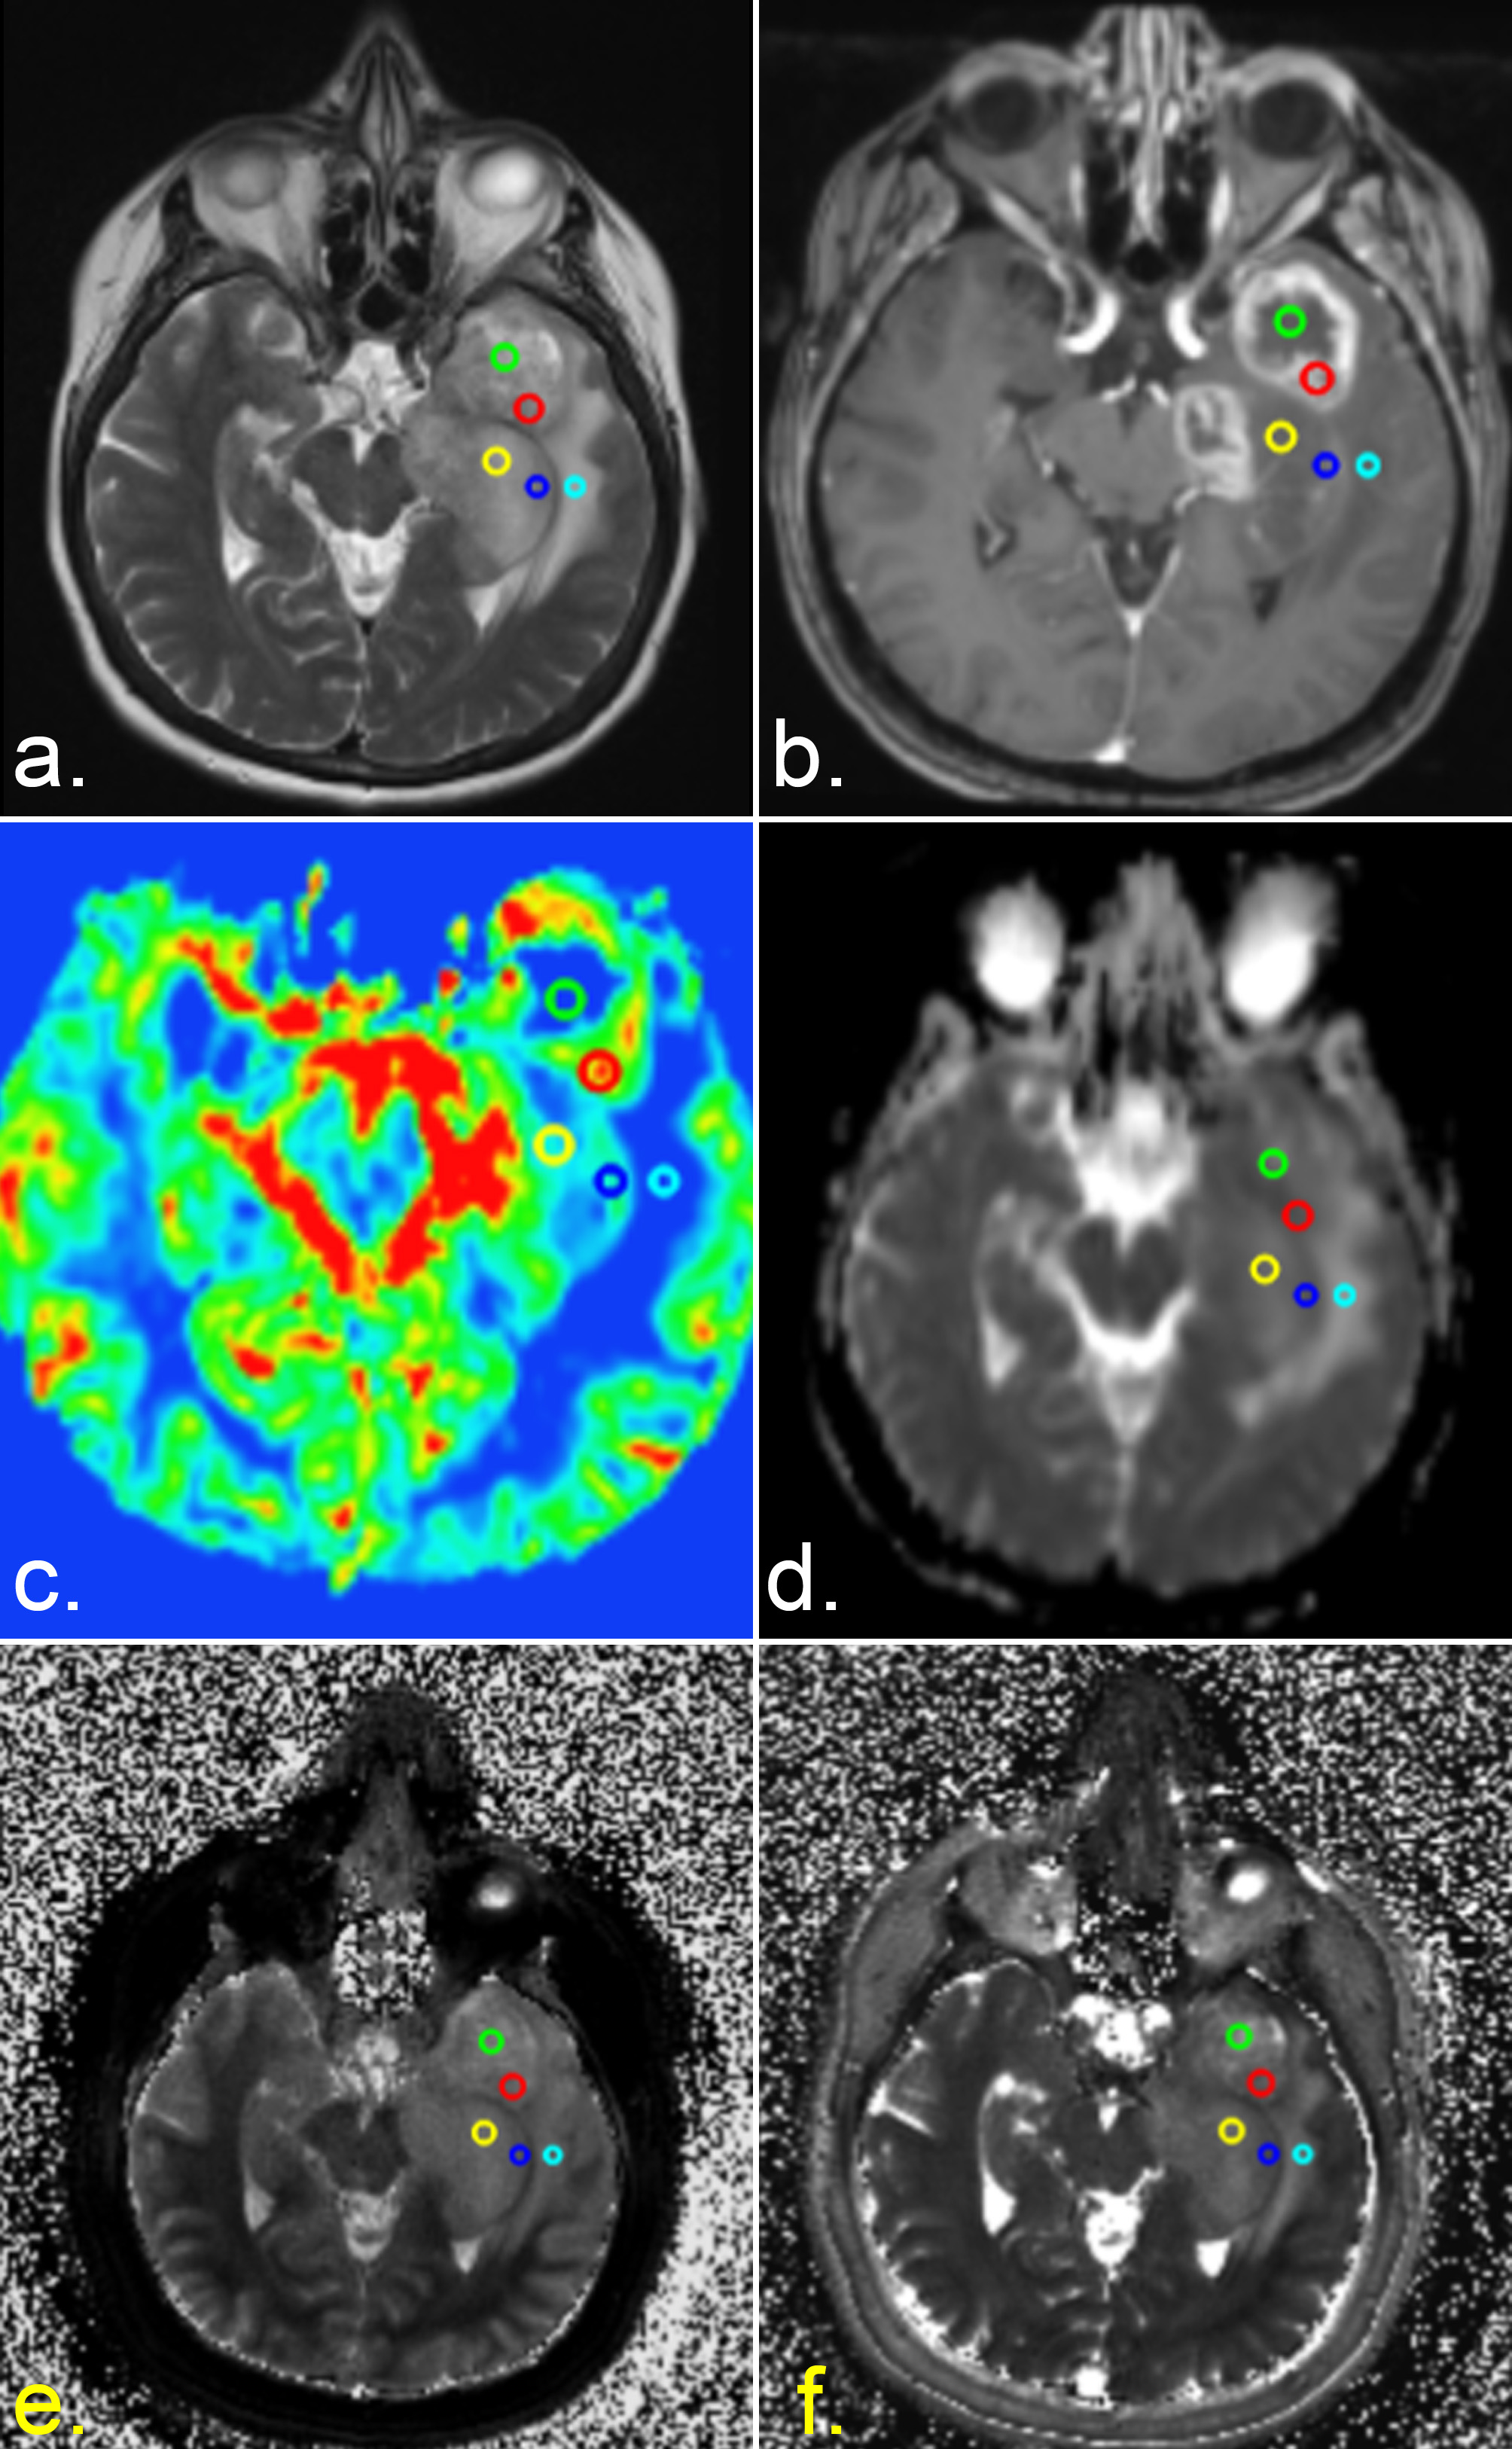
Methods: Ten patients with brain tumors (5 female, 5 male) with a mean age of 48.7 years (age range 30-68 years) were included in the study. The local ethics committee approved this study. Written, informed consent was obtained from all subjects. According to histologic findings after surgery five patients were diagnosed with a high grade, five patients with a low-grade glioma. The conventionally performed advanced MR brain tumor protocol comprised the following sequences: 2D FLAIR-TSE , 3D SWI, DWI, 2D T2-TSE, 3D T1 MPRAGE pre-/post –contrast, PWI, CSI spectroscopy and were performed at 3 Tesla. Total measurement time for the brain tumor protocol was about 60 minutes. The MRF sequence was performed on a 1.5 T scanner (AERA Siemens Healthineers, Erlangen, Germany) with a gradient strength of 45 mT/m and a slew rate of 125 T/m/s. The MRF sequence was based on a FISP (fast imaging with steady-state precession) acquisition scheme with a series of 3000 spiral images acquired at variable TR (14-17 ms), and variable flip angles (0°-75°). The spiral readout was designed with highly under-sampled, variable density k-space trajectories for a resolution of 1.2 mm. Resulting scan time per slice was 48 s. In addition to the MRF sequence, established quantitative MR sequences for measurements of T1 and T2 with a multi-echo spin echo based sequences and fast double inversion recovery based MR sequences were applied. MRF data processing was performed online at the MR scanner based on a dedicated “fingerprinting dictionary” [1]. The advanced brain tumor protocol and the MRF protocol were co-registered with minctracc from the minc tool kit. On T2-TSE and FLAIR-TSE sequences the following ROIs were selected using Olea Sphere, version 3.0 (Olea Medical): solid part of the tumor, noncontrast and contrast-enhanced parts of the tumor, peritumoral edema, normal appearing white matter (NAWM) < and > 1 cm perilesional and NAWM in the centrum semiovale of the contralateral hemisphere.Results
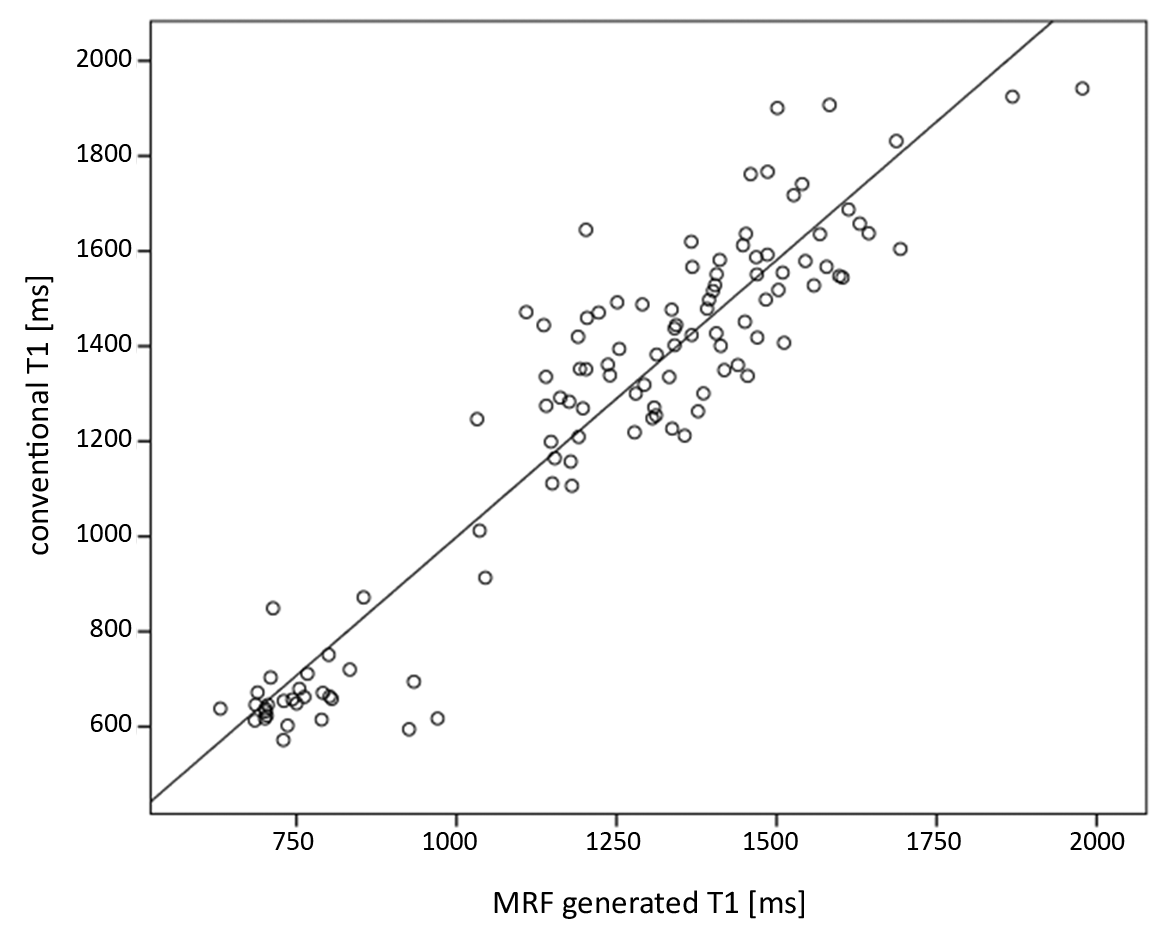
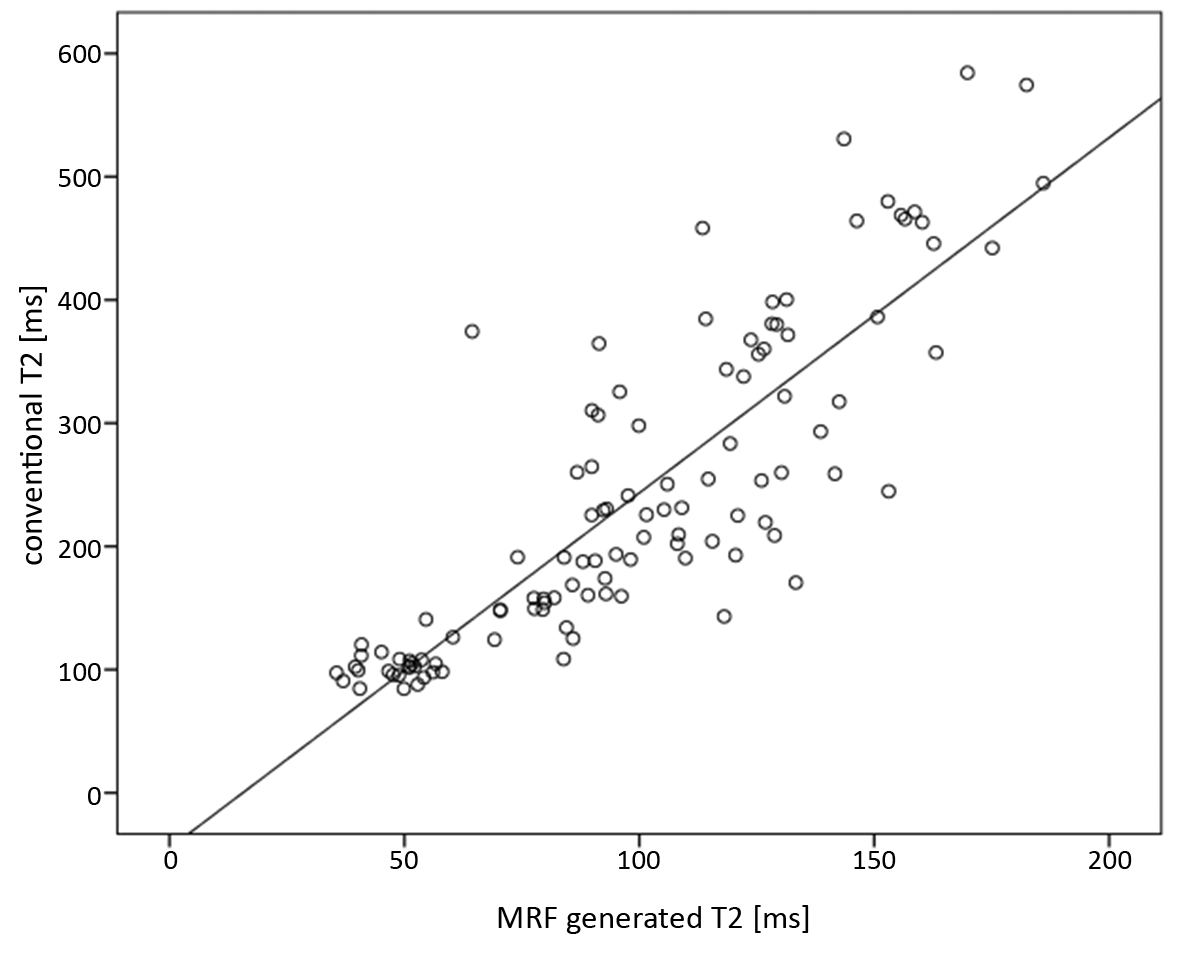
Results: A high correlation between MRF obtained T1 and T2 relaxation time values from different types of tissue (NAWM, tumor, perlesional edema) and conventionally measured T1 and T2 values were found, with a Pearson correlation coefficient of 0.938 (p < 0.000) and 0.852 (p < 0.000) respectively (Fig. 1 and 2). A statistically significant difference between NAWM and solid tumor components was shown on MRF T1 values (p < 0.001) and between solid parts of the tumor and perilesional edema for MRF T1 as well as T2 values (p < 0.001, respectively). MRF T1 and T2 values revealed a statistically significant difference between contrast and non-contrast-enhancing solid tumor areas (p < 0.001 for both). MRF obtained T1 and T2 values allowed a differentiation between low- and high- grade gliomas (p < 0.05 and p = 0.01, respectively).Discussion:
Discussion: In patients with surgically proven low- and high-grade gliomas, the T1 and T2 values obtained with MRF in a single sequence in normal brain tissue, in edema, and in tumorous tissue, showed an excellent correlation with conventionally acquired T1 and T2 mapping techniques. Clinically, T1 and T2 relaxation time values generated by MRF alone allow a differentiation between tumor and NAWM, tumor and perilesional edema, between contrast and non-contrast uptake in solid tumor portions, and finally allow a differentiation between low- and high- grade gliomas.Conclusion:
MR Fingerprinting allows multi parametric quantitative tissue characterization of brain tumors from a single scan and has the potential to replace most traditional qualitative MRI contrast sequences.Acknowledgements
Authors would like acknowledge Mark Griswold for his support during the submission preparation.References
1. Ma, D., et al., Magnetic resonance fingerprinting. Nature, 2013. 495(7440): p. 187-92.
2. Chen, Y., et al., MR Fingerprinting for Rapid Quantitative Abdominal Imaging. Radiology,2016. 279(1): p. 278-86.
3. Hamilton, J.I., et al., MR fingerprinting for rapid quantification of myocardial T1 , T2 , and proton spin density. Magn Reson Med, 2016.
Figures