0134
Fat Signal Fraction Determination Using MR FingerprintingJason Ostenson1,2 and E. Brian Welch1,3,4
1Vanderbilt University Institute of Imaging Science, Vanderbilt University, Nashville, TN, United States, 2Program in Chemical and Physical Biology, Vanderbilt University, Nashville, TN, United States, 3Department of Radiology and Radiological Sciences, Vanderbilt University, 4Department of Biomedical Engineering, Vanderbilt University
Synopsis
Magnetic resonance fingerprinting employing multiple echo times is used to quantify fat signal fraction both in phantoms and in vivo on a human 3 Tesla scanner. Reasonable agreement is seen in fat signal fraction maps and intra-class correlation between standard and MRF methods.
Purpose
This work obtains fat signal fraction (FSF) maps for phantoms and in vivo with multiple echo time MR fingerprinting (MRF) measurements. Though MRF has shown to be an efficient means to obtain parameter maps of relaxation parameters T1 and T2 relaxation1,2, as well as to estimate B1+3, the authors are not aware of any published work in fat imaging using MRF.Methods
Seven 50 mL conical centrifuge tubes filled with varying concentrations of water-based agar gel and peanut oil were constructed to provide approximate percentage fat fractions of 0, 10, 20, 30, 40, 50 and 100. A single volunteer was scanned after informed consent under institutional review board approval. All scans were performed on a Philips Achieva 3 Tesla scanner (Philips Healthcare, The Netherlands) with a single-channel transmit/receive head-coil with a FOV of 240x240 mm2 and in-plane and through-plane resolution of 1 mm2 and 5 mm, respectively. An mDIXON sequence with 4 TEs with 1 ms spacing, flip angle of 5.0 degrees, and TR of 20 ms with five averages was used to create a FSF map from the resultant fat and water signal images on the phantoms. The unbalanced steady-state free precession (FISP) MRF sequence used the same variability in TR and identical flip angles as a previously reported2, using 1,000 acquisitions with a variable density spiral4 that undersampled k-space by a factor up to 48 at each acquisition with sampling window duration of approximately 7 ms. Each of the 1,000 acquisitions was acquired at three different echo times (1.5, 2.5, 3.5 ms). The 1,000 frames for all echo times were corrected for sample density and gridded5, then reconstructed. Each of the three TE image sets were summed across the time domain to produce input for quantitative fat-water separation6 that generated fat and water signal images that were used to calculate a FSF map for the in vivo case. A synthesized measurement of 1,000 spatially undersampled images was created by randomly selecting one of the TEs for each frame. Three standard MRF dictionaries were constructed by modeling the signal for a range of T1 and T2 values using an extended phase graph technique as previously reported2, with only the TE differing between the dictionaries. A fingerprinting water dictionary was created by selecting all T1 and T2 signal evolutions from the three TE dictionaries using the same random pattern as the synthetic measurement at each of the 1,000 MRF acquisitions. A fat dictionary was created by multiplying the water dictionary for all T1 and T2 values by a complex exponential to shift the phase of that acquisition according to its TE and a fat chemical shift of 440 Hz. Linear combinations of the fat and water dictionary were created for fat fractions ranging from 0.0 to 1.0 in increments of 0.05, a dictionary 21 times the length of the starting dictionary. A singular value decomposition (SVD) compression scheme7 was used to reduce the dimensionality of the composite dictionary and MRF signal to yield T1, T2, and fat fraction maps. For the phantom experiment MRF FSF maps were masked by a threshold set from the sum of the mDIXON fat and water magnitude images and ROIs were drawn on the mDIXON FSF map and used to acquire mean FSF and standard deviations for each phantom tube for the standard and MRF maps. These means were used to calculate an intra-class correlation (ICC) coefficient.Results
Figure 1 shows the fat fraction map using mDIXON and MRF in phantom, and Figure 2 displays the means of the ROIs for each acquisition type. The ICC coefficient was calculated to be 0.92, reflecting the relative agreement shown in the graph. The inhomogeneity of the MRF FSF map is a result of blurring due to the fat off-resonance and the spiral k-space acquisition. The in vivo FSF map for a transverse section of the brain near the orbits and temporal lobe is shown for the conventional fat-water separation approach6 and MRF method. There is general agreement of fat depots near the optic nerves, occipital bone, and subcutaneous fat lateral to the orbits, which show off-resonance blurring of the fat signal in both cases, and lesser agreement in low FSF regions.Conclusion
FSF MRF can be achieved in phantom and in vivo with reasonable quantitative agreement despite blurring. Improvements for fat off-resonance correction and implementing TE variability within the MRF acquisition itself should improve accuracy and efficiency of this technique.Acknowledgements
This work was supported in part by funding from NIH NIBIB T32 EB014841.References
1. Ma D, Gulani V, Seiberlich N, Liu K, Sunshine JL, Duerk JL, Griswold MA. Magnetic resonance fingerprinting. Nature. 2013;495(7440):187–192. 2. Jiang Y, Ma D, Seiberlich N, Gulani V, Griswold MA. MR fingerprinting using fast imaging with steady state precession (FISP) with spiral readout. Magnetic Resonance in Medicine. 2014;1631:1621–1631. 3. Buonincontri G, Sawiak SJ. MR fingerprinting with simultaneous B1 estimation. Magnetic Resonance in Medicine. 2015;0:1–9. 4. Pipe JG, Zwart NR. Spiral trajectory design: a flexible numerical algorithm and base analytical equations. Magnetic Resonance in Medicine. 2014;71(1):278–85. 5. http://www.ismrm.org/mri_unbound/sequence.htm. 6. Hernando D, Kellman P, Haldar JP, Liang ZP. Robust water/fat separation in the presence of large field inhomogeneities using a graph cut algorithm. Magnetic Resonance in Medicine. 2010;63(1):79–90. 7. McGivney DF, Pierre E, Ma D, Jiang Y, Saybasili H, Gulani V, Griswold MA. SVD compression for magnetic resonance fingerprinting in the time domain. IEEE Transactions on Medical Imaging. 2014;33(12):2311–2322.Figures
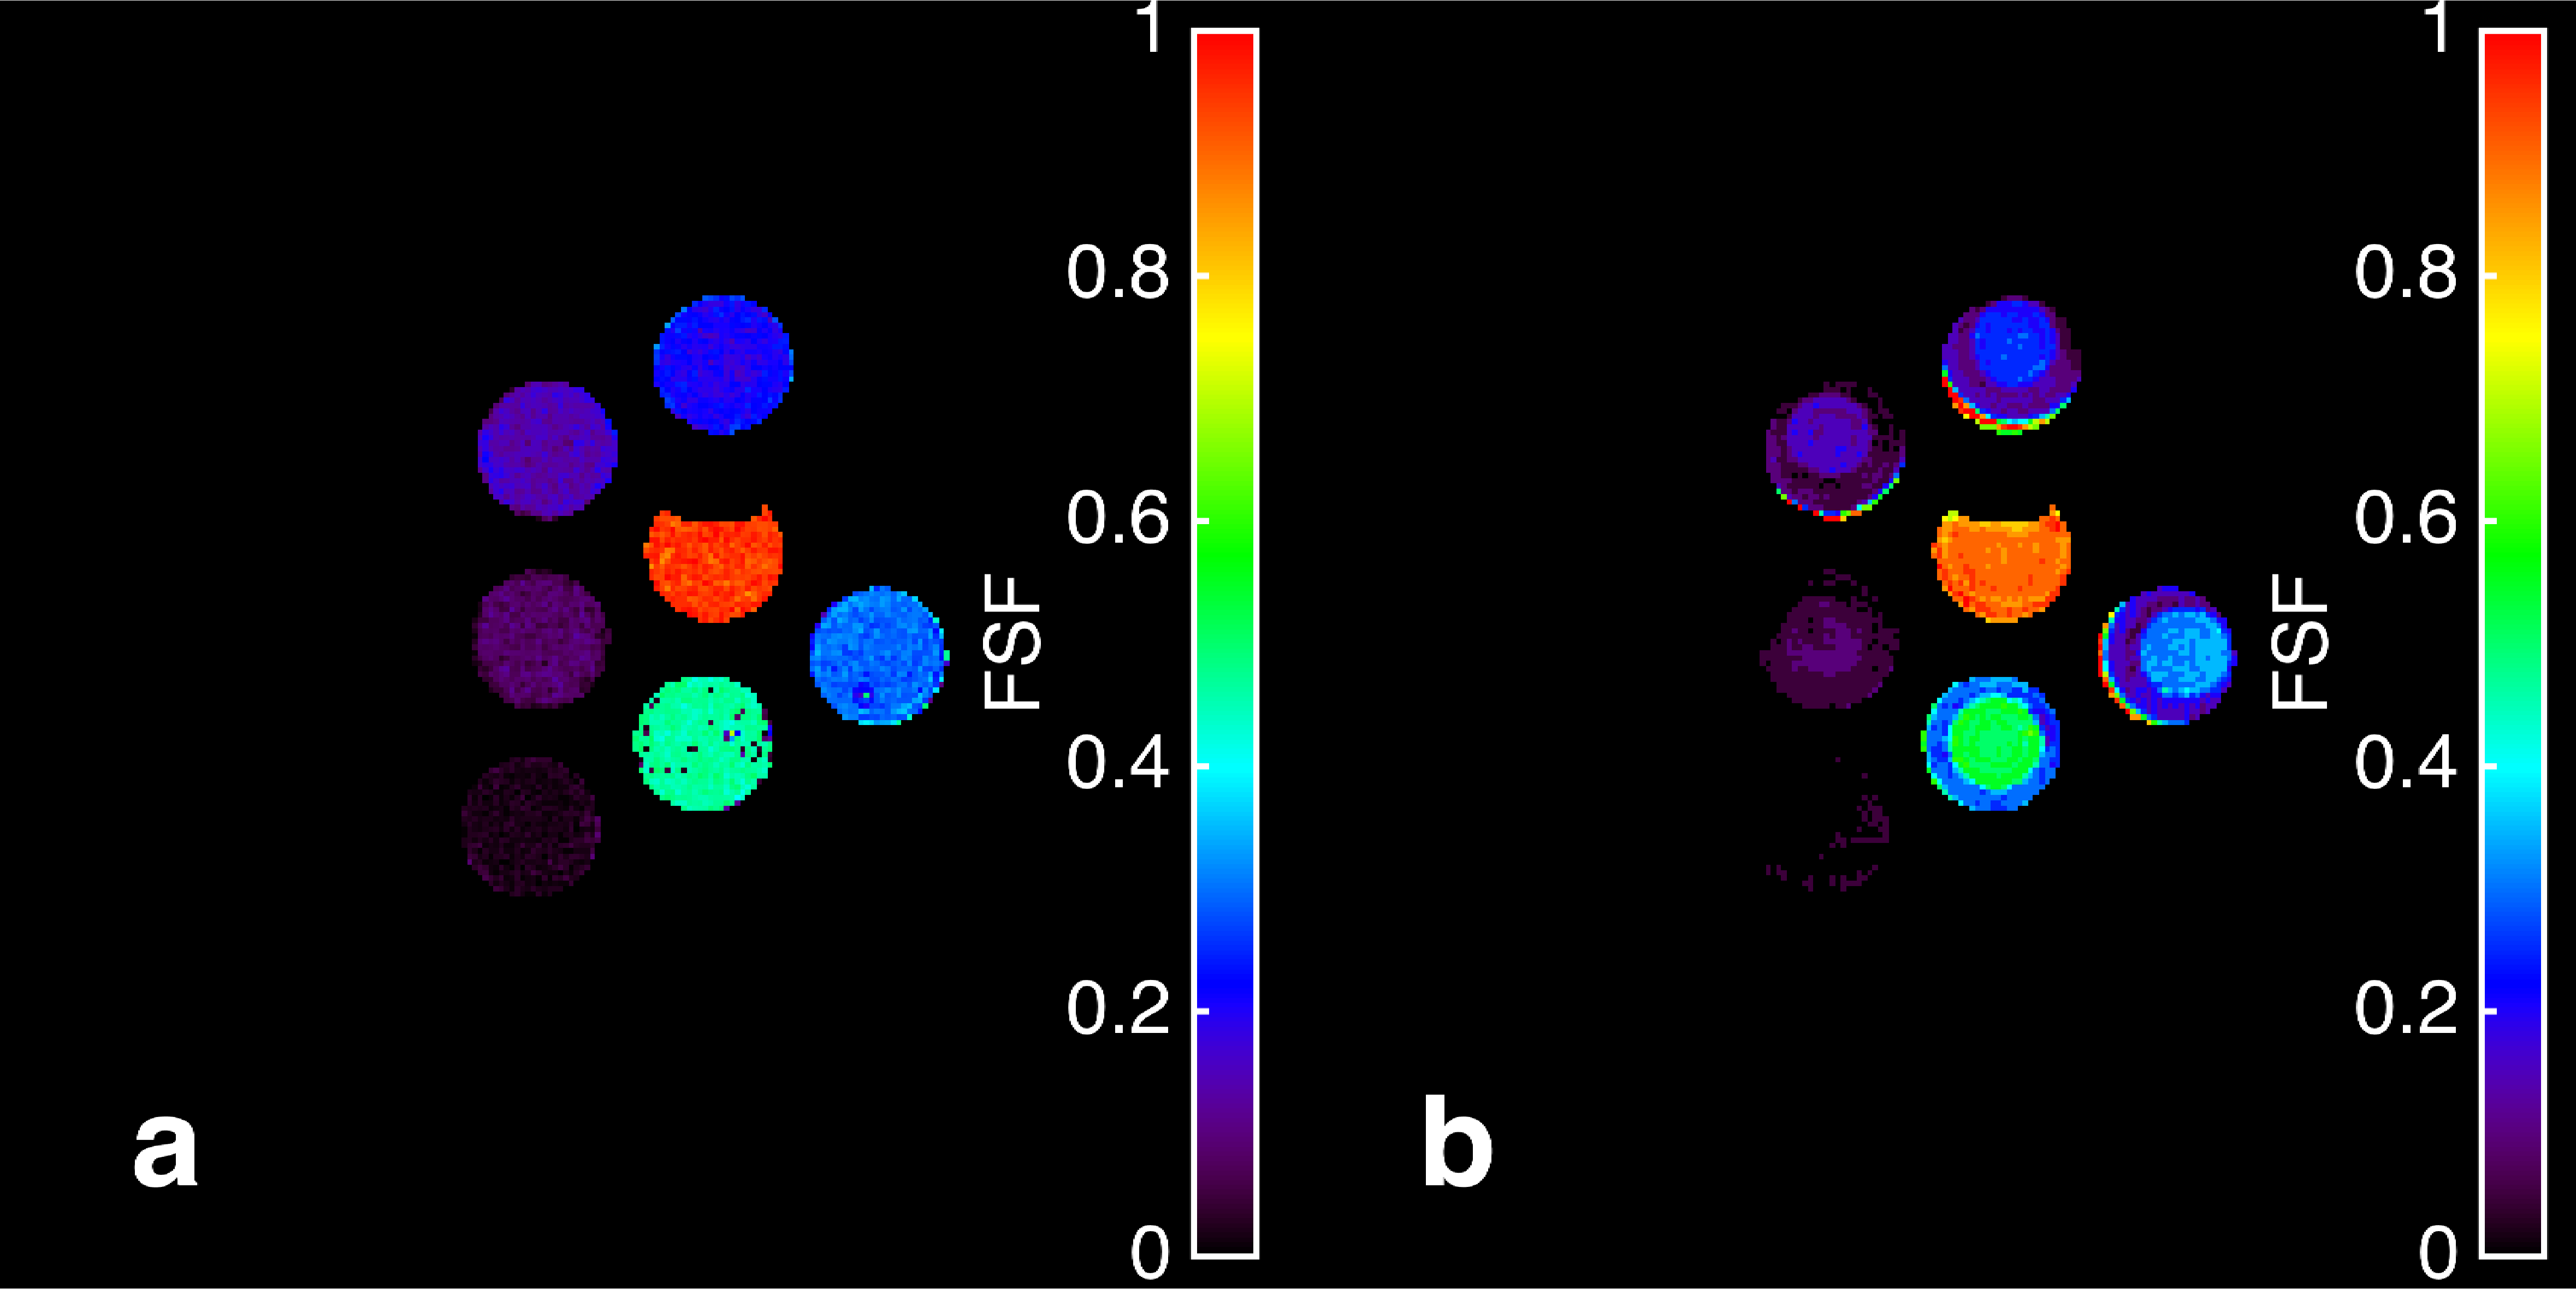
The fat signal fraction (FSF) maps for the
mDIXON (a) and MRF (b) techniques. The FSF heterogeneity of the MRF technique
is a result of the fat off-resonance blurring from the spiral k-space acquisition.
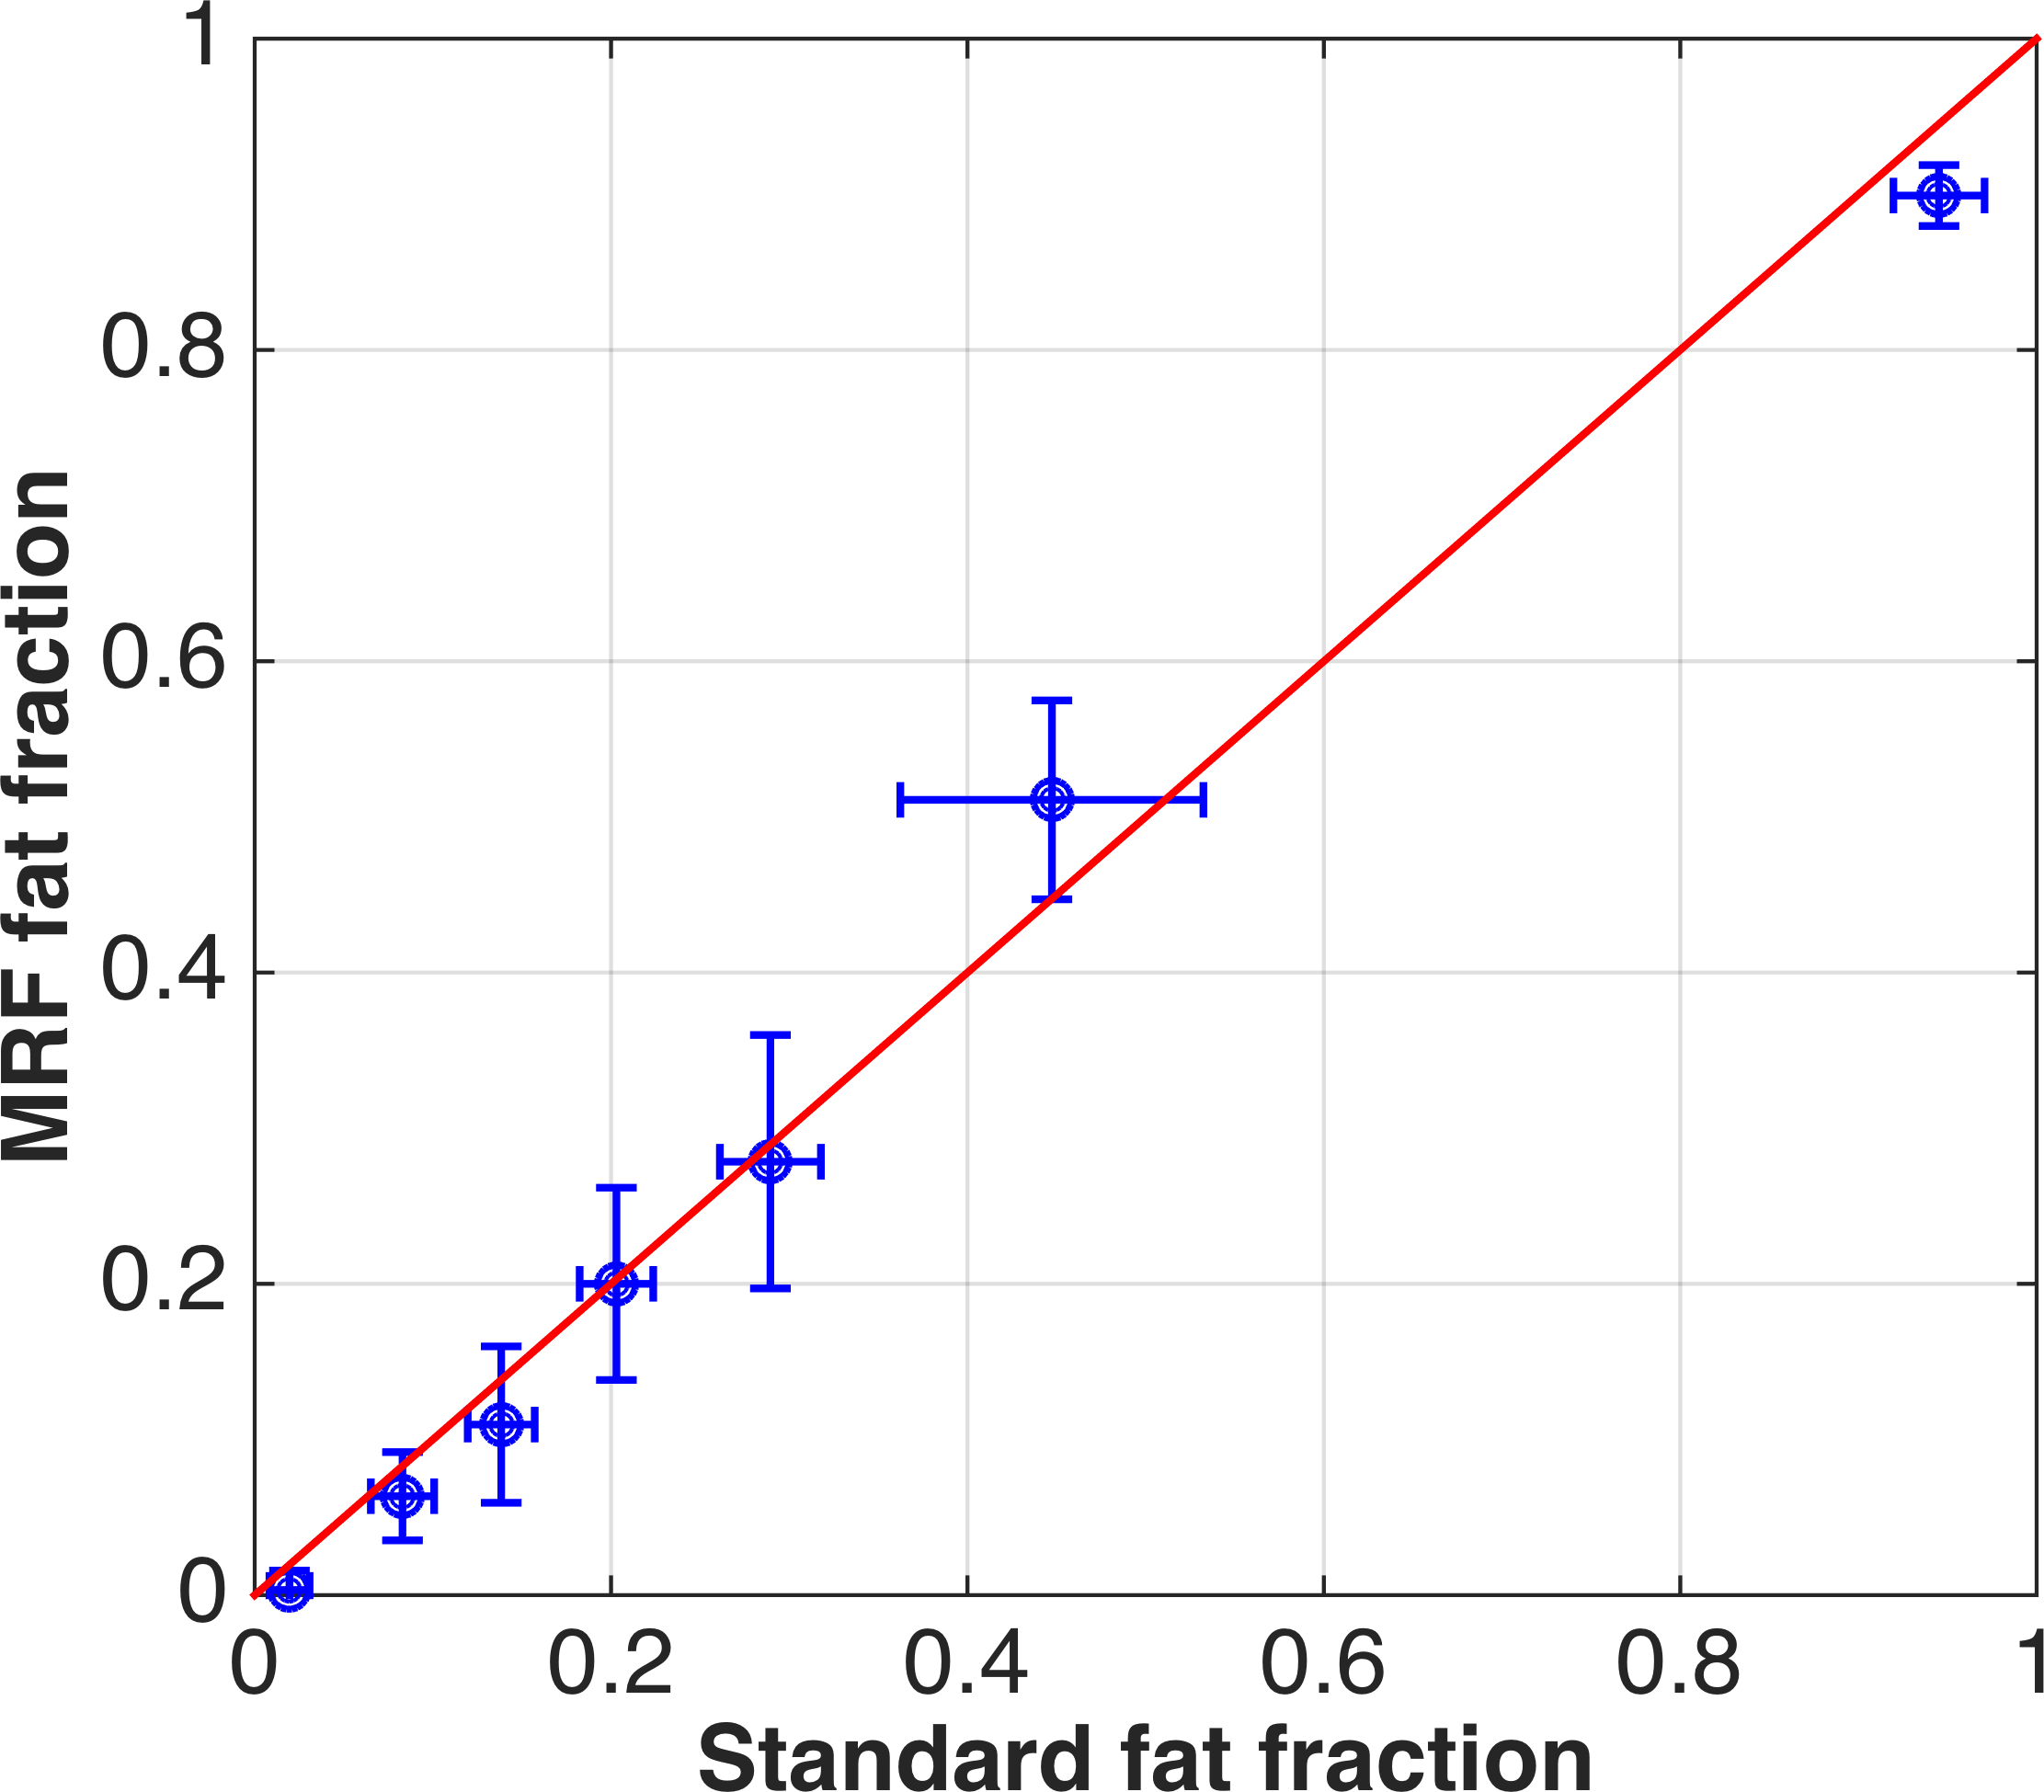
The
means of the phantom fat signal fraction using the mDIXON (labeled “Standard”)
and MRF techniques. The error-bars show the standard deviation in each
technique. The solid line indicates a theoretically perfect agreement between
the techniques and is not a regression line.
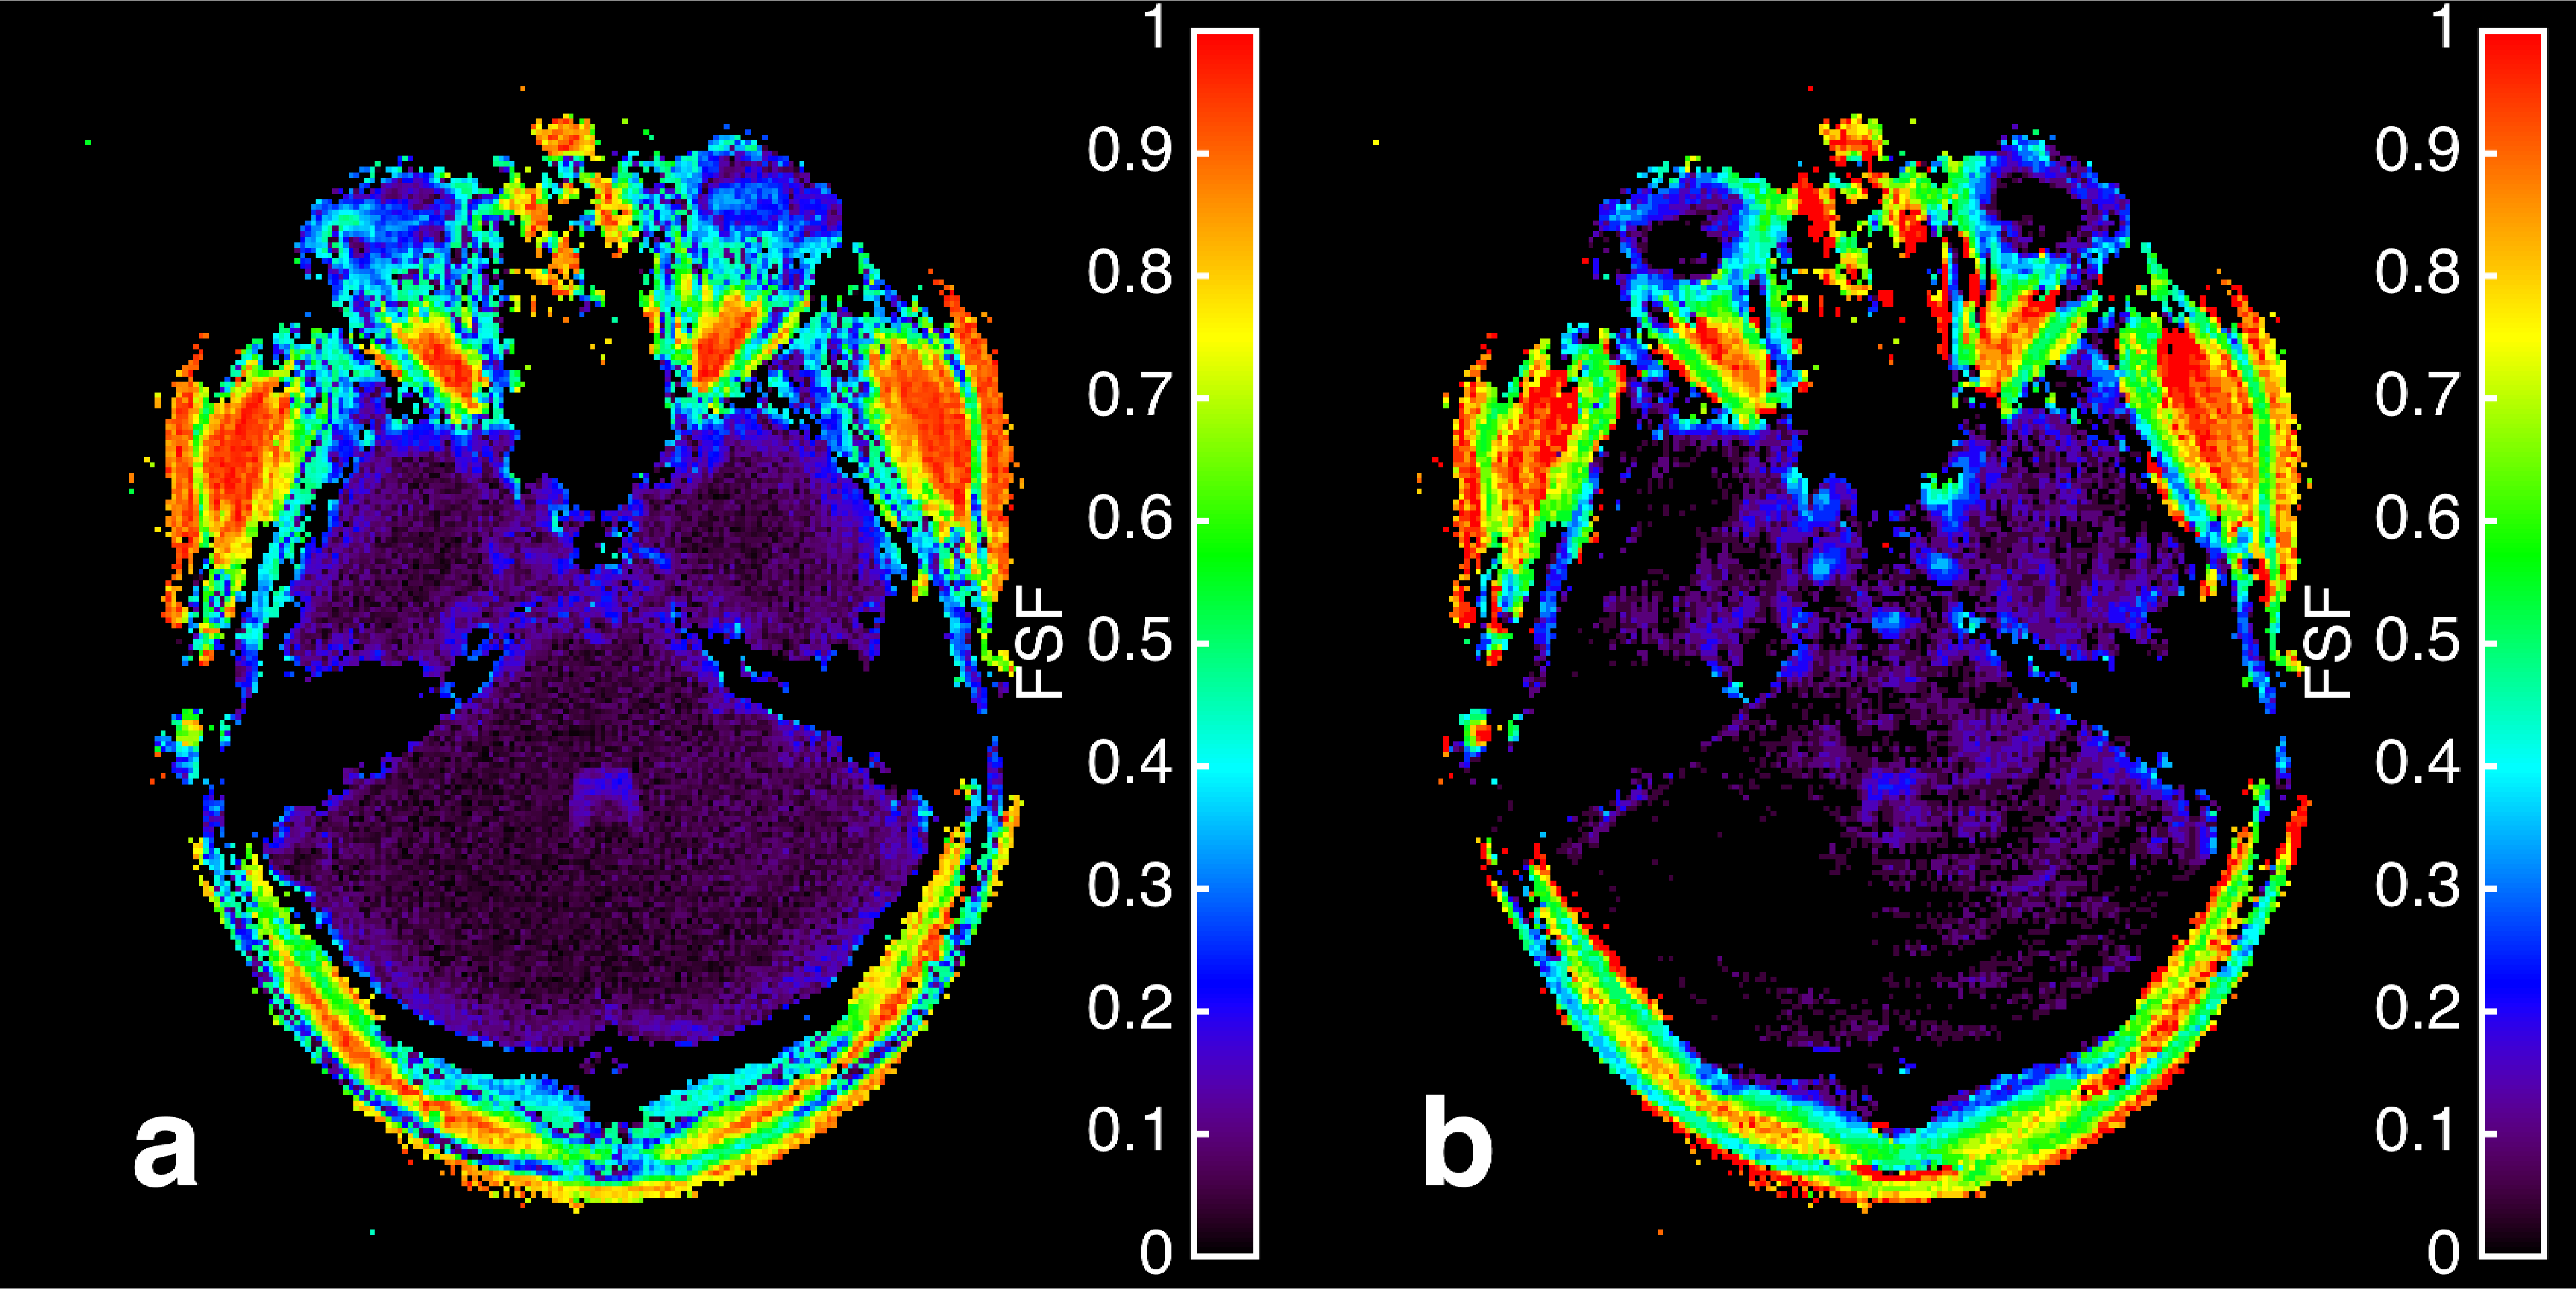
The fat signal fraction maps of the in vivo brain near the temporal bone from
conventional fat-water separation (a) and MRF (b) techniques. General agreement
exists in the high fat-fraction regions near the optic nerves and lateral
sub-cutaneous regions as well as in the posterior region of the occipital bone.
Blurring is also prevalent due to the fat off-resonance similar to Figure 1.