0126
Anatomical and functional deficits of the placenta identified by MRI in a rat model of preeclampsia1Center for Advanced Molecular Imaging, Northwestern University, Evanston, IL, United States, 2Molecular Biosciences, Northwestern University, Evanston, IL, United States, 3Pathology, Northwestern University Feinberg School of Medicine, Chicago, IL, United States, 4Chemistry, Molecular Biosciences, and Neurobiology, Northwestern University, Evanston, IL, United States
Synopsis
Though a large percentage of poor pregnancy outcomes such as stillbirth and preterm birth are related to placental dysfunction, the gold-standard of diagnosing placental pathology remains examination of the placenta by a pathologist after delivery. We demonstrate that anatomical and functional MRI can detect features of placental pathology correlating with ex vivo measures in a rat model of pre-eclampsia.
Background
A large percentage of poor pregnancy outcomes such as fetal growth restriction, stillbirth, and preterm birth are related to placental dysfunction. Over two thirds of stillbirths are associated with placental pathology. Any pathologic process that impairs placental perfusion may result in fetal hypoxia and/or diminished nutrient delivery, and mediate adverse pregnancy outcomes. However, the gold-standard of diagnosing placental pathology remains examination of the placenta by a pathologist after delivery.Purpose
To demonstrate feasibility of using MRI to detect morphological and functional differences in vivo between the placentas of normal pregnant rats and those treated with suramin, an angiogenesis inhibitor known to cause placental dysfunction mimicking pre-eclampsia.1Methods
Timed pregnant rats received an IP injection of PBS or 100mg/kg of suramin on gestational days (GD) 10 and 11. Rats were anesthetized with isoflurane (3% induction, 2% maintenance) and a tail vein catheter was installed. Rats were imaged on a 9.4T Bruker Biospec at GD17, 18, and 19. Anatomical images were acquired using two interleaved stacks of a TurboRARE sequence (TR/TE=1500/21 ms, resolution 0.2x0.2x1.5 mm3, 11-13 slices) in coronal and sagittal orientations. Dynamic contrast enhanced (DCE) images were acquired at 3 sagittal slices (FLASH, TR/TE/α=25ms/1.5ms/20°, resolution 0.3x0.3x1.5 mm3, 3 slices, 64 evolutions), followed by T1-weighted anatomical images in the same geometry (T1-RARE, TR/TE=1500/5.6 ms). After MRI, rats were euthanized and placentas measured, weighed, and fixed in 4% paraformaldehyde. Three placentas from each animal were processed for histology. MR images were consulted and labeled during dissection to match ex vivo samples with in vivo images. Amira software was used to segment and calculate volumes for all placentas in each animal. DCE data were analyzed using fuzzy C-means clustering implemented in Matlab and fit to a 2 compartment model.Results
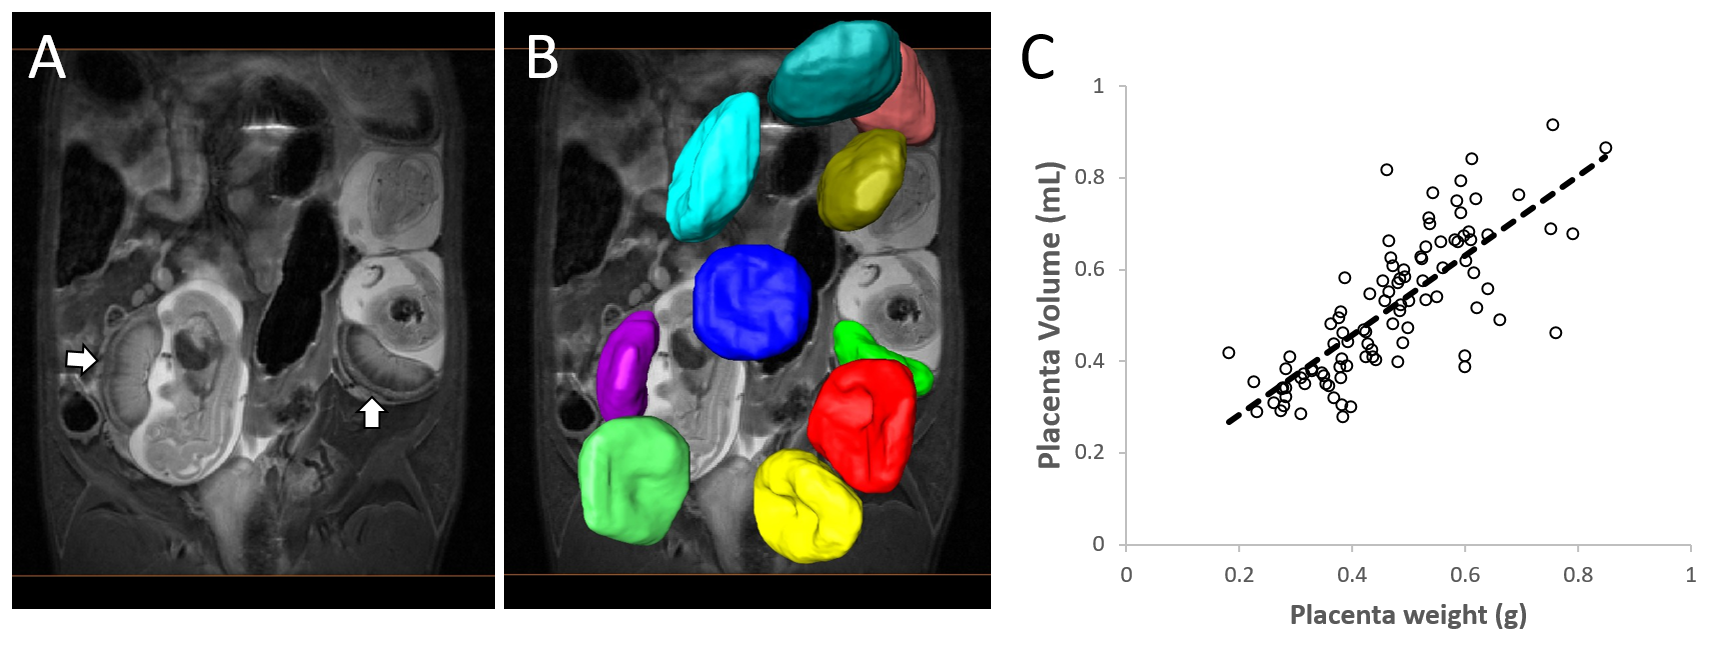
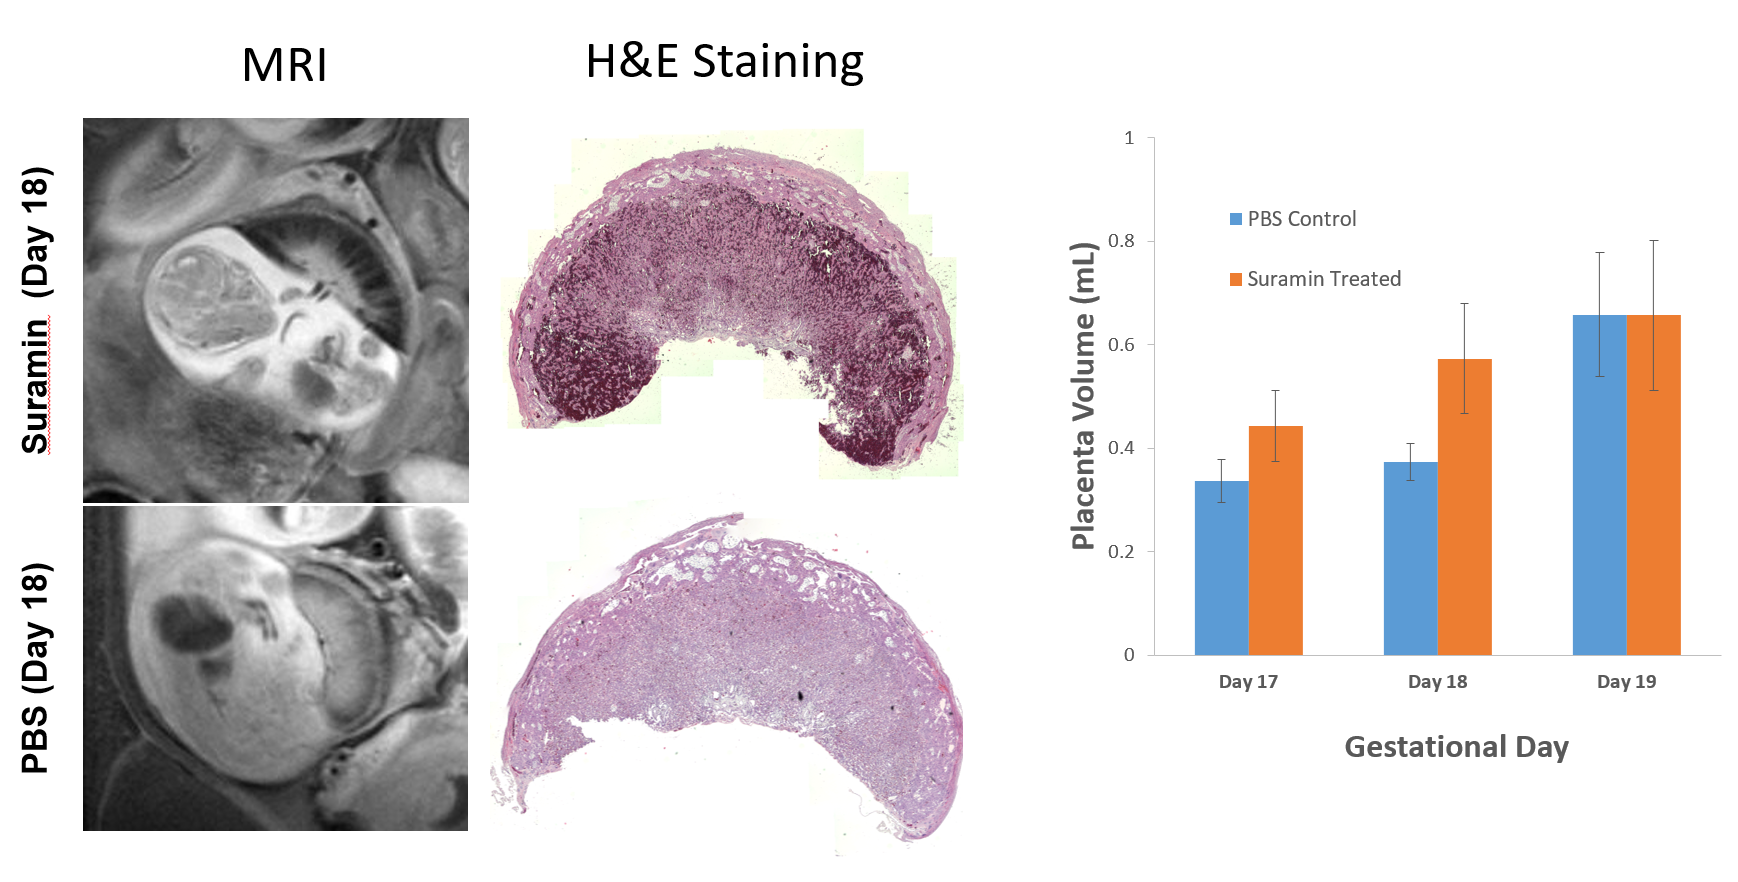
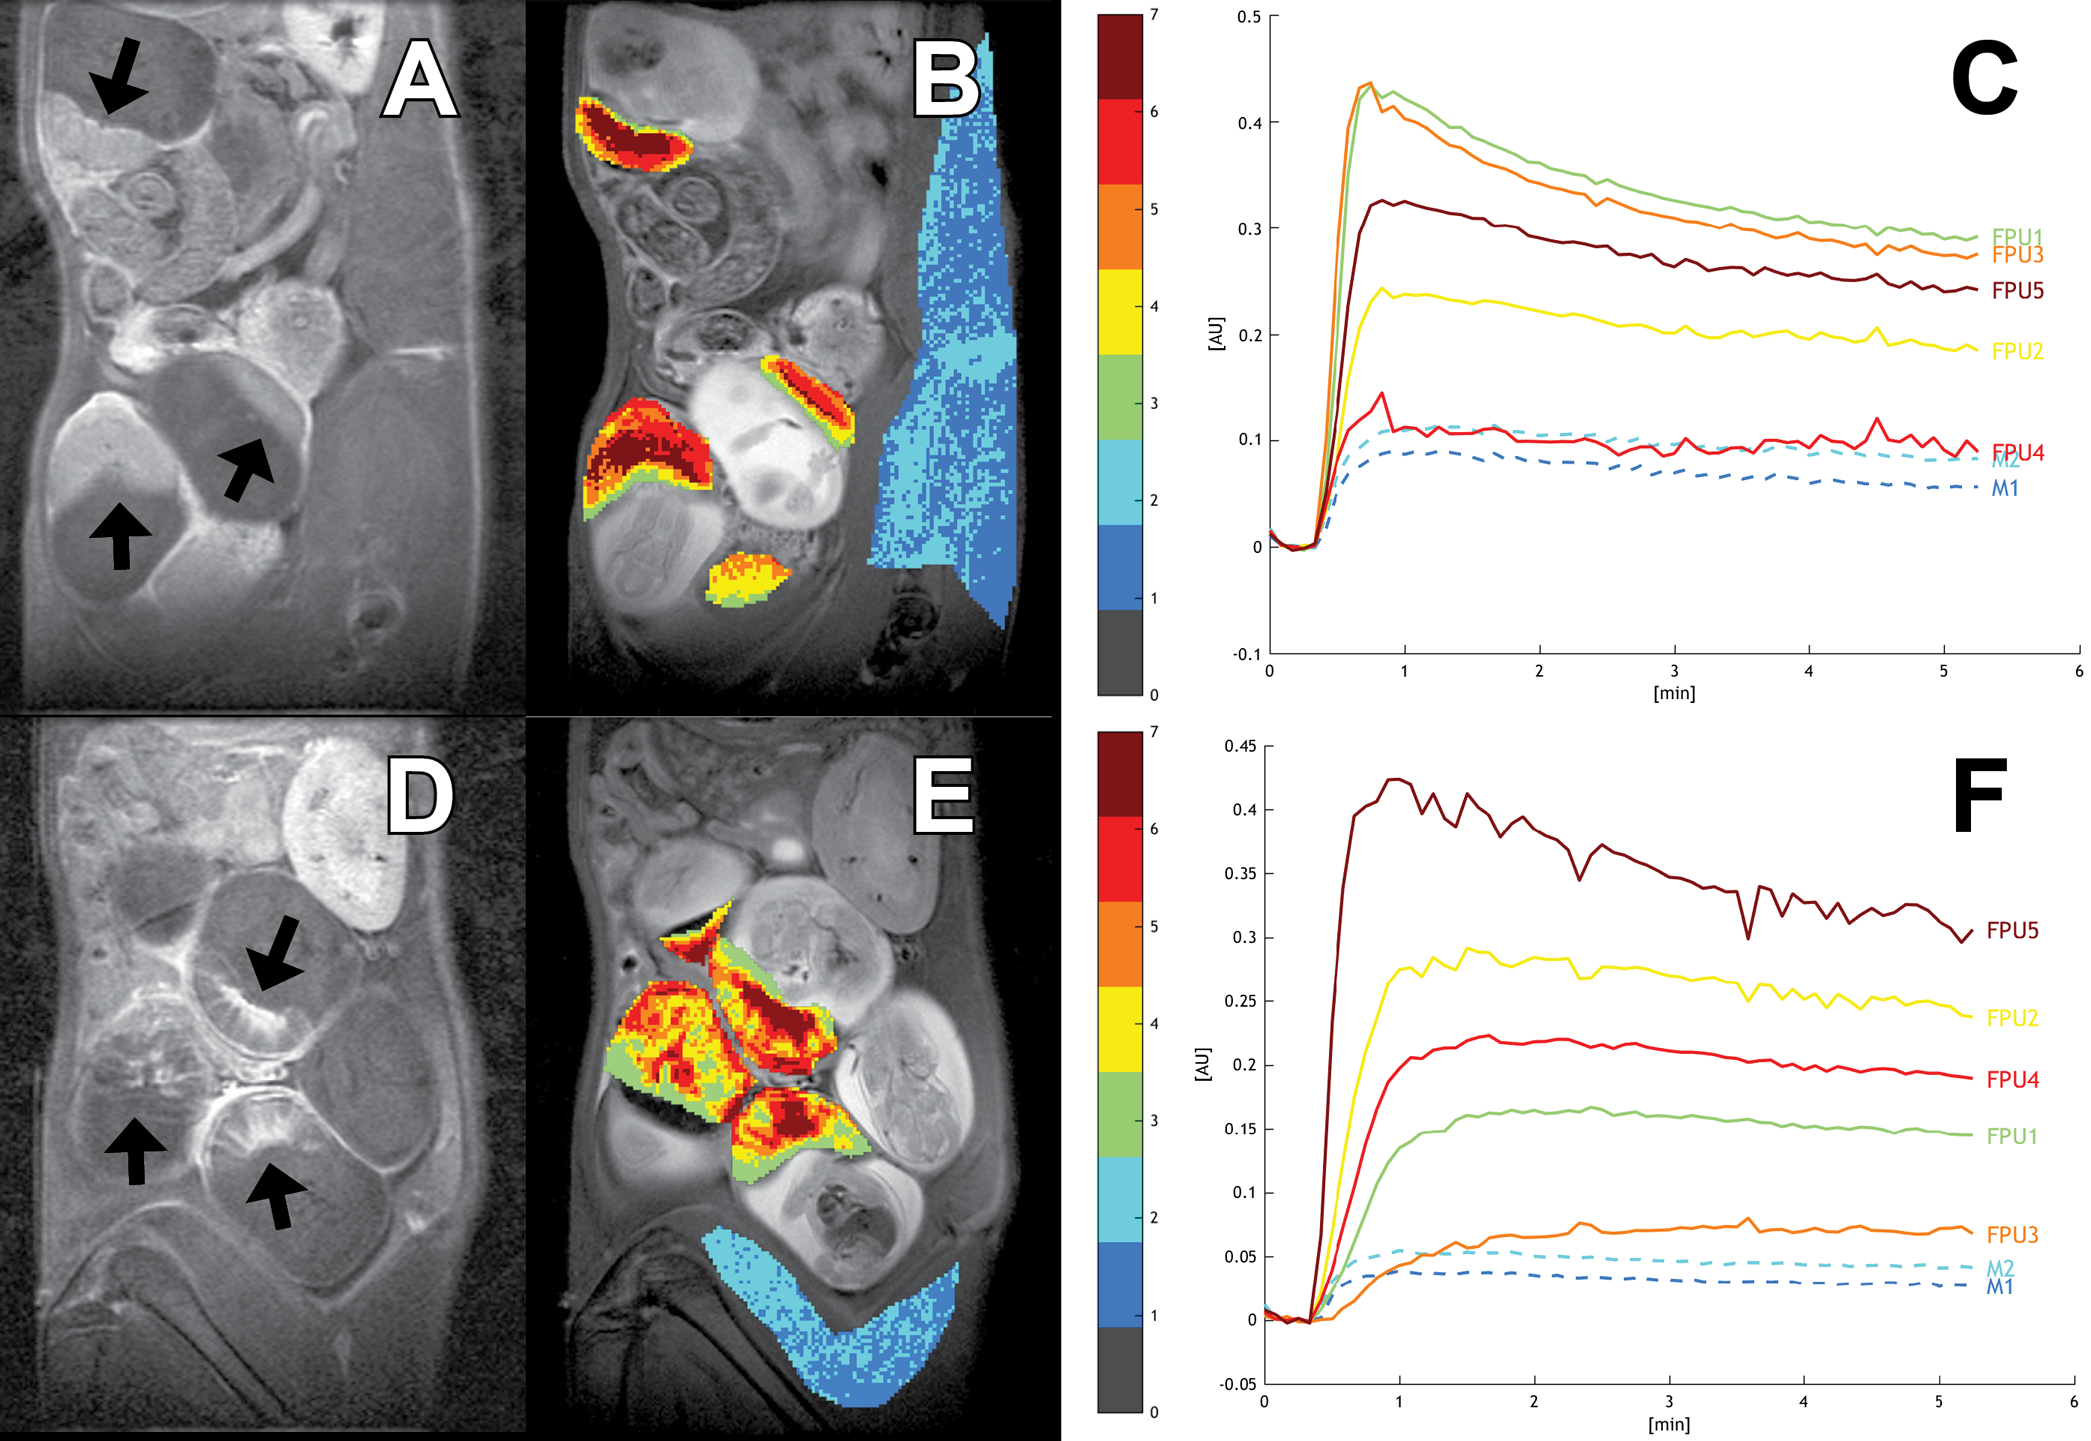
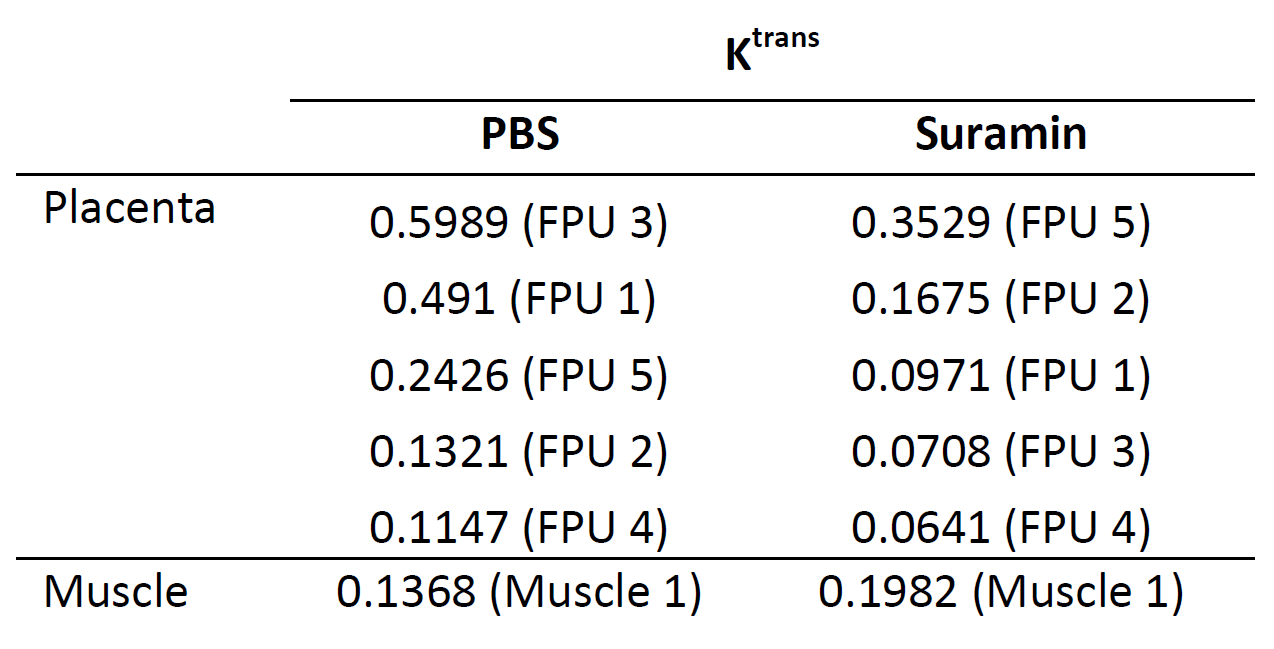
MRI-based volumetry on 98 placentas correlated well with placental weights (R2=0.60; Figure 1). PBS-treated control placentas included 13 at GD17, 12 at GD18, and 10 at GD19. Suramin-treated placentas included 20 at GD17, 25 at GD18, and 18 at GD19. Suramin-treated placentas exhibited heterogeneous regions of T2 shortening consistent with blood pooling, a finding confirmed by histology (Figure 2). No such regions were observed on control placentas. Suramin-treated placentas were significantly larger than control placentas at GD17 (0.44±0.07 mL vs 0.34±0.04 mL) and GD18 (0.57±0.11 mL vs 0.37±0.04 mL). No difference in size was observed at GD19 (0.66±0.15 mL vs 0.66±0.12 mL). Preliminary DCE-MRI results show slow-filling clusters of voxels in the suramin-treated group, also consistent with blood pooling (Figure 3, Table 1).Discussion
Suramin disrupts placental formation by inhibiting angiogenesis, and has been used as a preclinical model of pre-eclampsia. The goal of this study was to validate in vivo imaging methods for detecting suramin-induced placental abnormalities that have heretofore only been studied ex vivo using histology and placental weights. Lesions appeared as hypointense regions on T2-weighted anatomic images. Histologic examination confirmed that these regions correspond to expansion of the labyrinthine vascular channels and loss of the trophoblastic walls. Volume measurements correlated well with ex vivo placenta weights, suggesting that MRI volumetry is an appropriate metric for longitudinal studies. The suramin-treated placentas were significantly larger (weight and volume) than the PBS-treated placentas at the earlier timepoints (GD17 and GD18). The increase in volume between days 18 and 19 for the PBS treated animals may reflect an increase in placental perfusion that occurs in late pregnancy, a hypothesis which we are investigating using DCE-MRI. As low SNR is an inherent challenge for DCE-MRI, we use fuzzy C-means analysis (FCM) to cluster voxels into groups with similar kinetic profiles to improve pharmacokinetic modeling. This technique has been previously established in tumor imaging to differentiate regions with different vascular properties.2 Post-contrast images show discrete regions of delayed washout in the suramin group that are absent in the PBS group (Figure 3). The spatial structure of the FCM clusters correlates with the post-contrast T1-weighted imaging. Fitting the DCE data to a two-parameter model shows a global reduction in Ktrans in the suramin group relative to the PBS group (Table 1).3 This indicates impaired perfusion in the suramin-treated placentas. Future analysis will examine changes in Ktrans between the suramin and PBS treated groups over time.Conclusion
In vivo MR-based measurements of anatomical and functional placental abnormalities in a rodent model of preeclampsia correlate well with ex vivo measurements. This framework can be used to evaluate placental development longitudinally in vivo using a combination of functional and anatomical MRI, thereby gaining a deeper understanding of the biological processes underpinning pre-eclampsia.Acknowledgements
MRI was performed at the Center for Advanced Molecular Imaging generously supported by NCI CCSG P30 CA060553 awarded to the Robert H Lurie Comprehensive Cancer Center.References
1. Nash P, Wentzel P, Lindeberg S, Naessén T, Jansson L, Olovsson M, Eriksson UJ. “Placental dysfunction in Suramin-treated rats--a new model for pre-eclampsia.” Placenta. 2005 May;26(5):410-8.
2. Chen W, Giger ML, Bick U, Newstead GM. “Automatic identification and classification of characteristic kinetic curves of breast lesions on DCE-MRI.” Med Phys. 2006 Aug;33(8):2878-87.
3. Haney CR, Fan X, Markiewicz E, Mustafi D, Karczmar GS, Stadler WM. "Monitoring anti-angiogenic therapy in colorectal cancer murine model
using dynamic contrast-enhanced MRI: comparing pixel-by-pixel with
region of interest analysis." Technol Cancer Res Treat. 2013 Feb;12(1):71-8.
Figures