0125
Hepatic MRI-PDFF is positively correlated with R2* across a range of fat spectral models1Liver Imaging Group, Department of Radiology, University of California, San Diego, San Diego, CA, United States, 2Computational and Applied Statistics Laboratory, University of California, San Diego, San Diego, CA, United States, 3Departments of Radiology, Medical Physics, Biomedical Engineering, Medicine, and Emergency Medicine, University of Wisconsin, Madison, Madison, WI, United States, 4NAFLD Research Center, Division of Gastroenterology, Department of Medicine, University of California, San Diego, San Diego, CA, United States
Synopsis
Confounder-corrected estimation of proton-density fat fraction (PDFF) concurrently estimates R2* (1/T2*), a parameter modeled to account for R2* signal decay. Although they are derived from the same mathematical model, PDFF and R2* are generally considered independent parameters. Emerging evidence, however, suggests that PDFF and R2* are positively correlated. This study confirms that PDFF and R2* are positively correlated, and this association is not a spurious result of the applied fat multipeak spectral model.
Introduction
MRI-based proton density fat fraction (PDFF) is the leading imaging biomarker for noninvasive quantification of hepatic fat content 1,2. Accurate PDFF estimation necessitates accounting for several confounders including R2* signal decay and the spectral complexity of fat 3–5. Even though PDFF and R2* are generally considered independent parameters, emerging evidence suggests that PDFF and R2* are positively correlated 6–8. The purpose of this study was to verify the correlation of PDFF and R2*, and to examine whether the correlation is a spurious artifact of the fat multi-peak spectral model.Theory
The most widely used fat multi-peak spectral model, based on the chemical composition of human triglyceride (TG) described by Hamilton et al. 9, assumes 17.45 for the TG chain length (CL), 1.92 for the number of double bonds (NDB), and 0.32 for the number of methylene-interrupted double bonds (NMIDB). Since the fat multi-peak spectral model of fat affects the estimated PDFF and R2* values, it is conceivable that errors or variability in the model may cause an artifactual association between PDFF and R2*.Methods
In this HIPAA-compliant, IRB-approved study, we performed a secondary analysis of a clinical trial of adults with biopsy-confirmed NASH 10. Enrolled patients underwent confounder-corrected, magnitude-based, chemical-shift-encoded 3T MRI for hepatic PDFF quantification. Regions-of-interest (ROIs) were placed in each Couinaud segment on the MRI source images. PDFF and R2* values were calculated using the standard Hamilton model for fat multi-peak spectral modeling 9. Additionally, 60 variant PDFF and R2* values were calculated from source images using alternate spectral models that systematically varied the TG CL, NDB, and NMIDB across their biologically plausible ranges (CL from 17.35 – 17.55 in increments of 0.1, NDB from 1.9 – 2.7 in increments of 0.2, NMIDB from 0.3 – 0.7 in increments of 0.2) 9,11.
For each of the 61 models (standard and 60 alternates), the PDFF and R2* values for each Couinaud segment were averaged to provide whole-liver composite values. The composite values then were compared using linear regression for each model separately. Finally composite PDFF and R2* values estimated by the 61 models were averaged and plotted.
Results
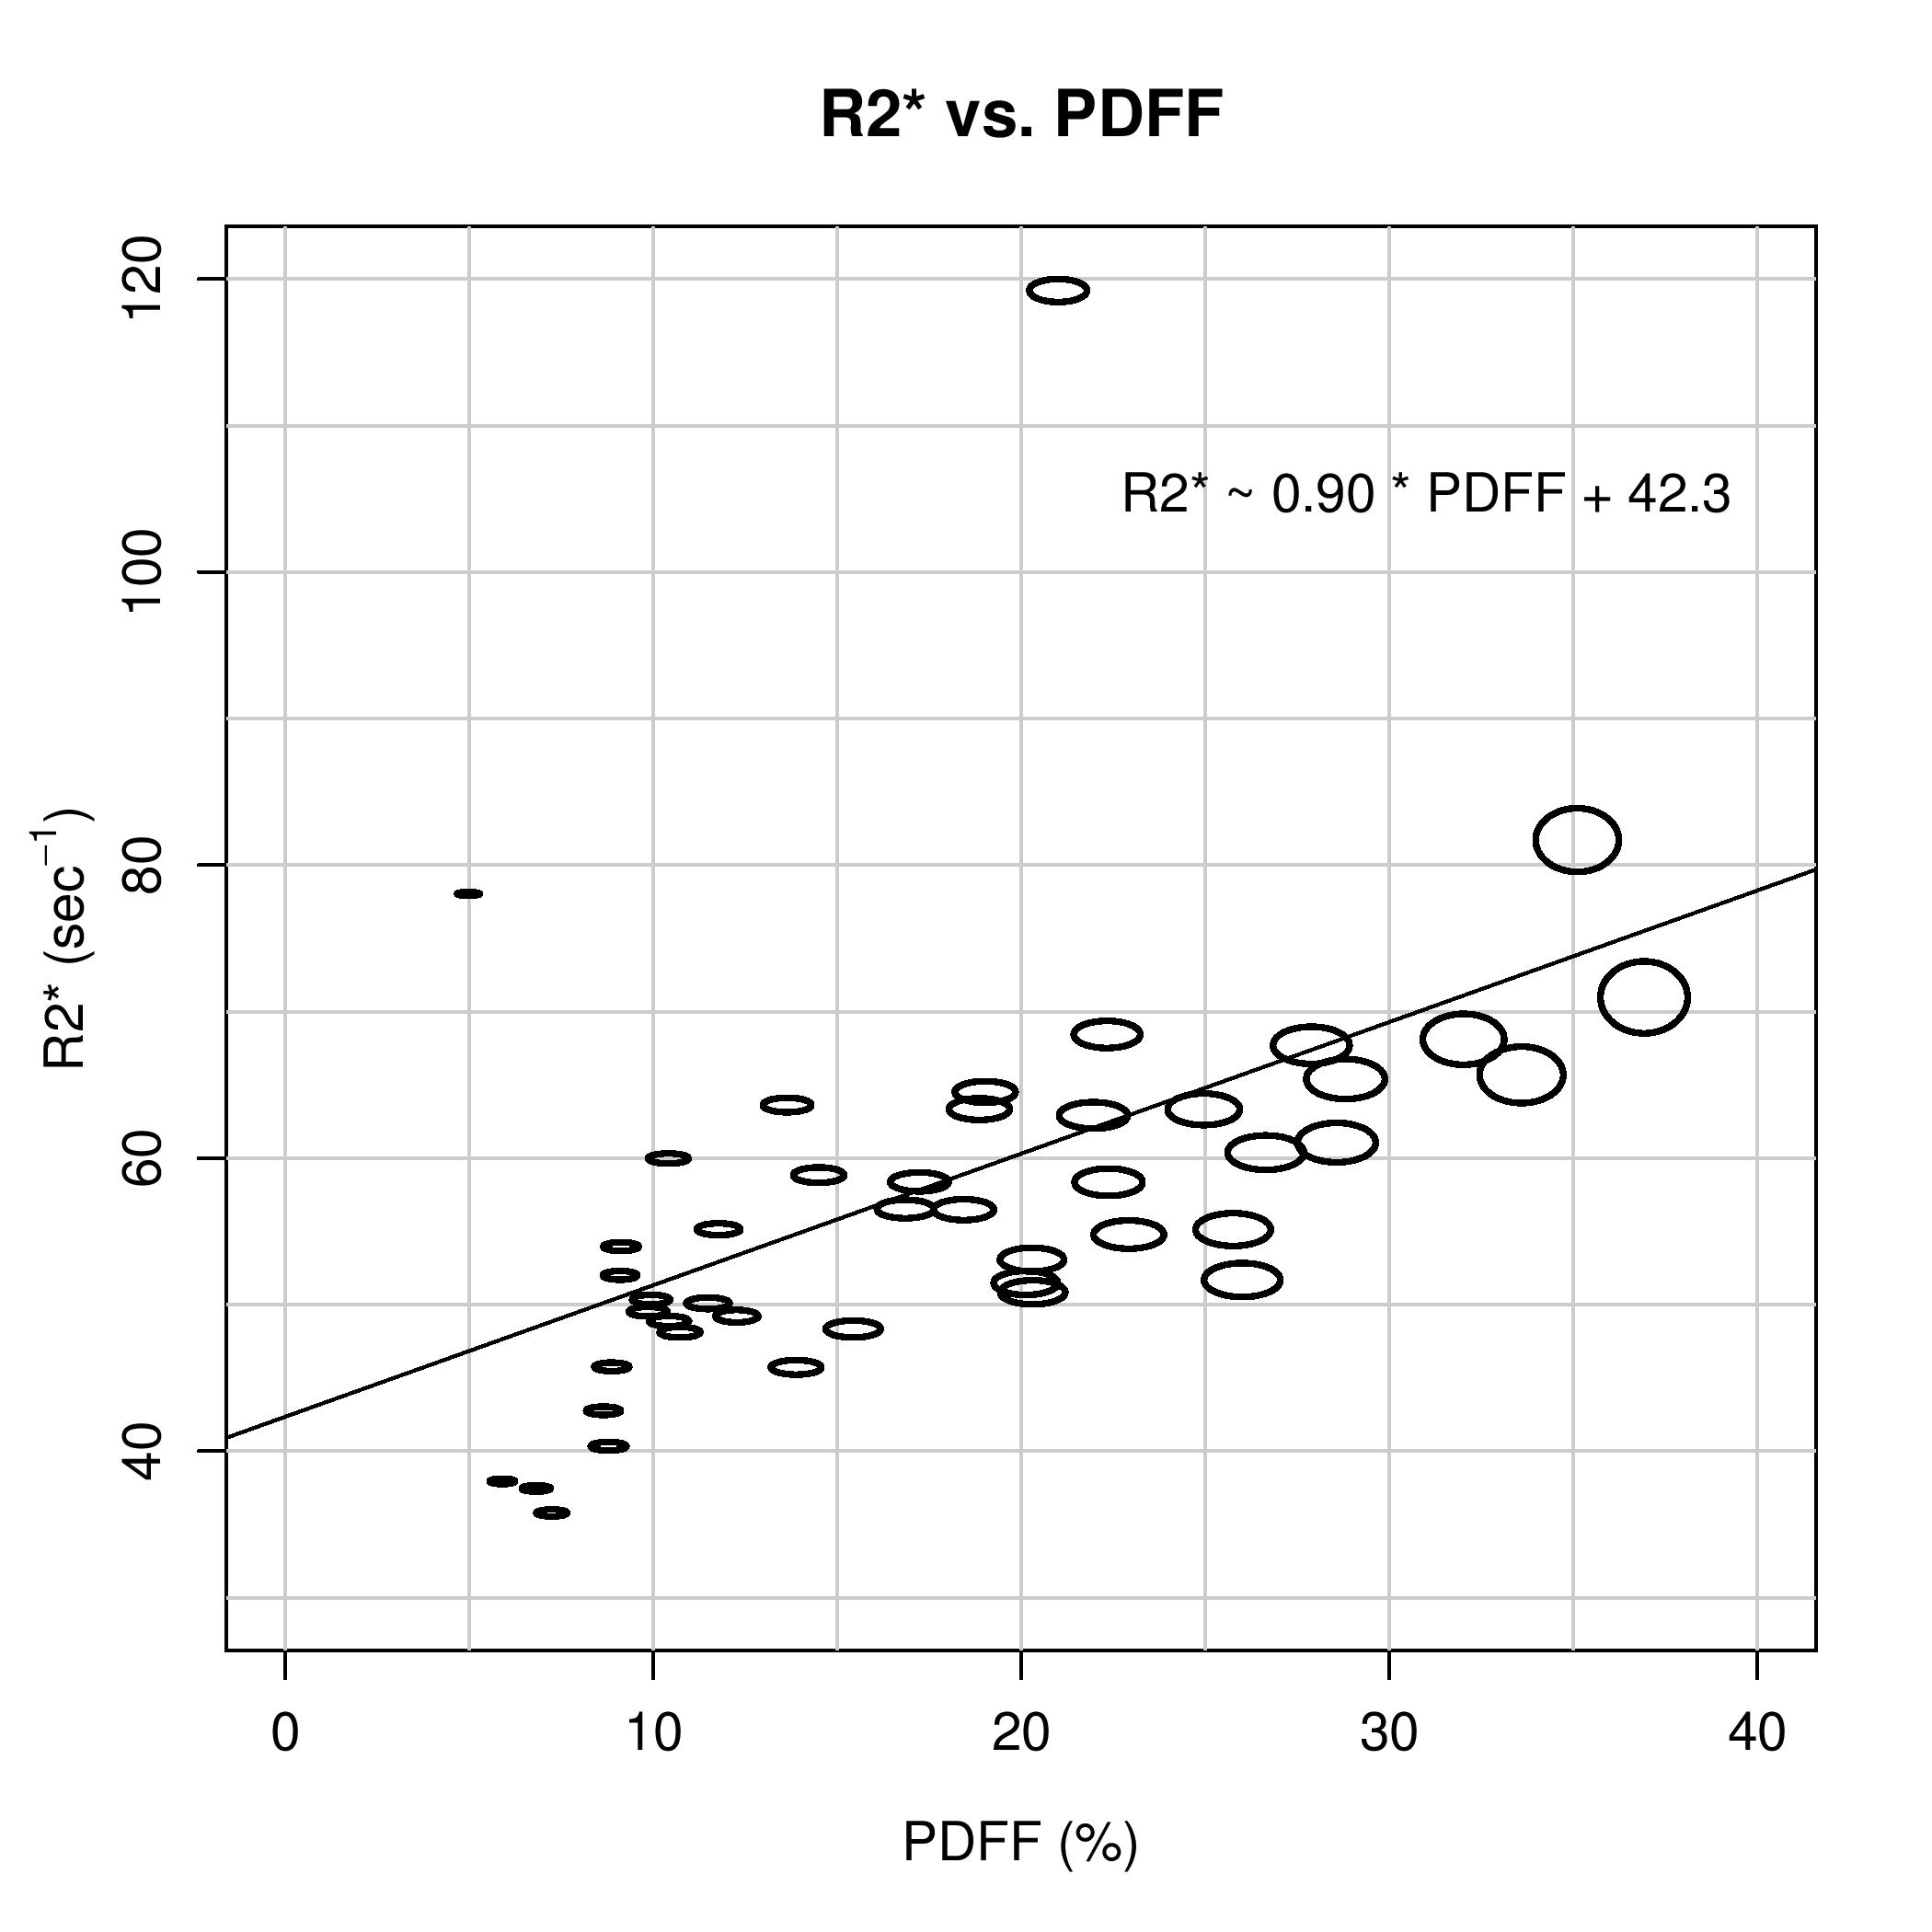
45 patients were included in this analysis (27 female, 18 male). Using the standard model, the mean estimated PDFF and R2* were 17.4 ± 8.4% (range: 4.8% – 36.3%) and 58.0 ± 14.0 s-1 (range: 36.0 s-1 – 120.0 s-1). PDFF and R2* using the standard model and each of the 60 variant models were positively correlated (correlation coefficients: 0.42 to 0.47, p < 0.005 for all). Figure 1 plots the composite PDFF and R2* values averaged across the 61 models. The ovals are scaled according to the range of R2* and PDFF values for each data point. Although the PDFF and R2* values are affected by the selection of spectral model, the variability is small and does not explain the observed correlation.Discussion
This study verifies a positive correlation between PDFF and R2*. This relationship is not explained by changes in the fat spectral model, as the spectral model-dependent variations in PDFF and R2* are small. Prior studies have suggested that PDFF is insensitive to the spectral model of fat, and the number of echoes used for mathematical fitting also does not explain a positive correlation between PDFF and R2* 4,12. Taken together, these observations suggests that the positive association between PDFF and R2* is not attributable to the reconstruction method. Further research is needed to explain the underlying mechanism.Conclusion
Hepatic PDFF and R2* are positively correlated, and this relationship is not a spurious artifact of the fat multi-peak spectral model used for magnitude-data reconstruction.Acknowledgements
No acknowledgement found.References
1. Reeder SB, Cruite I, Hamilton G, Sirlin CB. Quantitative assessment of liver fat with magnetic resonance imaging and spectroscopy. J Magn Reson Imaging 2011;34(4):729–49.
2. Reeder SB, Sirlin CB. Quantification of liver fat with magnetic resonance imaging. Magn Reson Imaging Clin N Am 2010;18(3):337–57, ix.
3. Bydder M, Yokoo T, Hamilton G, et al. Relaxation effects in the quantification of fat using gradient echo imaging. Magn Reson Imaging 2008;26(3):347–59.
4. Wang X, Hernando D, Reeder SB. Sensitivity of chemical shift-encoded fat quantification to calibration of fat MR spectrum. Magn Reson Med 2016;75(2):845–51.
5. Liu C-Y, McKenzie CA, Yu H, Brittain JH, Reeder SB. Fat quantification with IDEAL gradient echo imaging: correction of bias from T(1) and noise. Magn Reson Med 2007;58(2):354–64.
6. Bashir MR, Zhong X, Nickel MD, et al. Quantification of hepatic steatosis with a multistep adaptive fitting MRI approach: prospective validation against MR spectroscopy. AJR Am J Roentgenol 2015;204(2):297–306.
7. Kühn J-P, Hernando D, Muñoz del Rio A, et al. Effect of multipeak spectral modeling of fat for liver iron and fat quantification: correlation of biopsy with MR imaging results. Radiology 2012;265(1):133–42.
8. Mamidipalli A, Haufe W, Hooker C, et al. Cross-sectional relationship between hepatic proton density fat fraction (PDFF) and R2* in children with non-alcoholic fatty liver disease (NAFLD). In: SCBT-MR. 2015.
9. Hamilton G, Yokoo T, Bydder M, et al. In vivo characterization of the liver fat 1H MR spectrum. NMR Biomed 2011;24(7):784–90.
10. Loomba R, Sirlin CB, Ang B, et al. Ezetimibe for the treatment of nonalcoholic steatohepatitis: assessment by novel magnetic resonance imaging and magnetic resonance elastography in a randomized trial (MOZART trial). Hepatology 2015;61(4):1239–50.
11. Hamilton G, Schlein AN, Middleton MS, et al. In vivo triglyceride composition of abdominal adipose tissue measured by (1) H MRS at 3T. J Magn Reson Imaging 2016;
12. Levin YS, Yokoo T, Wolfson T, et al. Effect of echo-sampling strategy on the accuracy of out-of-phase and in-phase multiecho gradient-echo MRI hepatic fat fraction estimation. J Magn Reson Imaging 2014;39(3):567–75.
Figures