0124
In Vivo Biochemical and Histological Validation of Proton Density Fat Fraction as a Quantitative Biomarker of Hepatic Steatosis1Radiology, University of Wisconsin, Madison, WI, United States, 2Medical Physics, University of Wisconsin, Madison, WI, 3Biomedical Engineering, University of Wisconsin, Madison, WI, United States, 4Medicine, University of Wisconsin, Madison, WI, United States, 5Emergency Medicine, University of Wisconsin, Madison, WI, United States, 6Diagnostic Imaging, St. Jude Children’s Research Hospital, 7Pediatrics, University of California, San Diego, 8Pathology, University of Wisconsin, 9San Diego Super Computer Center, University of California, San Diego, 10Mathematics, University of California, San Diego, 11Surgery, Virginia Commonwealth University, Richmond, VA, United States, 12Surgery, University of Wisconsin, Madison, WI, 13Surgery, University of California, San Diego, San Diego, CA, United States, 14Radiology, University of California, San Diego
Synopsis
The purpose of this study was to validate complex- and magnitude-based quantitative chemical-shift encoded MRI (CSE-MRI) to quantify PDFF as an accurate biomarker of hepatic steatosis. A biopsy-MRI correlation study was performed in 95 obese subjects undergoing bariatric weight loss surgery. The results of biochemical triglyceride, conventional histological, digital histological, and MR spectroscopy analyses were used as reference standards. Strong correlations were found between MRI-PDFF measured using both complex- and magnitude-based CSE-MRI methods vs. each reference standard. This is the first cross-sectional in-vivo study validating PDFF as a biomarker of hepatic steatosis using biochemical triglyceride concentration as the reference.
Introduction
Intracellular accumulation of triglycerides within hepatocytes (hepatic steatosis) is the earliest histological feature of nonalcoholic fatty liver disease (NAFLD). Quantitative chemical-shift encoded MRI (CSE-MRI) methods are emerging as accurate biomarkers for detection and quantification of steatosis, through estimation of proton density fat-fraction (PDFF), a fundamental biomarker of tissue triglyceride concentration. The purpose of this study was to validate two CSE-MRI methods to quantify PDFF using the results of biochemical triglyceride (TG), conventional histological, digital histological, and MR spectroscopy (MRS) analyses, as reference standards.Materials and Methods
Subjects: Subjects scheduled to undergo weight loss surgery (WLS) were recruited from two centers. Exclusion criteria included contraindications to MRI and pre-existing liver disease other than NAFLD. Age, gender, and body mass index (BMI) were recorded. IRB-approved informed consent was obtained from all subjects.
Study Protocol: All subjects underwent a very low calorie liquid diet for 1-3 weeks prior to WLS. 1-2 days prior to WLS, MRI was performed at 3.0T (HDxt or MR750,GE Healthcare) using an 8- or 32-channel phased-array coil. Subjects too large to fit in the 60cm 3.0T systems were imaged using a widebore 1.5T system (MR450w,GE Healthcare). Each MRI exam included the following acquisitions:
1. Complex 3D-multi-echo spoiled gradient-echo CSE-MRI (“Complex-MRI”).
2. Magnitude 2D-multi-echo spoiled gradient-echo CSE-MRI (“Magnitude-MRI”).
3. Multi-echo single-voxel STEAM MRS (right lobe of the liver).
Acquisition parameters are similar to that reported previously [1-3]. Complex- and Magnitude-MRI were acquired with low flip angles to avoid T1-bias, and PDFF maps were reconstructed to account for spectral complexity of fat [4-5], R2* decay [4-6], eddy currents [7] and noise-related bias [8]. PDFF maps were analyzed by placing an ROI in each of the nine Couinaud segments of the liver, avoiding large vessels, bile ducts, and major artifacts. The average from the nine Couinaud segments was recorded.
MRS-PDFF was estimated off-line, combining array elements [9] and analyzing spectra with jMRUI in the AMARES algorithm. T2-corrected peak areas were estimated, and PDFF was corrected for fat under the water peak with prior knowledge of liver triglyceride composition [3].
Biopsy: During WLS, a wedge biopsy or multiple core biopsies containing ~2-3g of tissue was obtained from the anterior surface of the left lateral hepatic lobe. The sample was split: one half was placed on dry ice and stored at -80oC, and the second fixed in formalin. Frozen samples were shipped in batches for biochemical TG analysis (Anilytics, Gaithersburg, MD). Results were reported in mg TG/g liver tissue.
Two expert hepatopathologists in consensus performed histological analysis of the formalin-fixed samples. Steatosis was graded based on the percentage of cells containing intracellular vacuoles of fat [10]. High-resolution digitized histological slides were also segmented to determine the “area-fraction” of fat vacuoles (ImagePro Plus v7.0, Media Cybernetics, Rockville, MD) [11].
Statistical Analysis: Linear regression analysis was used to evaluate the accuracy of Complex- and Magnitude-MRI relative to the following reference standards: TG concentration, conventional histology-derived steatosis percentage, digital histological area-fraction, and MRS-PDFF. Pearson’s correlation (r), coefficient of determination (R2) and 95% prediction interval (similar to limits of agreement) were computed for each regression [12]. For MRS-PDFF, which measures the same quantity as MRI-PDFF, we additionally estimated slope and intercept of the regression line (to assess agreement), and average bias.
Results
95 patients (W=77,M=18; average age=48.4years, range=18.4-70.6; average BMI=41.1kg/m2, range=30.8-56.8kg/m2) were recruited and underwent MRI. 90 subjects were scanned at 3.0T (5 at 1.5T). One MRS dataset was excluded due to data transfer loss. Conventional histological analyses were made from the wedge biopsies (n=72). Digital analysis was completed in 80 biopsy specimens. One batch of frozen biopsy specimens sent for TG analysis (n=20) was invalid due to equipment failure, and three additional TG analyses were excluded due to data loss (n=58).
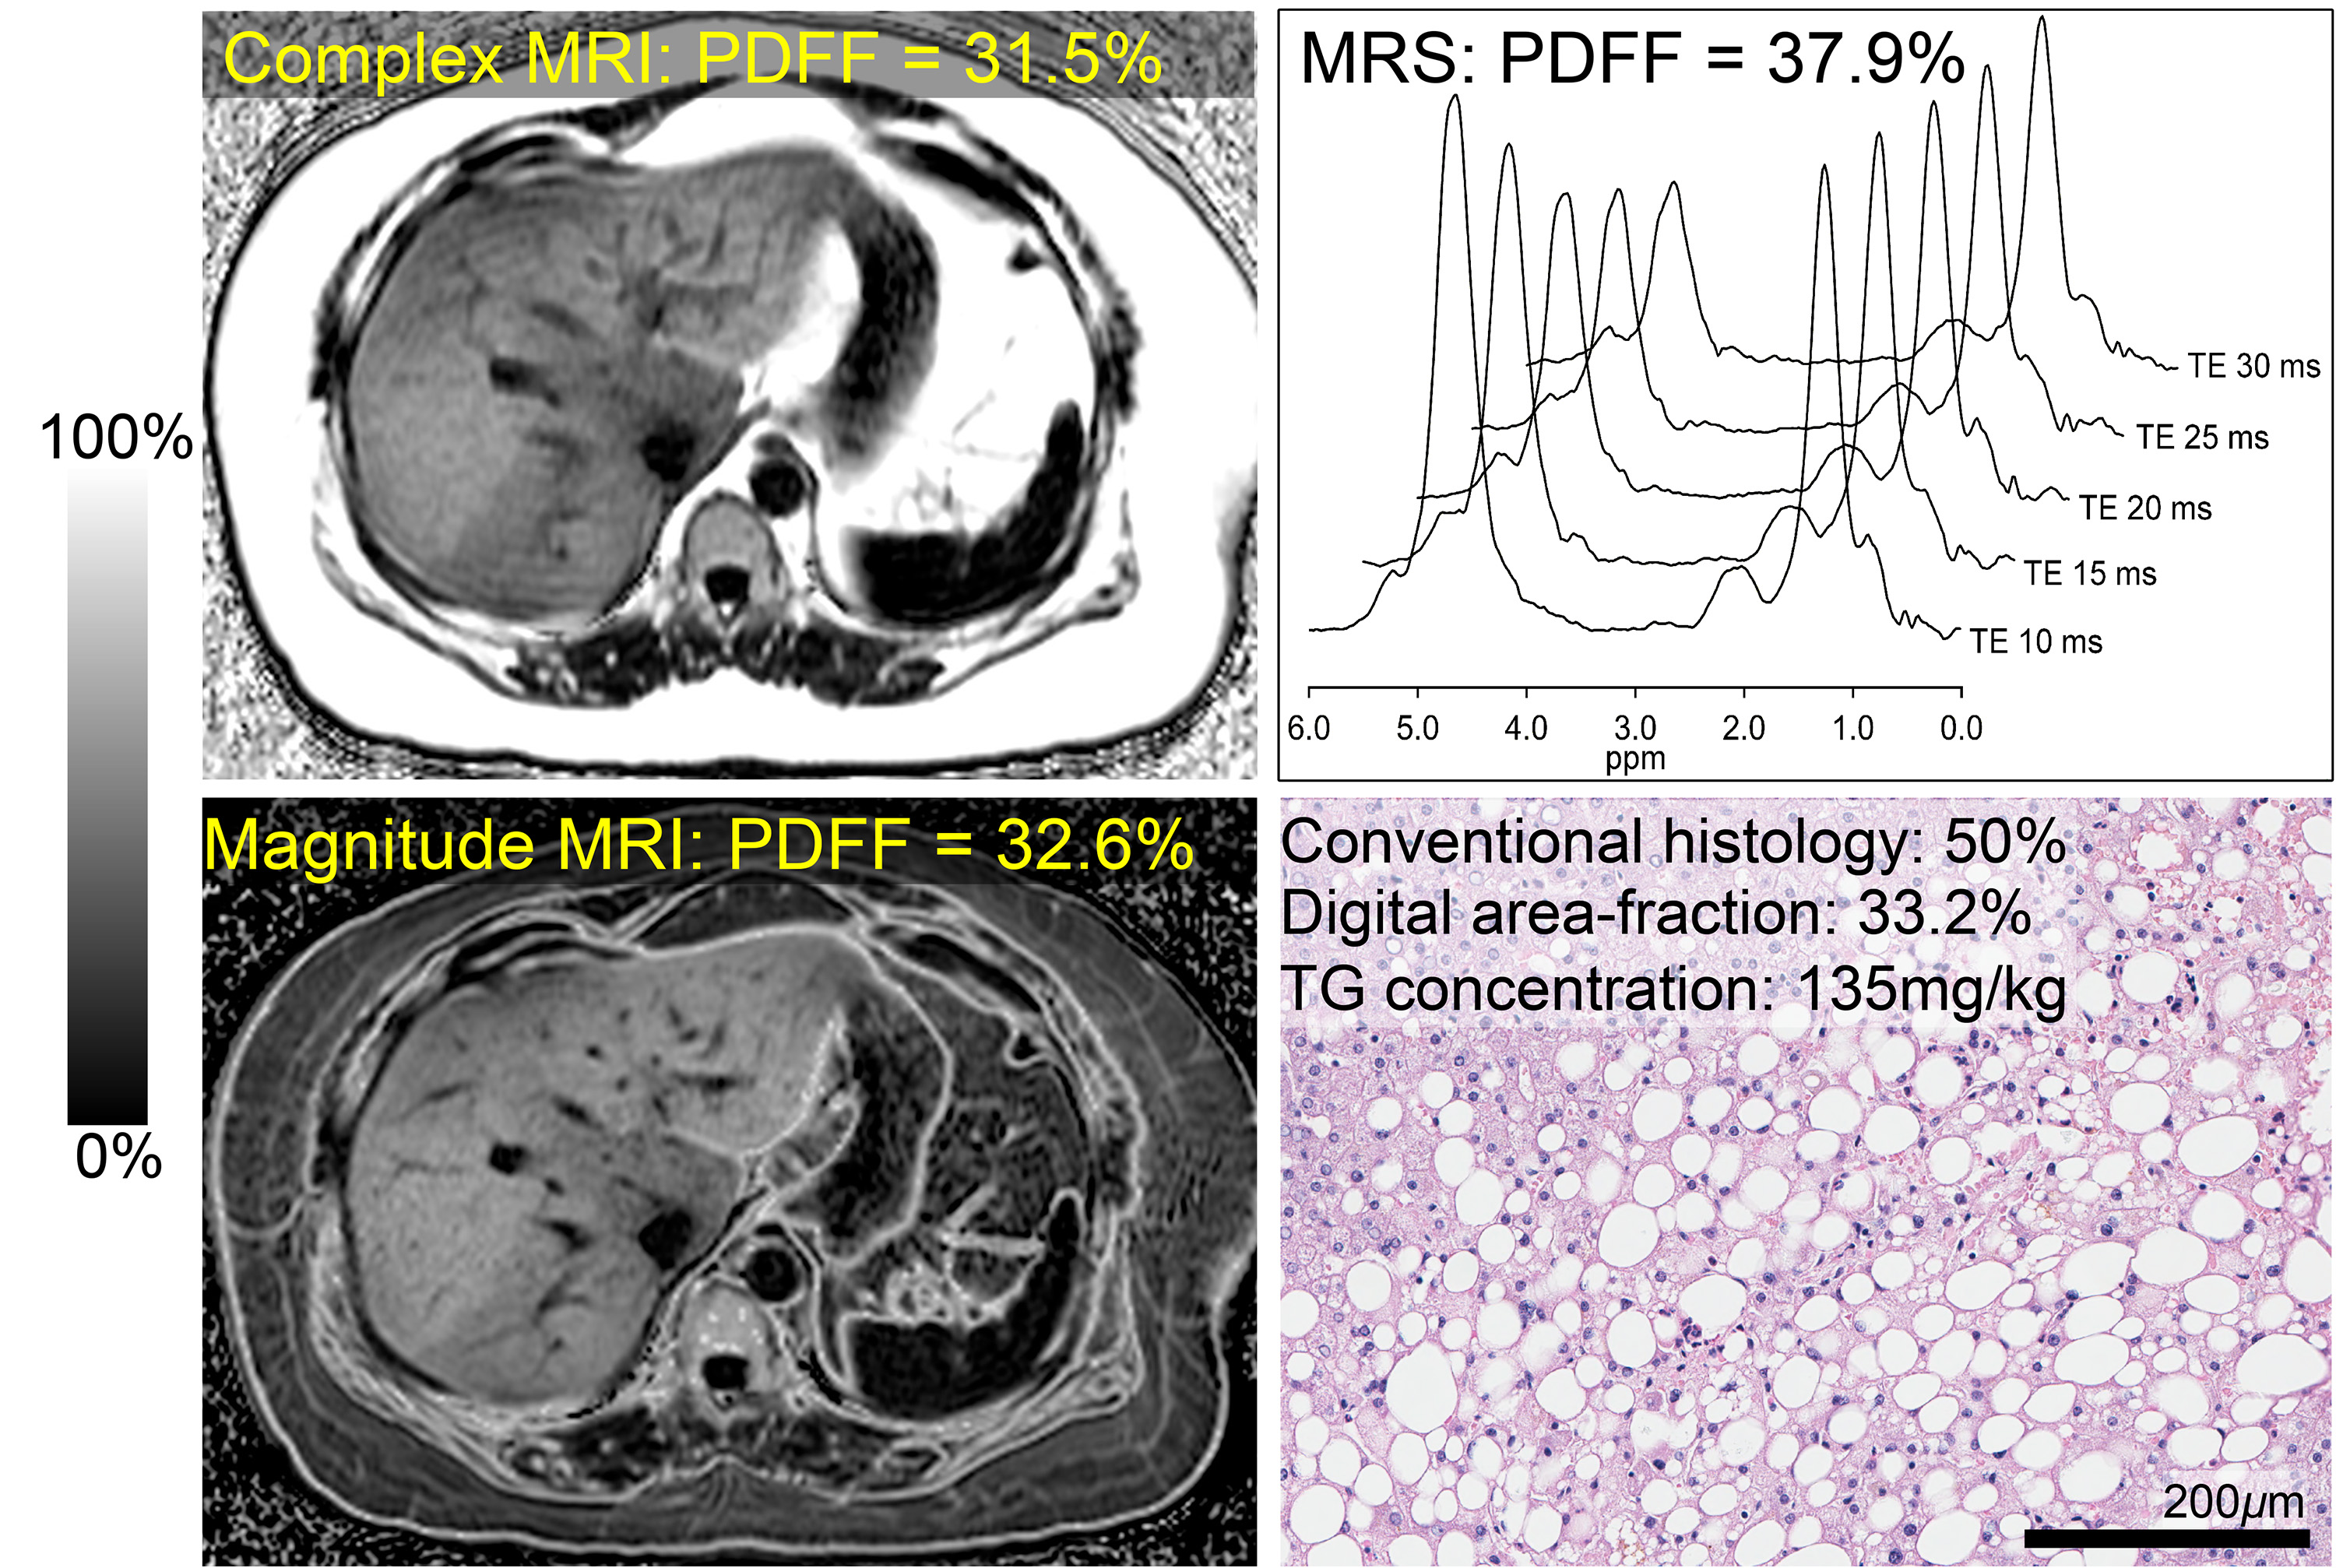
Figure 1 shows an example of Complex- and Magnitude-MRI-PDFF maps, histology and the MRS spectrum from a subject with hepatic steatosis, depicting qualitative concordance between all four references of hepatic steatosis.
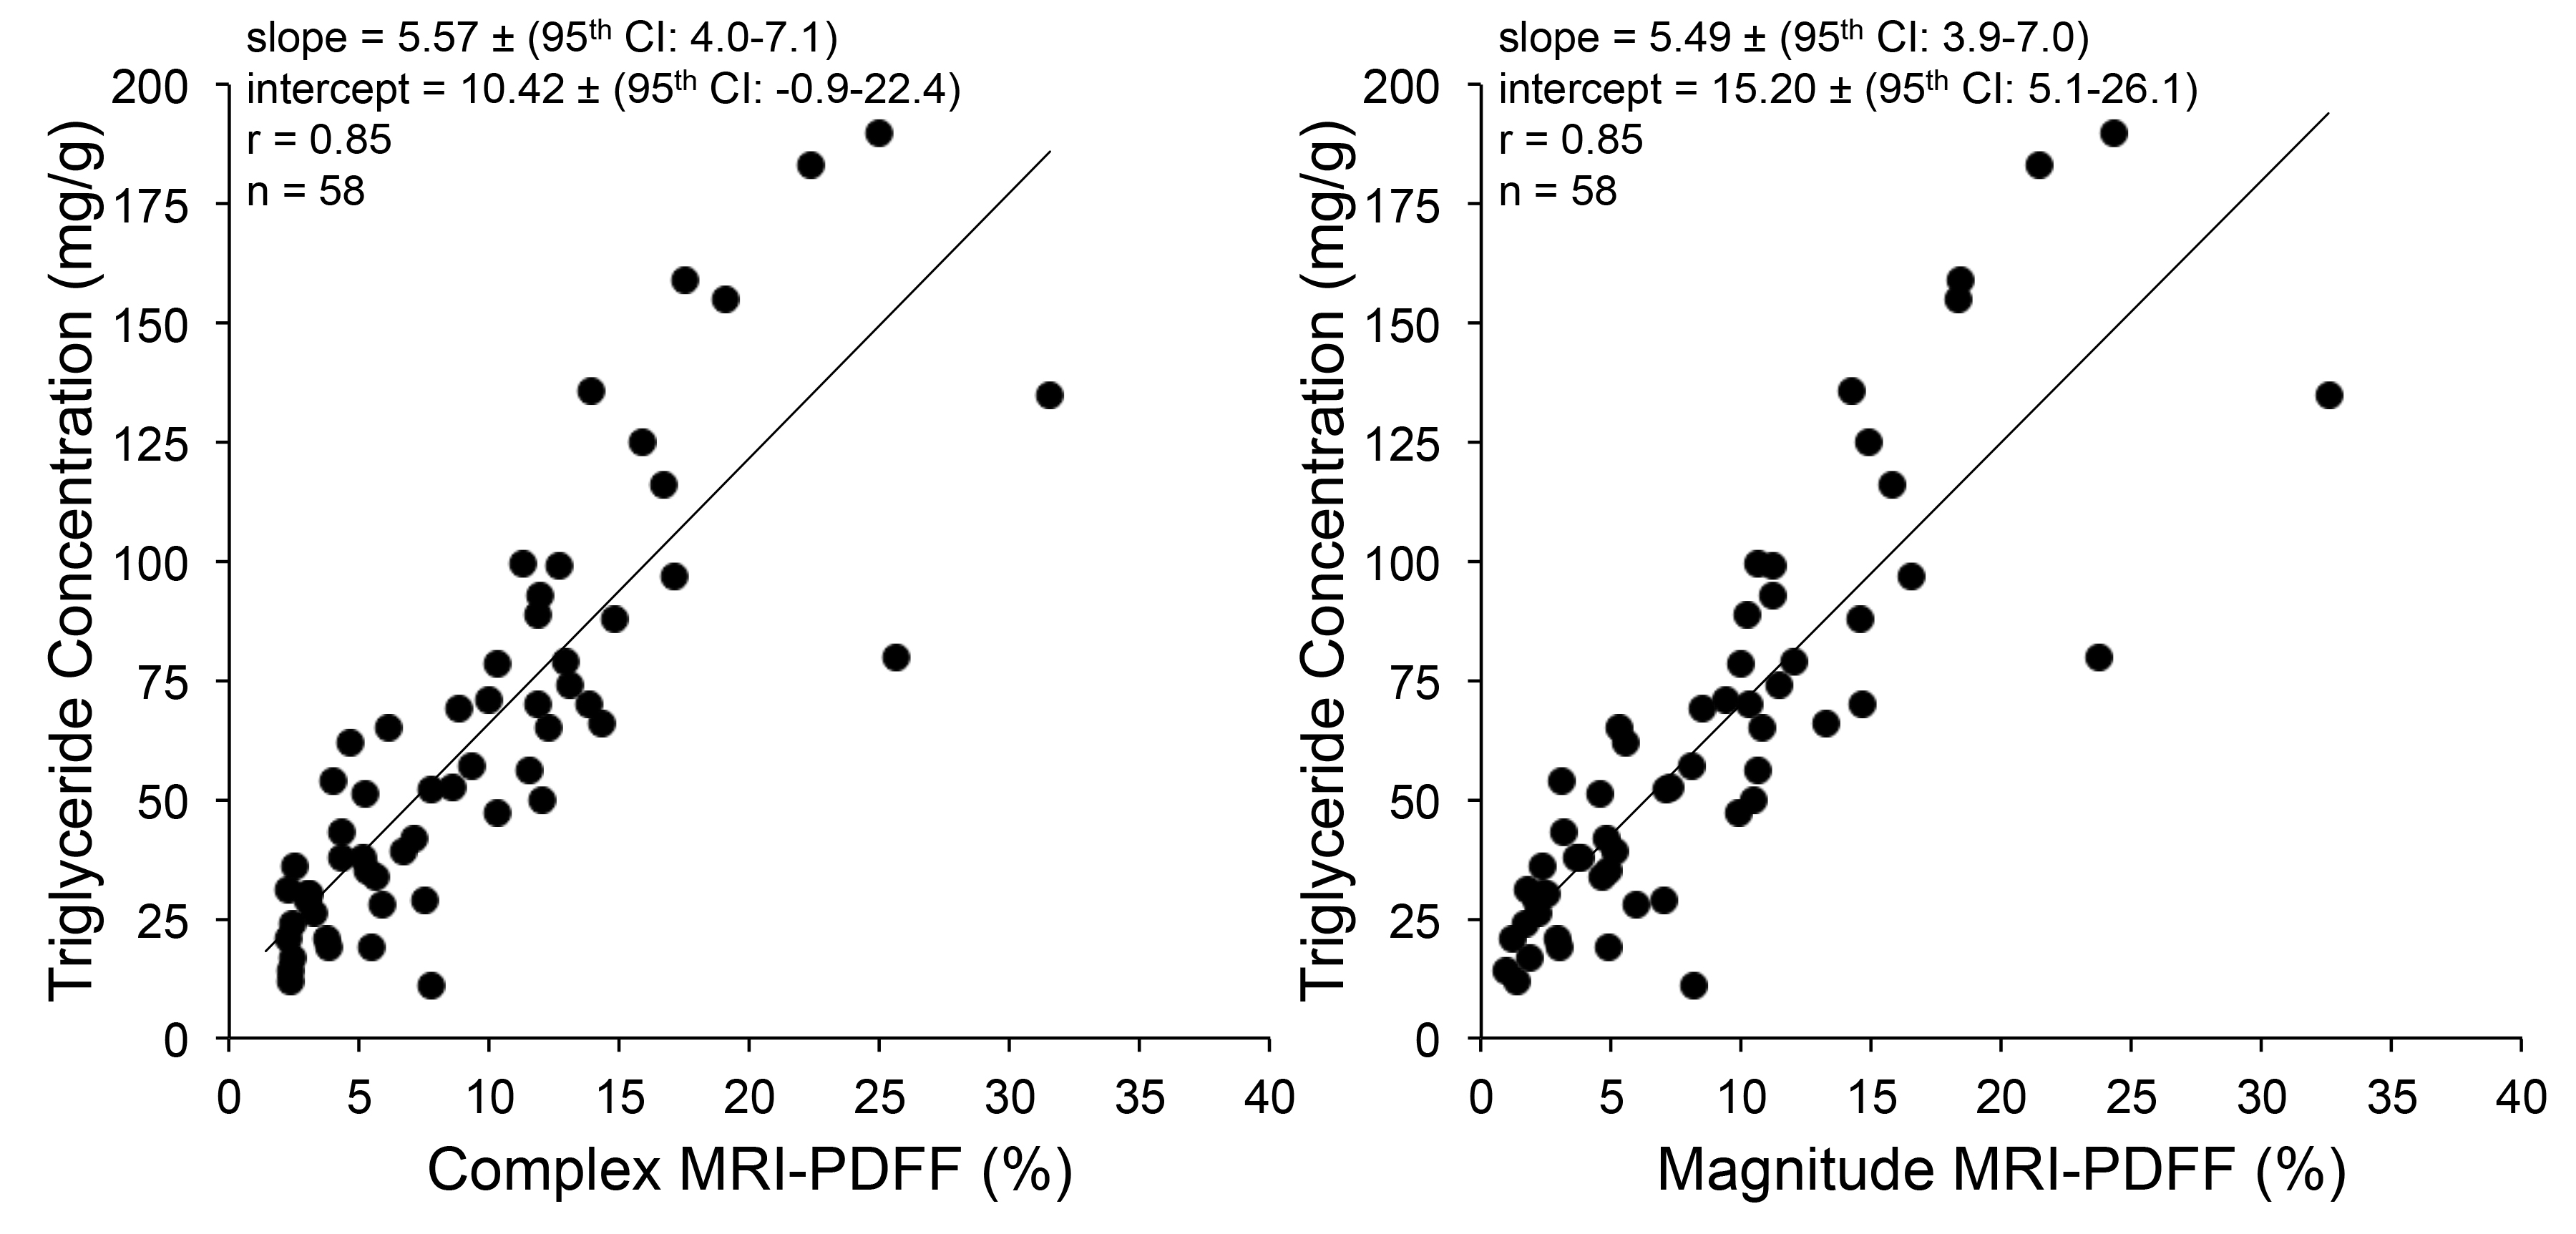
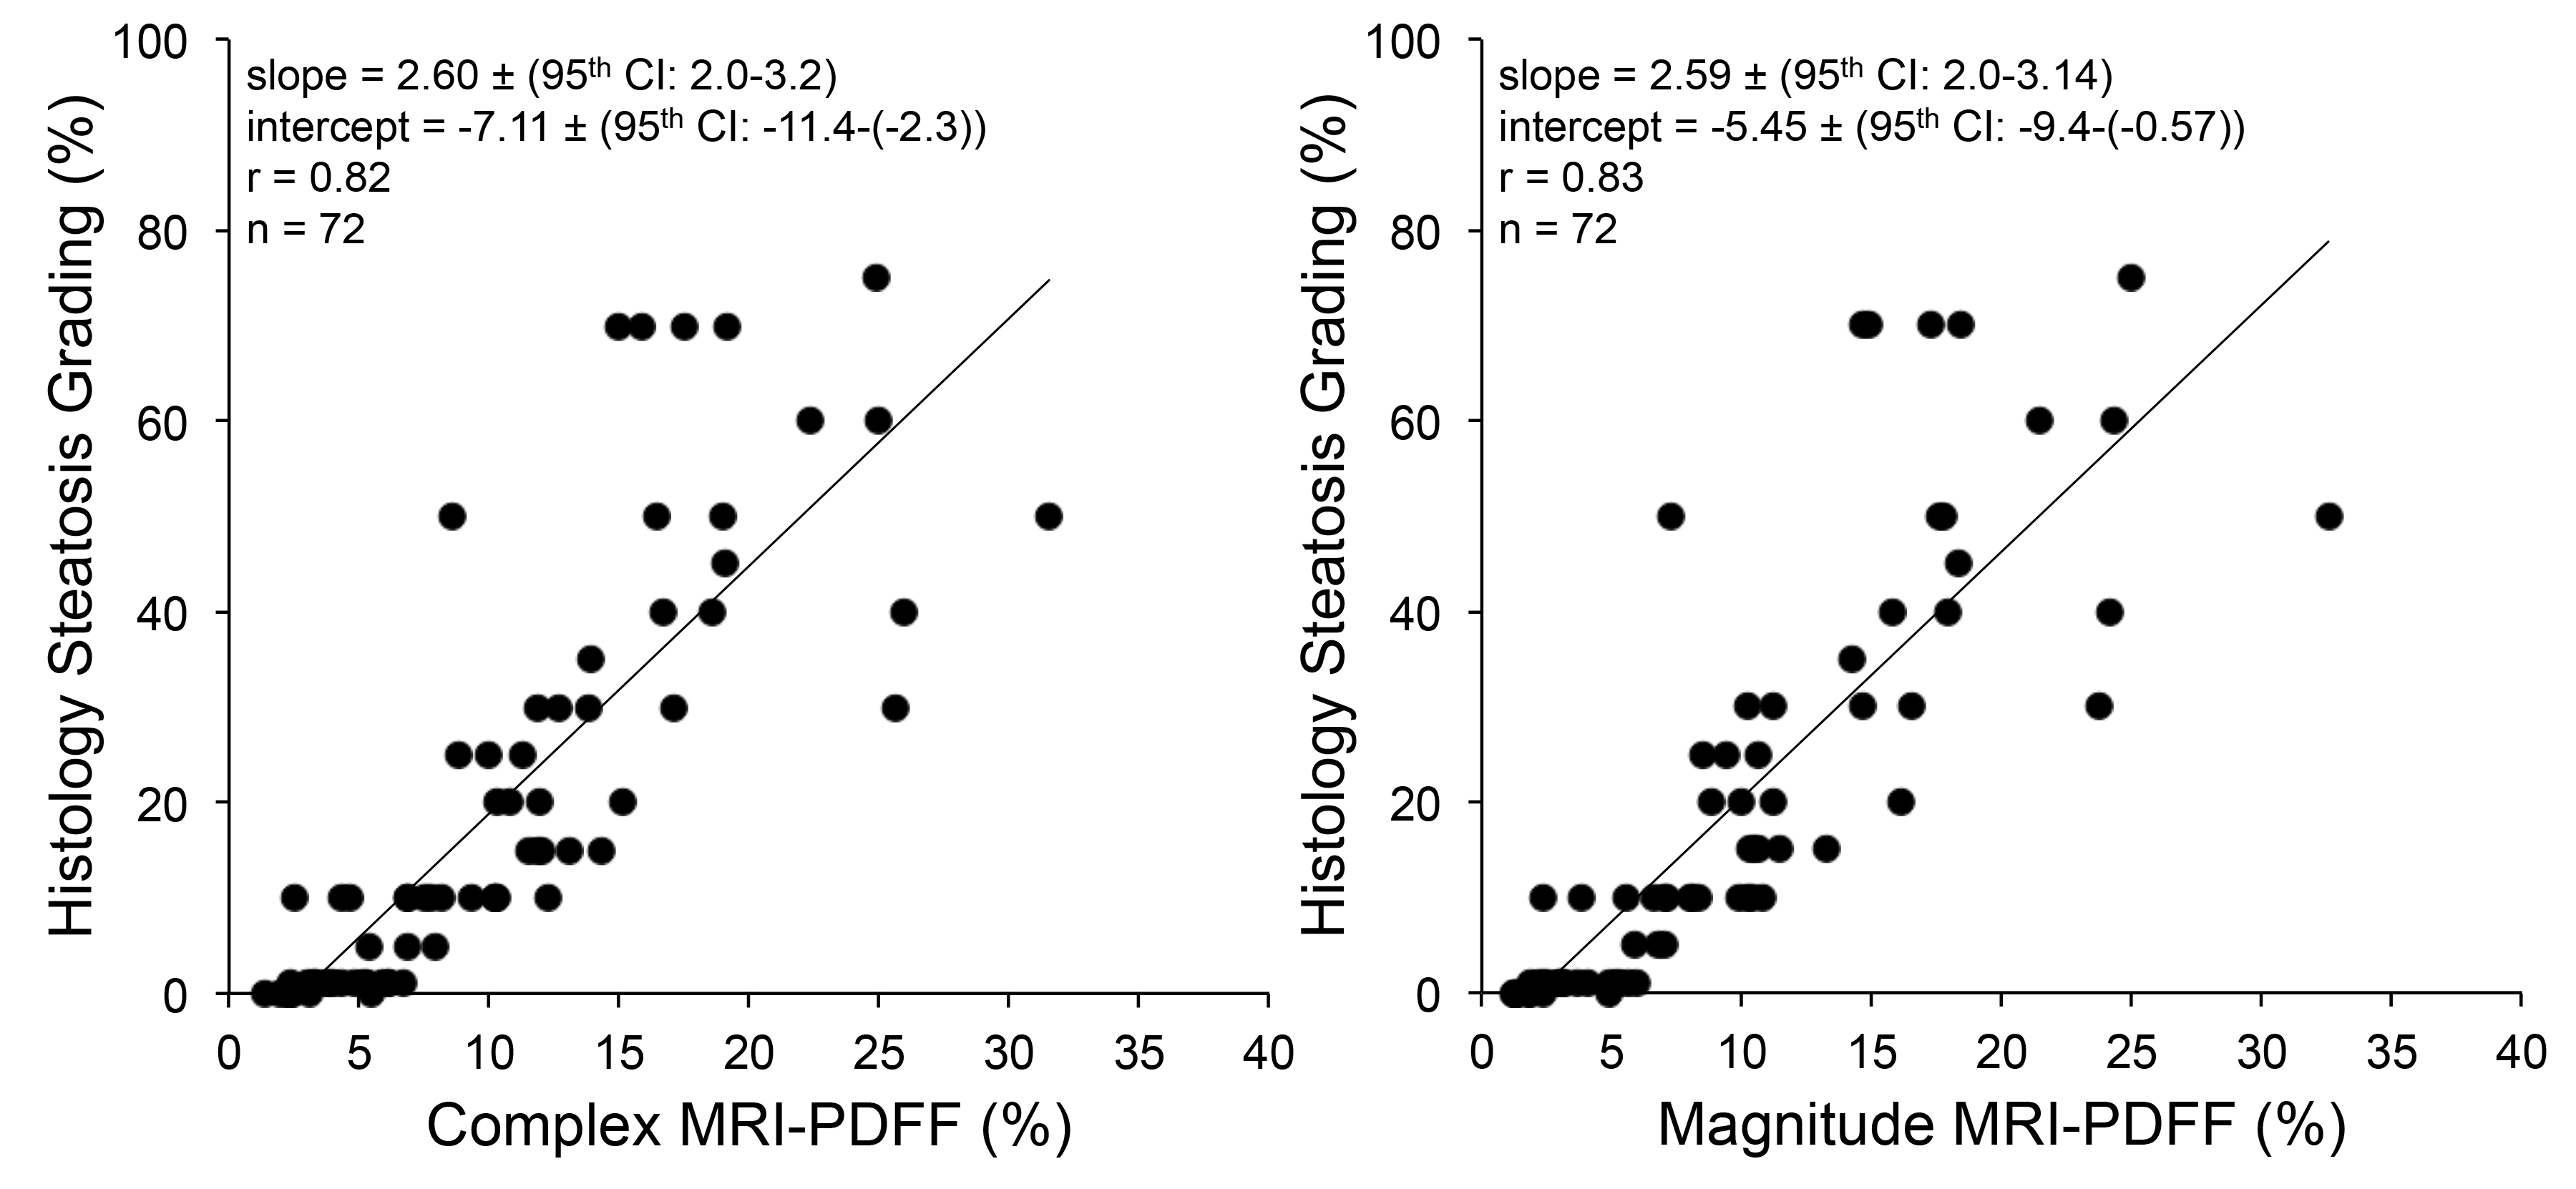
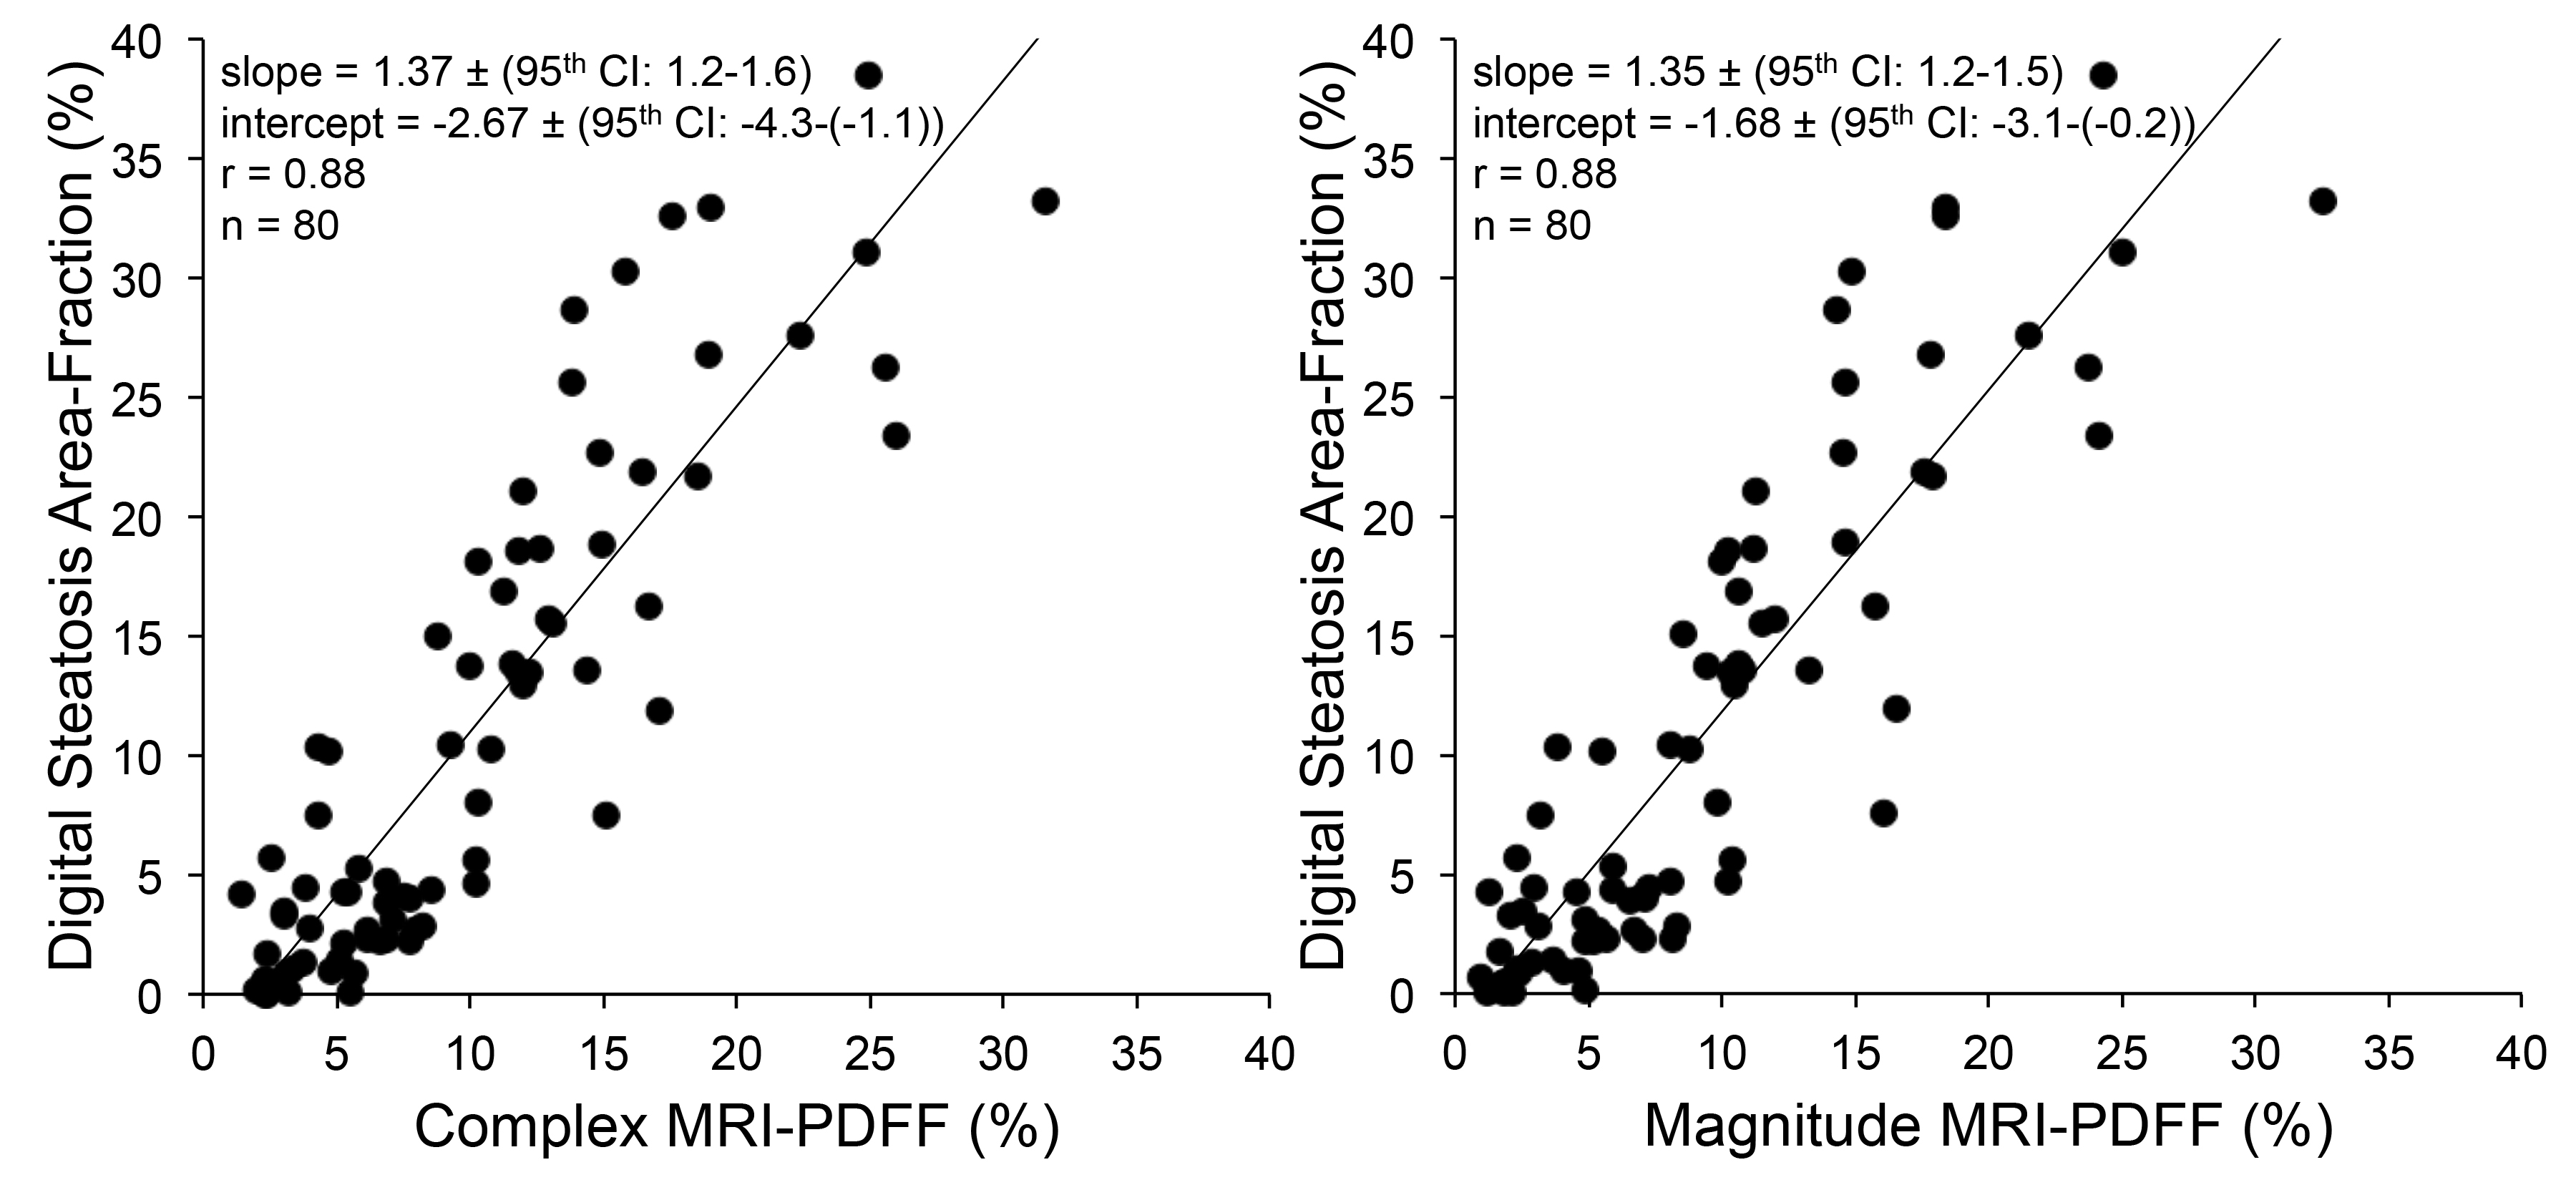
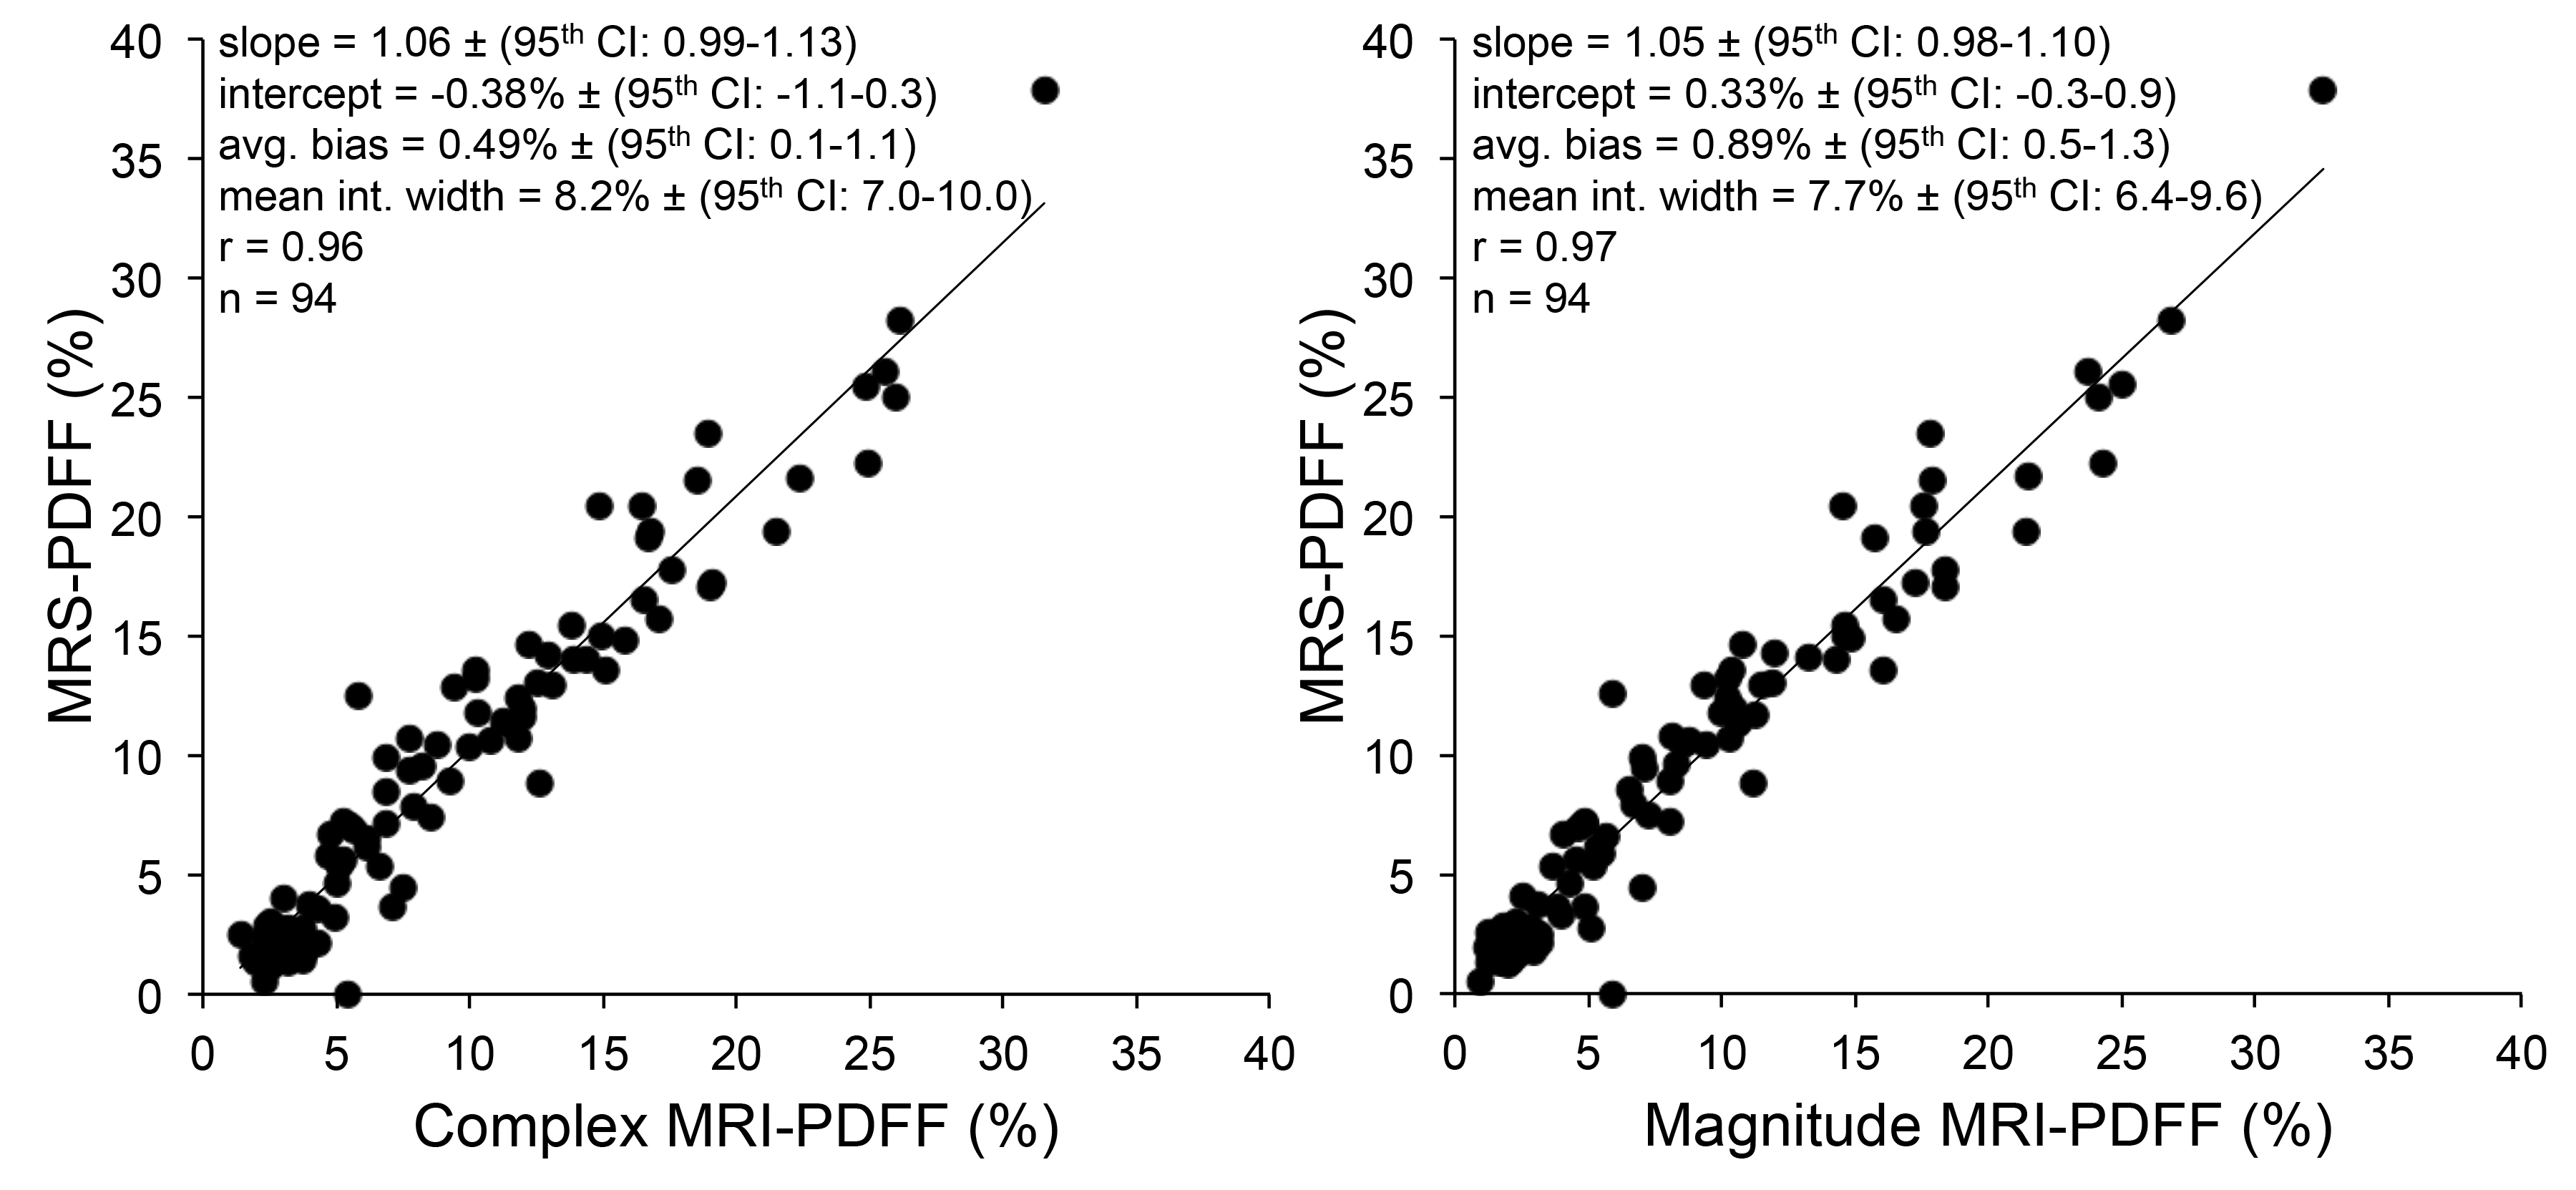
Figures 2-5 show correlations and/or agreements between complex and magnitude MRI-PDFF and each reference standard. Pearson’s correlation coefficient (r) was highest for MRS-PDFF (0.96,0.97 for Complex-MRI and Magnitude-MRI, respectively), and high for other reference standards: digital histological area-fraction (0.88,0.88), biochemical TG analysis (0.85,0.85), and conventional histology-derived steatosis percentage (0.82,0.83).
Discussion
Strong to very strong correlation was observed between MRI-PDFF and biochemical triglyceride concentration, conventional histology-derived steatosis percentage, digital histological area-fraction, and MRS-PDFF, despite the unavoidable technical difficulty of scanning morbidly obese adults. To our knowledge, this is the first in-vivo study to evaluate advanced CSE-MRI methods for PDFF quantification using a comprehensive combination of reference standards.Acknowledgements
The authors wish to acknowledge support from the NIH (UL1TR00427, R01 DK083380, R01 DK088925, R01 DK100651 and K24 DK102595), as well GE Healthcare who provides research support to the UW-Madison and UCSD.References
[1] Rehm JL, Wolfgram PM, Hernando D, Eickhoff JC, Allen DB, Reeder SB, “Proton density fat-fraction is an accurate biomarker of hepatic steatosis in adolescent girls and young women.” Eur Radiol 2015 25(10):2921-30.
[2] Artz NS, Haufe WM, Hooker CA, Hamilton G, Wolfson T, Campos GM, Gamst AC, Schwimmer JB, Sirlin CB, Reeder SB. “Reproducibility of MR-based liver fat quantification across field strength: Same-day comparison between 1.5T and 3T in obese subjects.” J Magn Reson Imaging 2015 42(3):811-7.
[3] Hamilton G, Yokoo T, Bydder M, Cruite I, Schroeder ME, Sirlin CB, Middleton MS, “In vivo characterization of the liver fat ¹H MR spectrum.” NMR Biomed 2011 24(7):784-90.
[4] Yu H, Shimakawa A, McKenzie CA, Brodsky E, Brittain JH, Reeder SB, “Multiecho water-fat separation and simultaneous R2* estimation with multifrequency fat spectrum modeling.” Maagn Reson Med 2008 60(5):1122-34
[5] Bydder M, Yokoo T, Hamilton G, Middleton MS, Chavez AD, Schwimmer JB, Lavine JE, Sirlin CB, “Relaxation effects in the quantification of fat using gradient echo imaging.” Magn Reson Imaging. 2008 26(3):347-59.
[6] Yu H, McKenzie CA, Shimakawa A, Vu AT, Brau AC, Beatty PJ, Pineda AR, Brittain JH, Reeder SB, “Multiecho reconstruction for simultaneous water-fat decomposition and T2* estimation.” J Magn Reson Imaging. 2007 26(4):1153-61.
[7] Hernando D, Hines CD, Yu H, Reeder SB, “Addressing phase errors in fat-water imaging using a mixed magnitude/complex fitting method.” Magn Reson Med. 2012 67(3):638-44.
[8] Liu CY, McKenzie CA, Yu H, Brittain JH, Reeder SB, “Fat quantification with IDEAL gradient echo imaging: correction of bias from T1 and noise.” Magn Reson Med 2007 58(2):354-64.
[9] Bydder M, Hamilton G, Yokoo T, Sirlin CB, “Optimal phased-array combination for spectroscopy.” Magn Reson Imaging. 2008 Jul;26(6):847-50
[10] Brunt EM, Janney CG, Di Bisceglie AM, Neuschwander-Tetri BA, Bacon BR, “Nonalcoholic steatohepatitis: a proposal for grading and staging the histological lesions.” Am J Gastroenterol. 1999 Sep;94(9):2467-74.
[11] Marsman H, Matsushita T, Dierkhising R, Kremers W, Rosen C, Burgart L, Nyberg SL, “Assessment of donor liver steatosis: pathologist or automated software?” Hum Pathol 2004 35(4):430-435. [12] Bland AM, Altman DG, “Applying the right statistics: analyses of measurement studies.” Ultrasound Obstet Gynecol 2003 22(1):85-93.
Figures