0122
Addressing Metabolic Heterogeneity in Clear Cell Renal Cell Carcinoma with Quantitative Magnetic Resonance Imaging1Radiology, UT Southwestern Medical Center, Dallas, TX, United States, 2Children's Medical Center Research Institute, UT Southwestern Medical Center, Dallas, TX, United States, 3Pathology, UT Southwestern Medical Center, Dallas, TX, United States, 4Internal Medicine, UT Southwestern Medical Center, Dallas, TX, United States, 5Philips Medical Systems, Cleveland, OH, United States, 6Molecular Genetics, UT Southwestern Medical Center, Dallas, TX, United States, 7Urology, UT Southwestern Medical Center, Dallas, TX, United States, 8Internal Medicine & Kidney Cancer Program, UT Southwestern Medical Center, Dallas, TX, United States
Synopsis
MRI fat fraction (FF, Dixon) and % enhancement (DCE) measurements in vivo in clear cell renal cell carcinoma (ccRCC) were correlated with intracellular fat (Oil Red O), lipidomic profile (mass spectrometry), and cellular metabolomics of tissue samples isolated from anatomically co-registered locations in the same tumor. In vivo FF correlated positively with histologic fat content, spectrometric cholesterol and triglycerides; and negatively with spectrometric free fatty acids and phospholipids. ISUP grade 2 and 3 tumors exhibited marked intra-tumoral heterogeneity in FF whereas grade 4 tumors had reduced lipid accumulation. MRI-derived FF and % enhancement correlated with altered metabolic features of ccRCC.
Introduction
Dysregulated lipid and glucose metabolism has been implicated in the progression of clear cell renal cell carcinoma (ccRCC), the most common type of renal cancer. ccRCC is characterized by histologically prominent storage of glycogen and lipids (1). ccRCC expresses high levels of enzymes necessary to produce fatty acids and other lipids, and two of these, fatty acid synthase and stearoyl-CoA desaturase, are associated with poor prognosis (2,3), suggesting that reprogrammed lipid metabolism in ccRCC might provide biomarkers of oncological aggression. Pre-operative tissue-based assessment of tumor metabolic alterations is challenged by the heterogeneous nature of ccRCC (4). A non-invasive imaging method that predicts metabolic alterations in the whole tumor would be appealing pre-operatively for optimal patient management and selection of neoadjuvant therapy. The purpose of this study was to assess the role of Dixon- and dynamic contrast enhanced (DCE)-MRI-derived quantitative measures of intratumoral lipid accumulation and vascularity, respectively, as non-invasive in vivo biomarkers of heterogeneous metabolic reprogramming in ccRCC.Materials and Methods
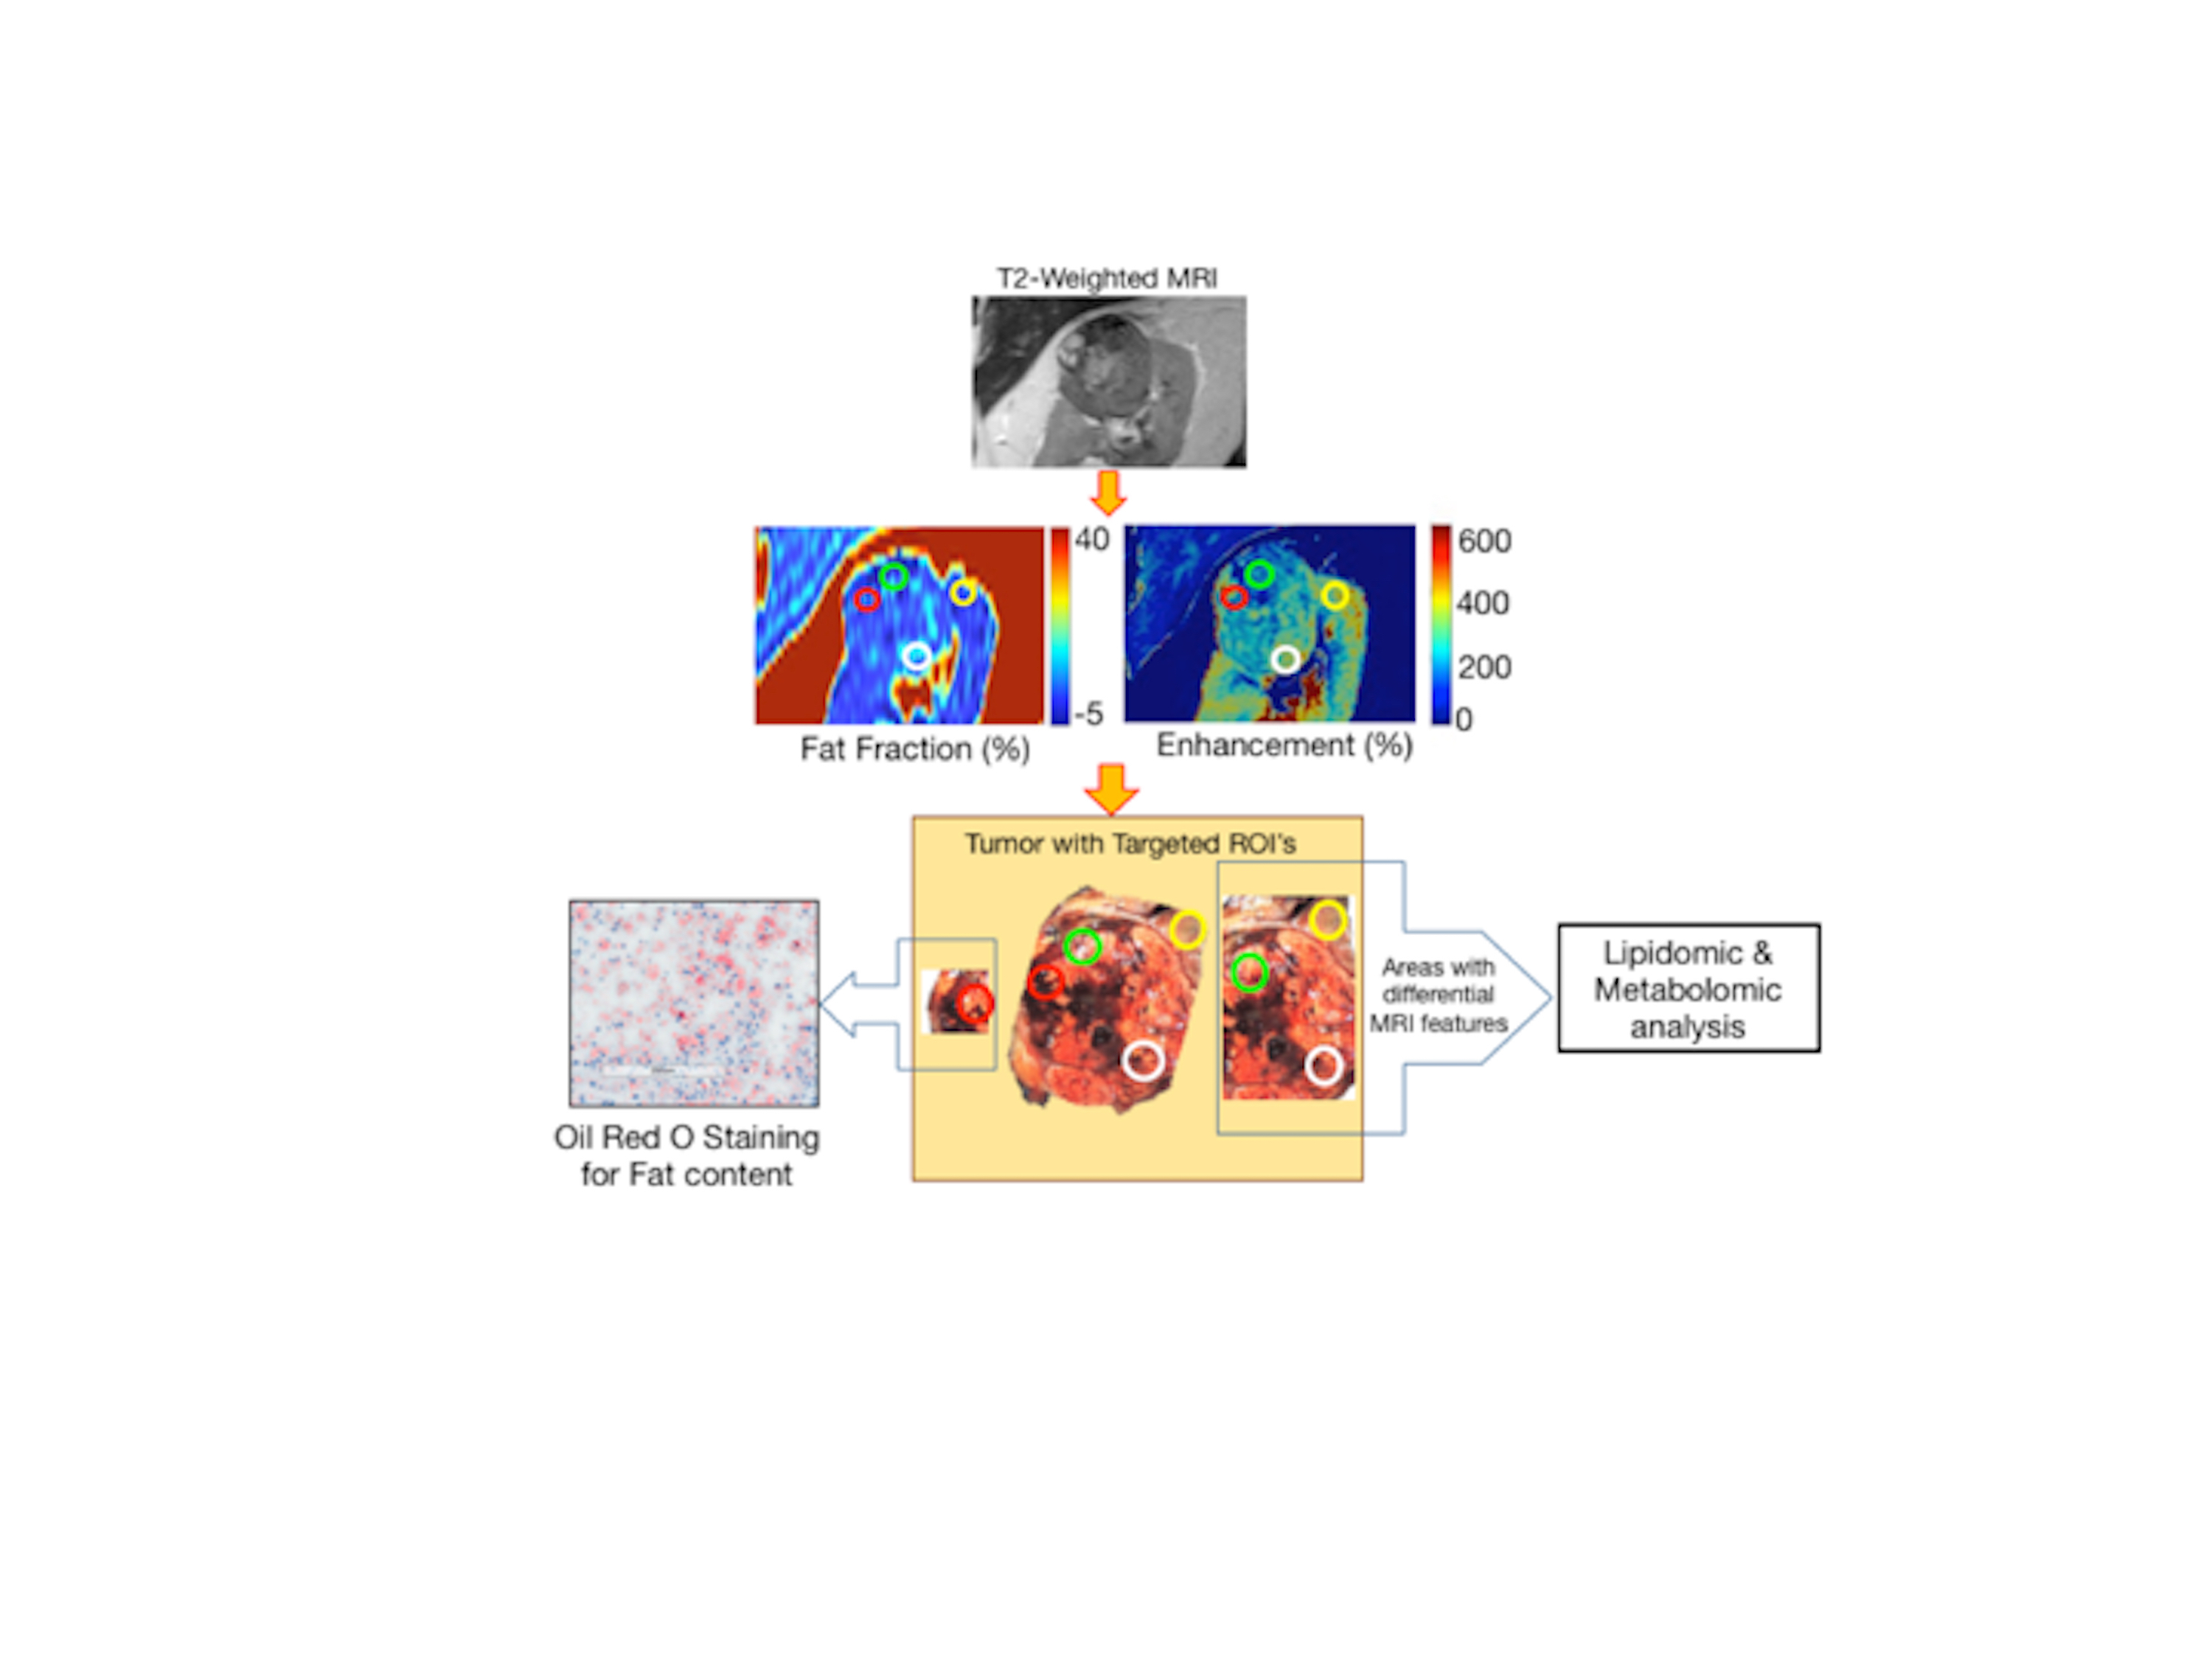
Patients and MRI Protocol: This prospective, IRB-approved, HIPAA-compliant study included 43 patients (34 M, 9 F) with pathologically confirmed ccRCC who signed informed consent prior to 3T MRI (Achieva/Ingenia, Philips Healthcare): 1) axial 3D T1-W FFE multi-echo DIXON with a commercial sequence (TR/TE = 6.7~8/1.09~1.24 ms, ΔTE = 0.9~1.1ms, 6 echoes, FA = 2~3°, NSA = 1, thickness = 3mm, in-plane resolution = 1.5mm×2mm, FOV = 402×240×96 mm2, matrix = 268×120×32, bandwidth = 1413.2 Hz/pixel, acquisition time= 15~19 seconds); 2) DCE MRI with a coronal 3D T1W FFE sequence (TR/TE = 3/1.53 ms, FA = 10°, NSA = 1, thickness = 5mm, FOV = 408×408 mm2, matrix = 288×288, bandwidth = 1325 Hz/pixel) after a 0.1 mmol/kg bolus of gadobutrol (Gadavist; Bayer Healthcare) at 2 mL/sec for 5 min 45 sec at a 5 sec temporal resolution. Three consecutive dynamic phases (5 sec each) were obtained within each 15-sec breath-held acquisition period with a 15-sec period of free-breathing between consecutive acquisition periods. Image Analysis: The mean Fat Fraction (FF) and standard deviation (SD) was recorded with a region of interest (ROI) including the entire tumor on the 3D FF map (3DROI). Additionally, a targeted region of interest (tROI) was placed on representative locations on the FF map correlating to tissue samples obtained for Oil Red O (ORO) staining. tROIs were also placed on the pre-contrast and the peak enhanced image in the DCE acquisition for 23 of the patients (55 tROIs). The % enhancement of the tROIs was calculated as (SIpeak – SIpre)/ SIpre×100% as a measure of tumor vascularity, where SIpeak and SIpre are peak post- and pre-contrast signal intensities, respectively. Histopathology: After nephrectomy, tumor specimens were anatomically oriented using fiducial markers placed during surgery and then bivalved to match the MRI acquisition plane (Fig 1). Hematoxylin-eosin slides were used for assessment of nuclear (ISUP) tumor grade. 24 fresh tumor samples matching the location of the tROI within FF map were obtained (20 patients) and stained with ORO (number of stained cells estimated to the nearest %). Additional fresh tissue samples matching tROIs were used for lipidomic and metabolomics (mass spectrometry). Statistics: Mean FF and SD for tROIs were correlated to tumor ISUP grade. Linear regression was performed to correlate FF and ORO%. Univariate statistical differences of the metabolites between two groups were analyzed using Student’s t-test.Results
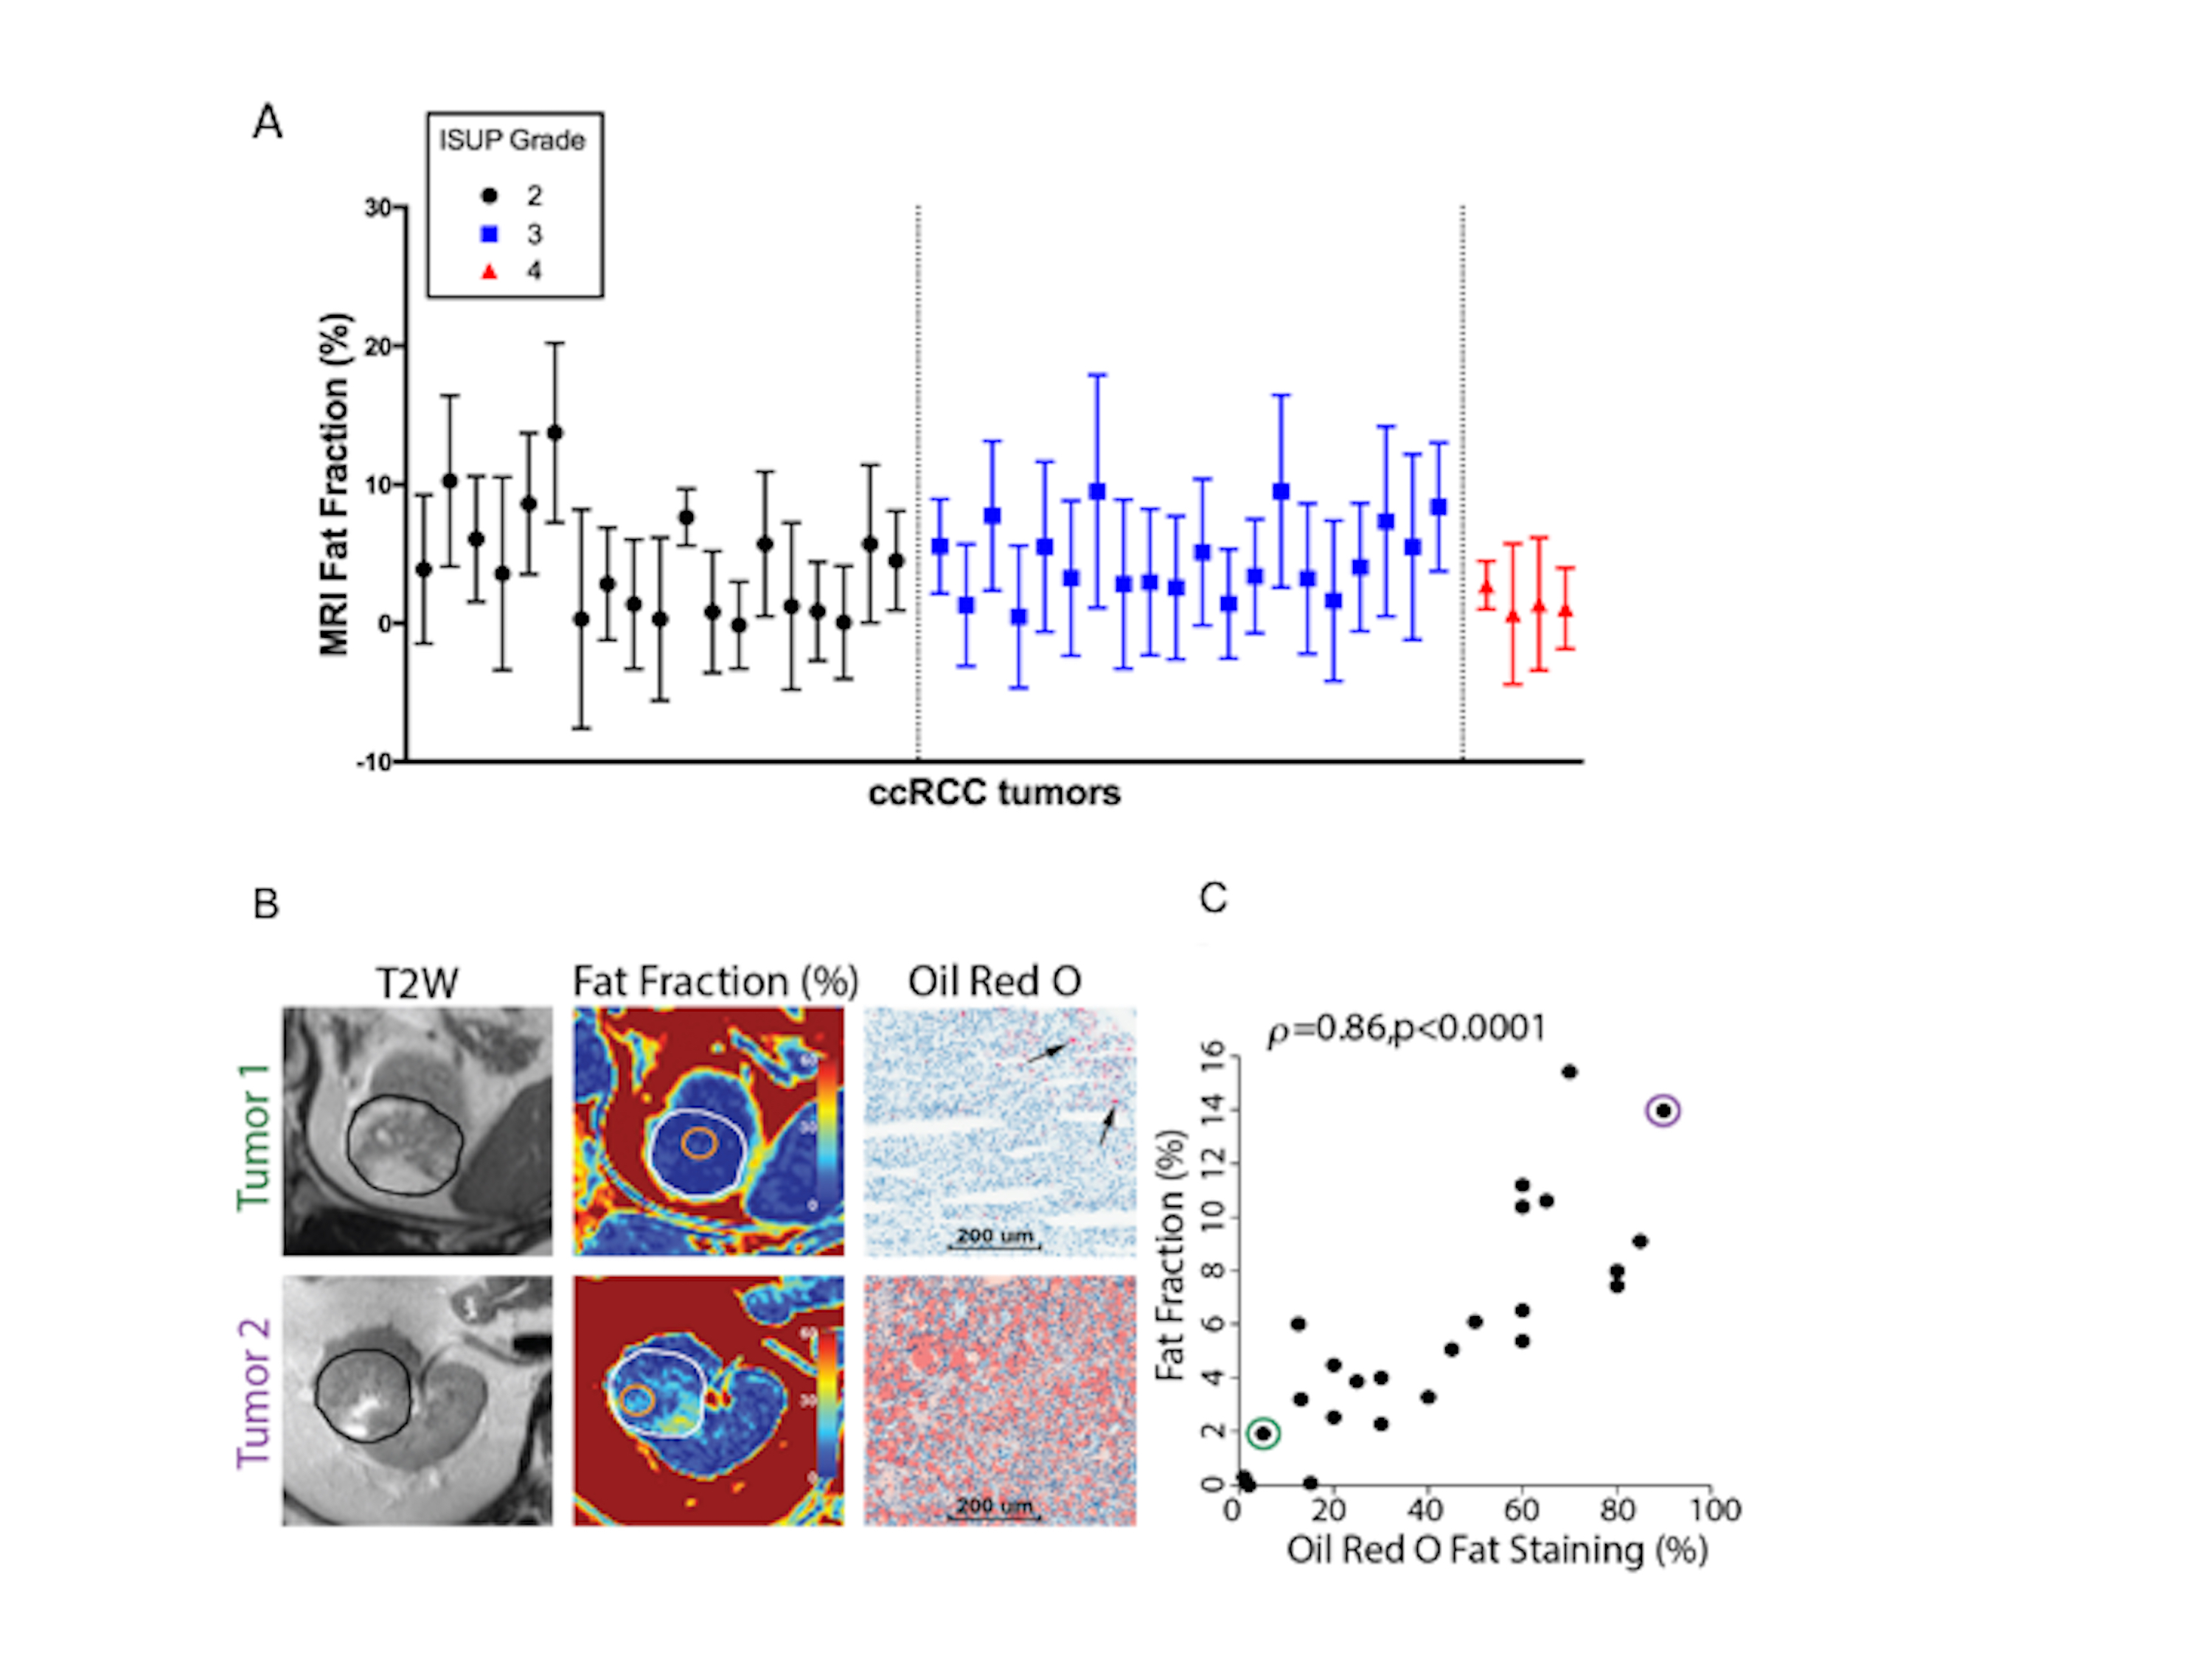
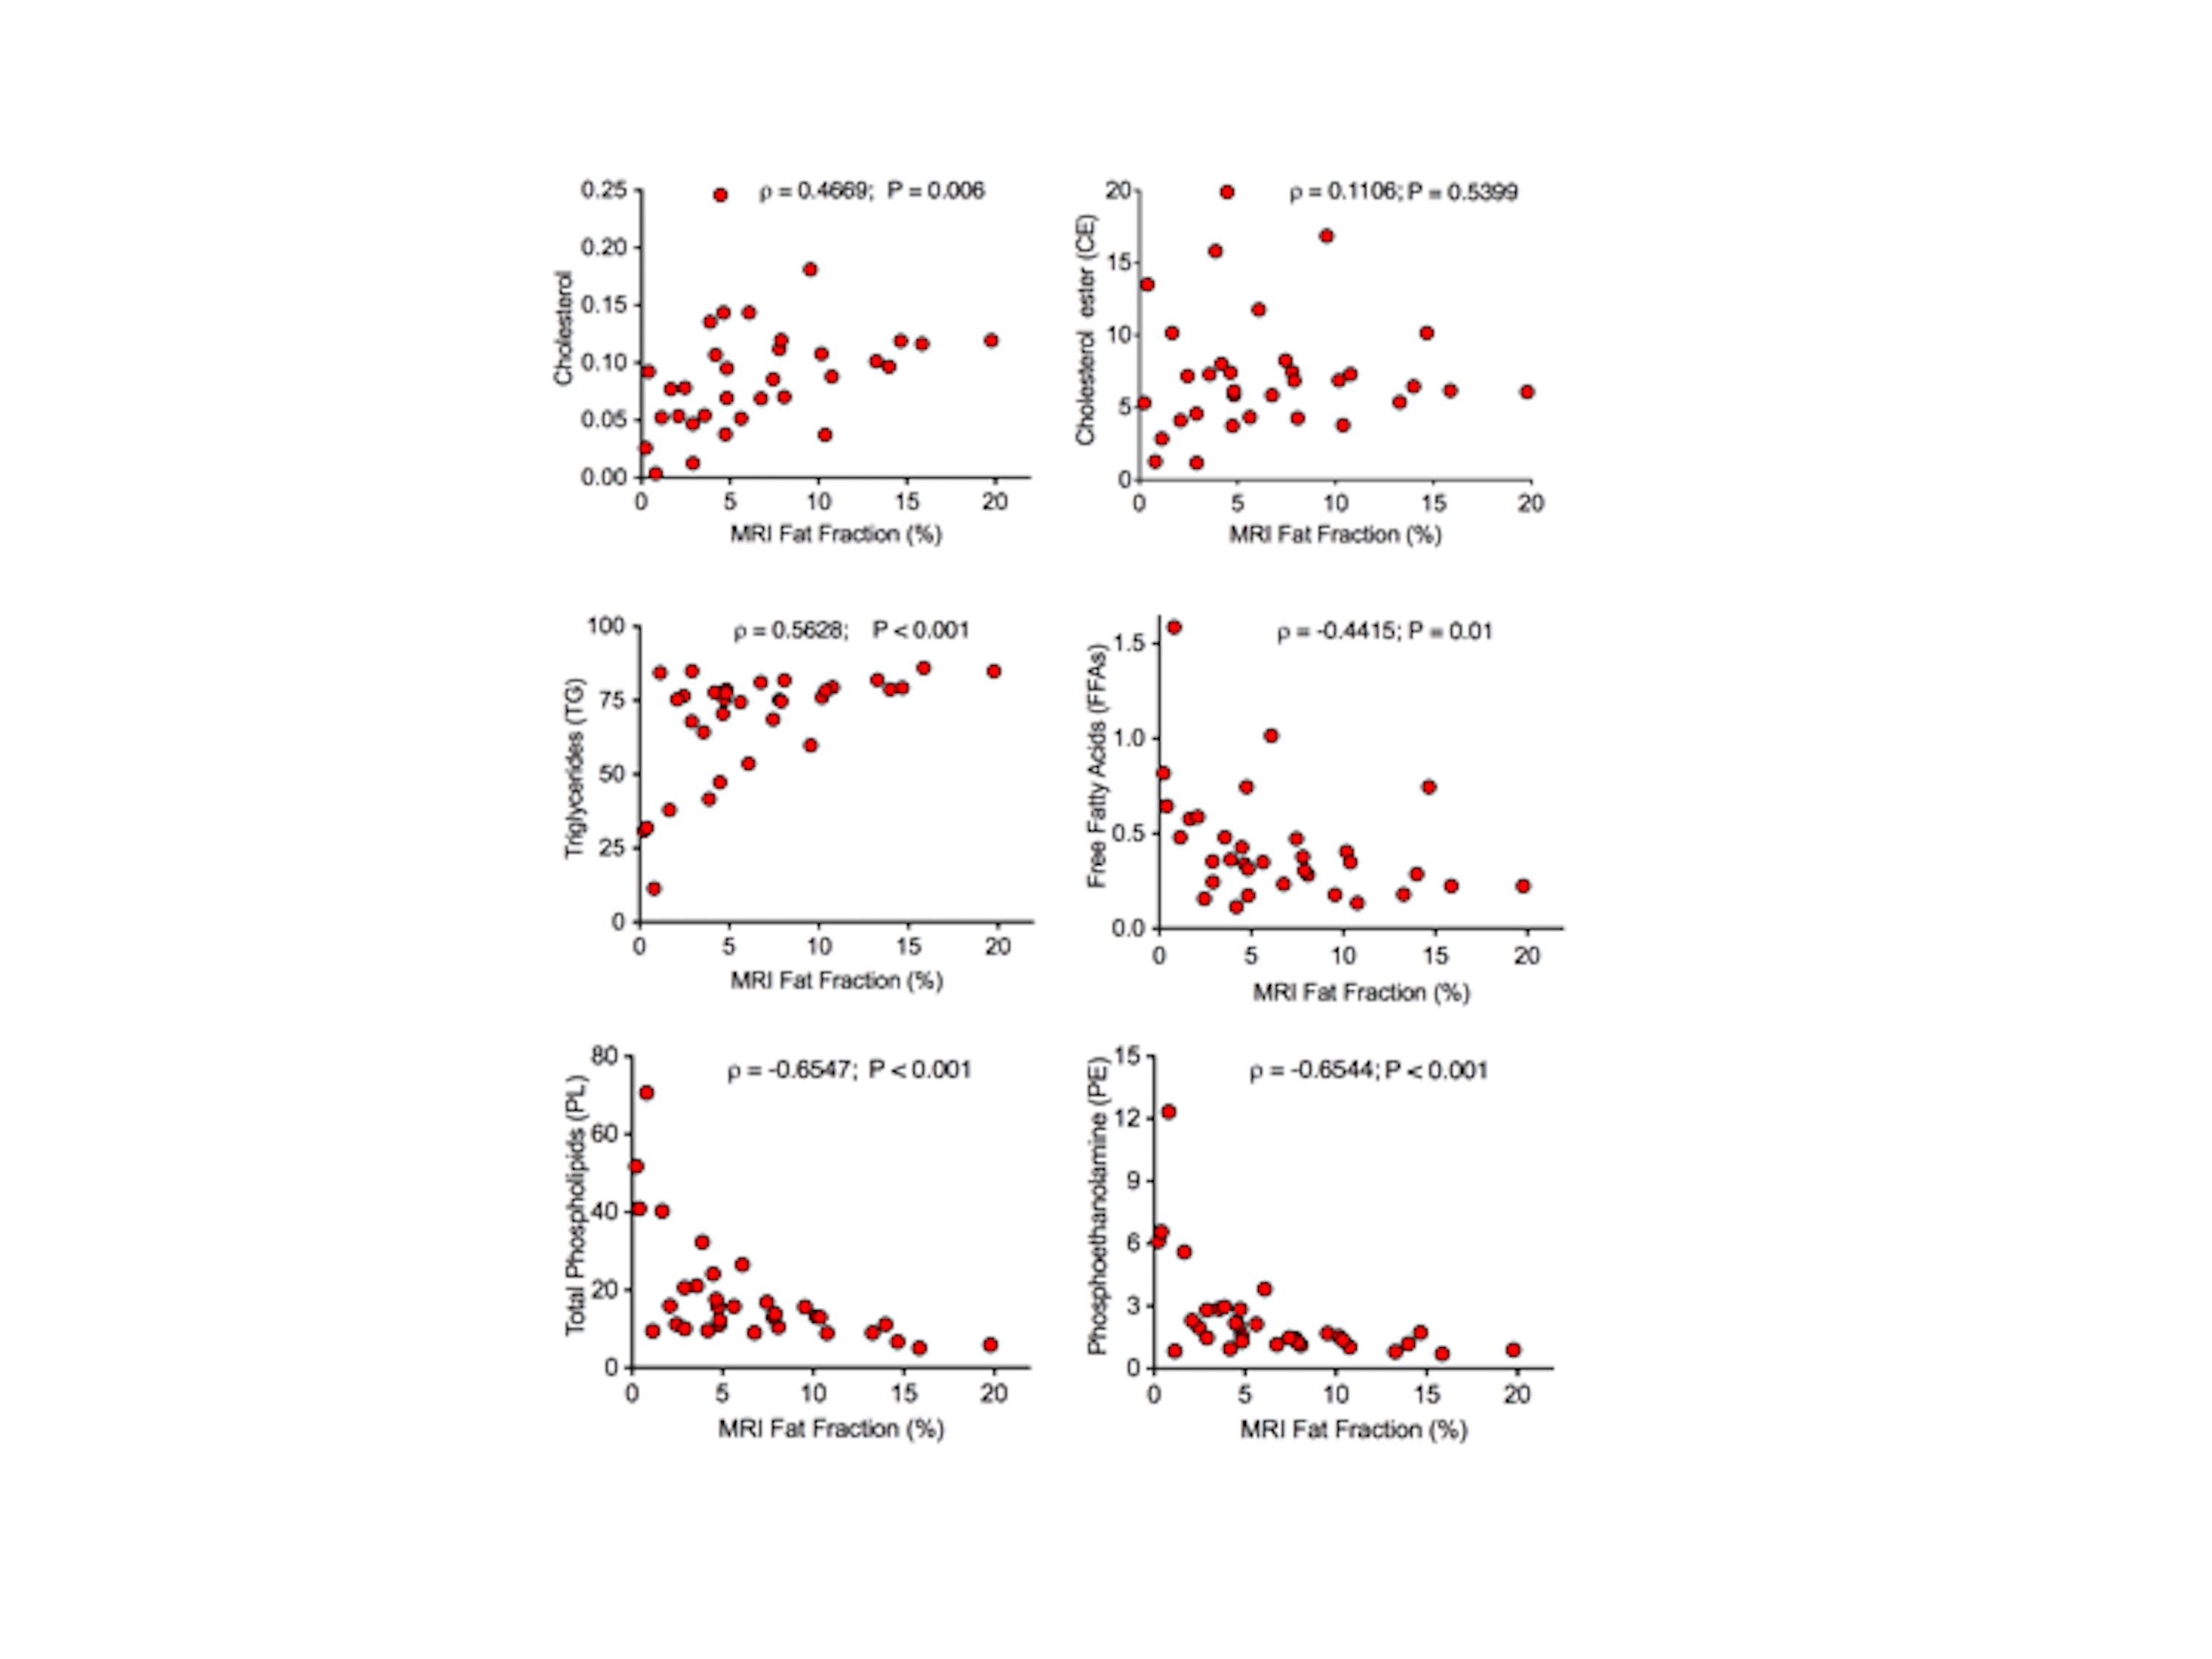
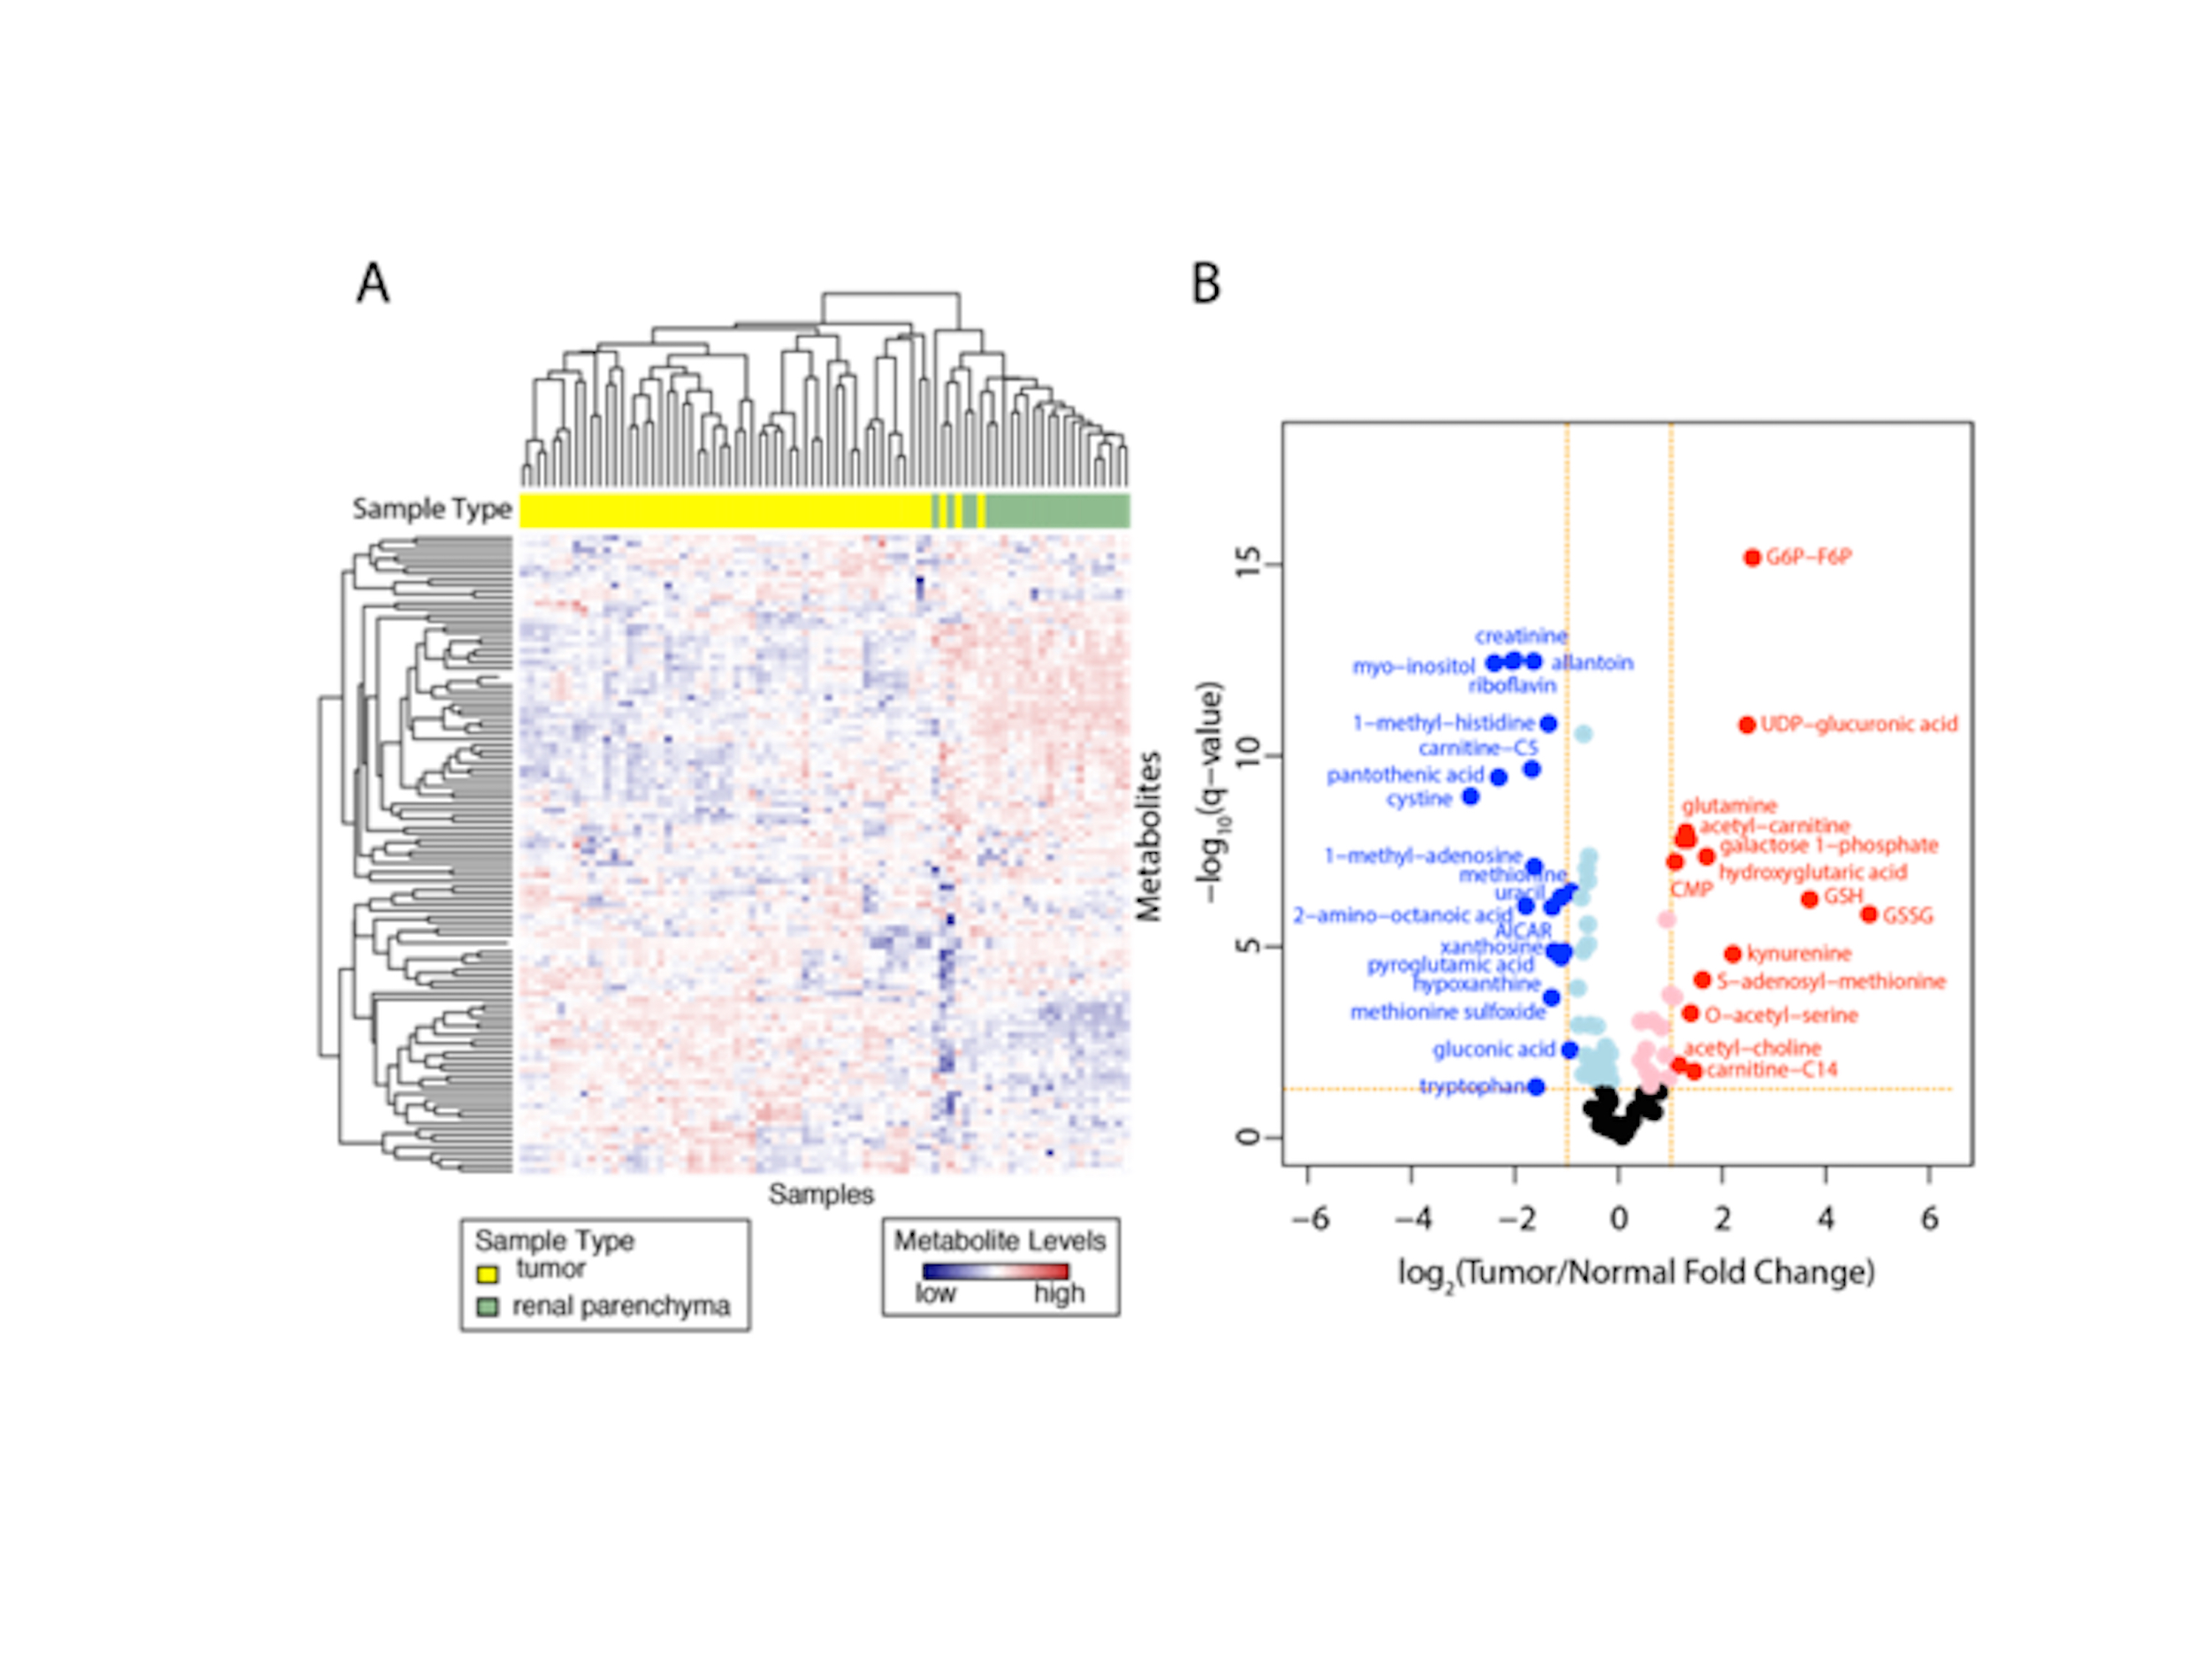
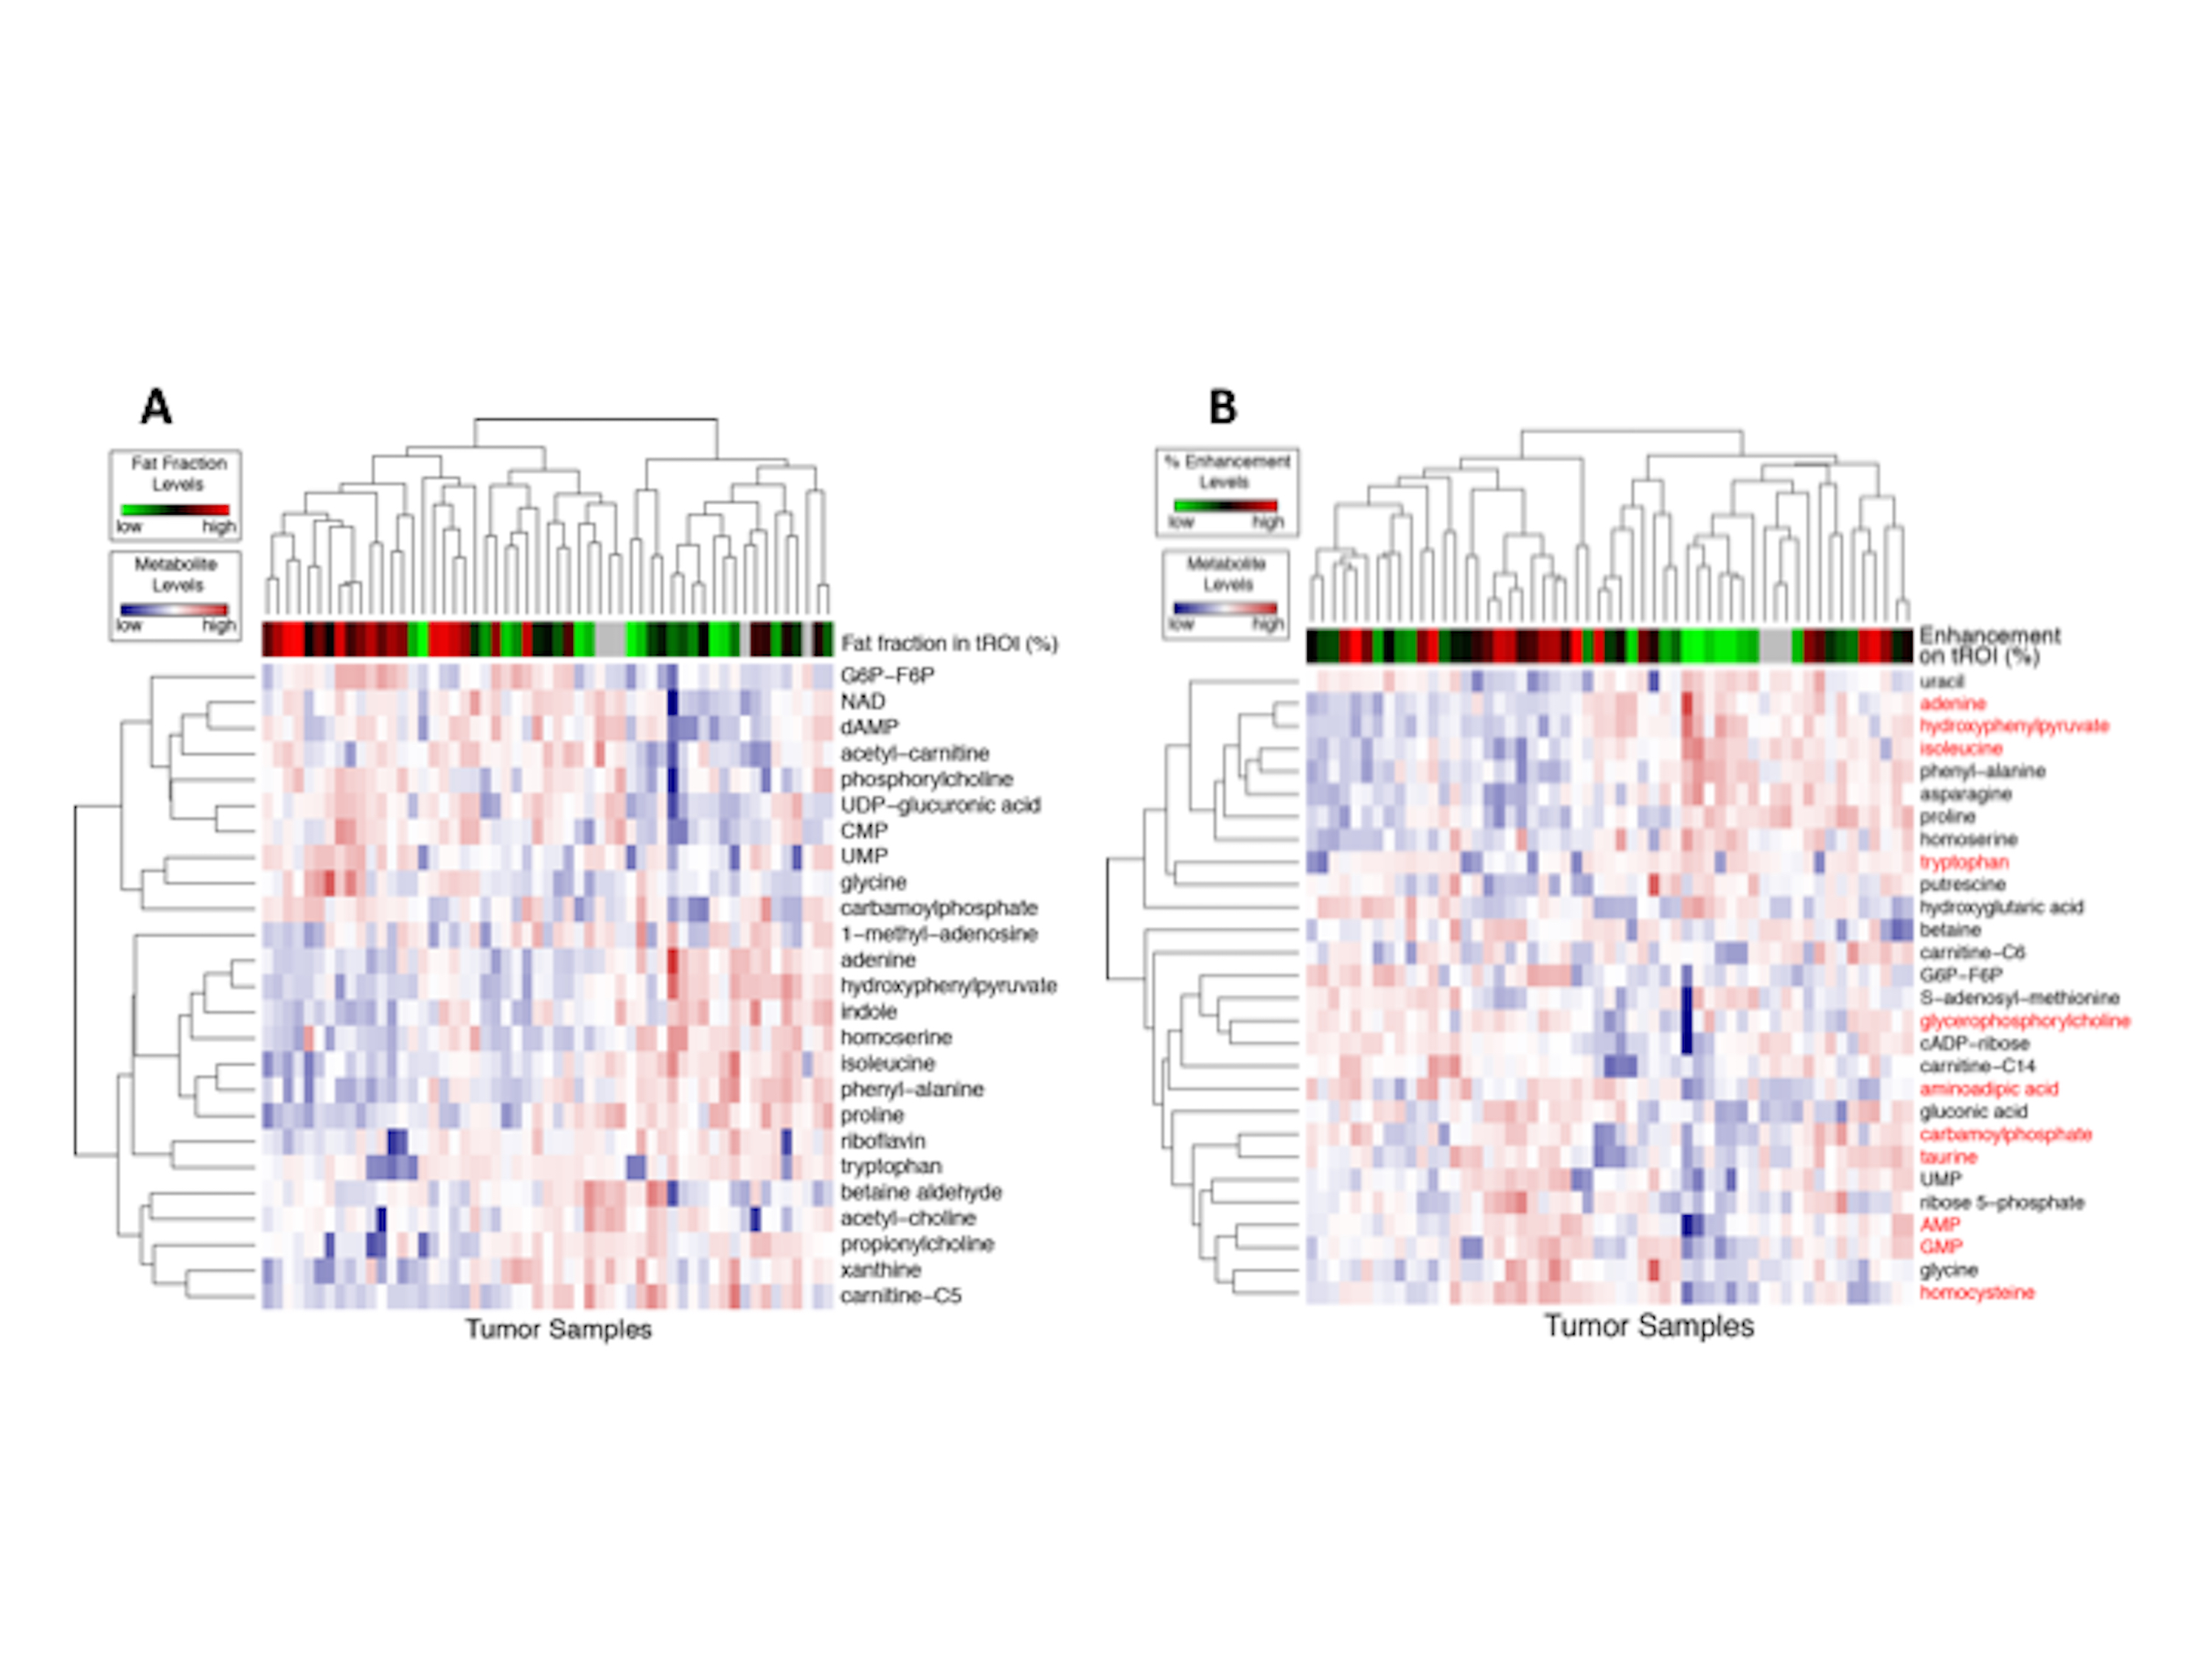
19 tumors were low grade (ISUP grade 1–2) ccRCC and 24 high grade (ISUP grade 3–4) ccRCC. ISUP grade 2 and 3 tumors exhibited marked intra-tumoral FF heterogeneity, whereas grade 4 tumors had reduced lipid accumulation compared to grade 3 (p=0.016) (Fig 2A). In vivo tumor FF correlated positively with histologic fat content (Spearman correlation coeff. ρ = 0.86, p <0.0001) (Fig 2B, C), spectrometric triglycerides (ρ = 0.56, P = 0.0007) and cholesterol (ρ = 0.47, P = 0.006), respectively; and negatively with spectrometric free fatty acids (ρ = -0.44, P = 0.01) and phospholipids (ρ = -0.65, P = 0.001), respectively (Fig 3). Aqueous metabolic profiling showed differences in metabolites in tumors compared to renal parenchyma (Fig 4), and correlated with FF measures (nominal P< 0.05), and showed significant correlation with tumor vascularity (11 metabolites, FDR p <0.05) (Fig 5).Discussion
MRI-derived FF and tumor enhancement correlated with altered metabolic features of ccRCC and metabolic heterogeneity within a given tumor. Furthermore, MRI-directed targeted tissue sampling provides a platform for understanding intratumoral heterogeneity in lipid metabolism that may be leveraged to identify potential therapeutic targets.Conclusion
Quantitative Dixon- and DCE-MRI allows for noninvasive assessment of intratumoral heterogeneity of lipid metabolism in ccRCC.Acknowledgements
Funding: NIH RO1 Grant R01CA154475 (I.P), NIH P50CA196516 (I.P, J.B, R.D, J.A.C.), Welch Foundation I-1832 (J.Y.).
References
1. http://cancergenome.nih.gov/cancersselected/kidneyclearcell
2. Gerlinger M, Rowan AJ, Horswell S, et al. Intratumor heterogeneity and branched evolution revealed by multiregion sequencing. N Engl J Med 2012; 366:883–892.
3. Horiguchi A, Asano T, Asano T, et al. Fatty acid synthase over expression is an indicator of tumor aggressiveness and poor prognosis in renal cell carcinoma. J Urol. 2008 Sep;180(3):1137-40.
4. von Roemeling CA, Marlow LA, Wei JJ, et al. Stearoyl-CoA desaturase 1 is a novel molecular therapeutic target for clear cell renal cell carcinoma. Clin Cancer Res. 2013 May 1;19(9):2368-80.
Figures