0120
Quantification of short-T2* Signal Components in the Liver using Radial 3D UTE Chemical Shift-Encoded MRI1Biomedical Engineering, University of Wisconsin-Madison, Madison, WI, United States, 2Radiology, University of Wisconsin-Madison, Madison, WI, United States, 3Medical Physics, University of Wisconsin-Madison, Madison, WI, United States, 4Medicine, University of Wisconsin-Madison, Madison, WI, United States, 5Emergency Medicine, University of Wisconsin-Madison, Madison, WI, United States
Synopsis
Recent studies have suggested the presence of a short-T2* signal component in the liver. The origin and MR properties of this signal have not been determined but have been shown to confound the liver fat quantification when using short echo times. In this work, we developed a UTE chemical shift-encoded MRI technique and a multi-component reconstruction to characterize short-T2* liver signals. A short-T2* signal fraction of 11.6±2.4% with an R2* of 2222±281s-1 was measured in seven healthy volunteers. This study demonstrated the presence of the short-T2* signal component in healthy livers and provided an initial estimate to guide future studies.
Introduction
Rapidly decaying signals have been observed in gradient echo images of livers without iron overload1, suggesting the presence of bound protons with short-T2* values. This short-T2* component will lead to bias in chemical shift-encoded (CSE) fat quantification acquired with short TEs (<1ms) if not included in the signal model. However, critical MR properties (e.g. fraction of signal and R2*) of this signal component have yet to be characterized. The purpose of this study was to develop an optimized radial 3D-ultrashort TE CSE (UTE-CSE) acquisition technique with a multi-component reconstruction model for the detection and quantification of the short-T2* signal in the liver. A preliminary study was conducted in seven healthy volunteers.Methods
Subjects: After receiving local Institutional Review Board (IRB) approval, seven healthy volunteers (3 men and 4 women, mean age 26.6±4.3 years) were imaged on a clinical 3.0T MRI system (GE Healthcare Discovery MR 750, Waukesha, WI) using a 32-channel phased array torso coil (Neocoil, Pewaukee, WI).
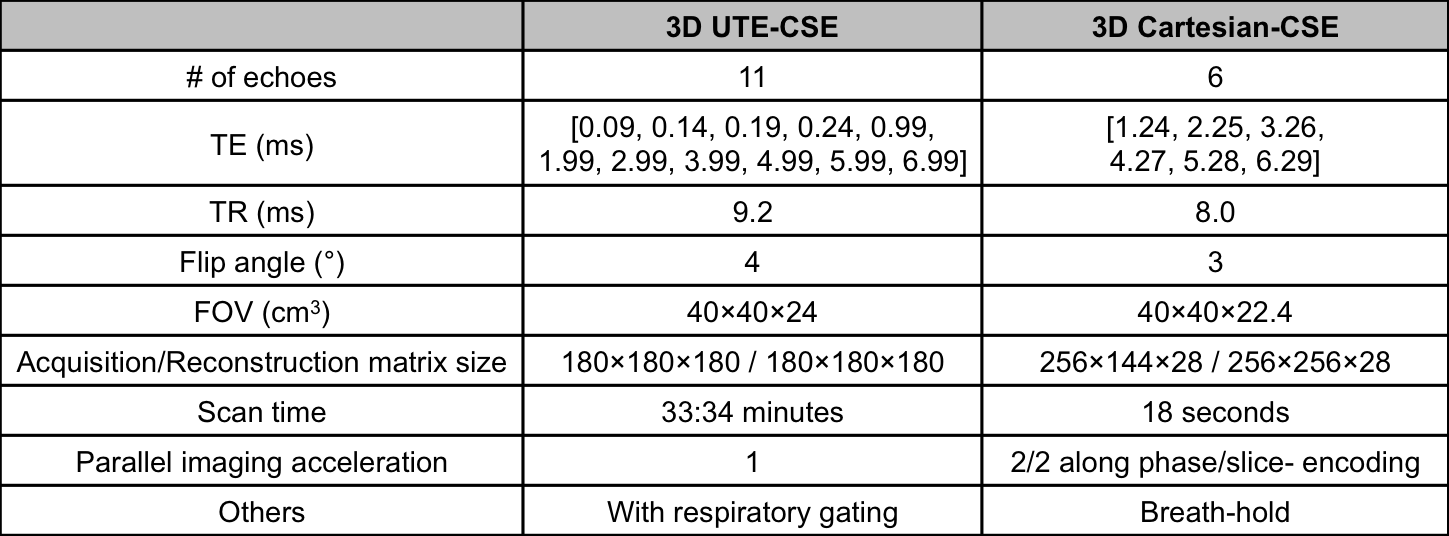
Imaging protocol: A radial 3D UTE-CSE acquisition technique with eleven TEs was developed. Using Cramer-Rao bound analysis, initial estimates of the short-T2* and known MR properties of water and fat in the liver, the TE combination was optimized, resulting in four ultrashort TEs (< 0.25ms) for the detection of the short-T2* signals, and seven TEs (> 1ms) for the detection of the long-T2* water and fat signals. Additionally, a 3D Cartesian-CSE acquisition was also included in each scan for conventional water, fat and R2* mapping in the liver. Details on the scan parameters are listed in Table 1.
Image reconstruction: A multi-component signal model (as shown in Equation 1) was used in the reconstruction of the UTE-CSE data, including the signal and R2* of the short-T2* signal component (ρs, R2_s*) and the water and multipeak fat (ρw, ρf with six fat peaks2, R2*), the initial phase (Φ0) and the B0 field (fB).
$$$S_{Liver}=\rho_se^{-R_{2\_s}^*\cdot{TE}}e^{j(\phi_0+2\pi f_B\cdot{TE})}+\Big(\rho_w+\rho_f\sum_{p=1}^P\alpha_pe^{j2\pi{\Delta}{f_p}\cdot{TE}}\Big)e^{-R_2^*\cdot{TE}}e^{j(\phi_0+2\pi f_B\cdot{TE})}[1]$$$
Data analysis: In UTE-CSE images, signals at each echo were measured over a ~3.5cm2 circular region-of-interest (ROI) in the right lobe of the liver while avoiding large vessels and bile ducts. Nonlinear least-squares fitting was applied in the magnitude signal to estimate the various signal components in Equation 13. The fraction of each liver component was calculated by dividing its proton signal by the total proton signal. In Cartesian images, a model including only water and fat4 was used.
Results
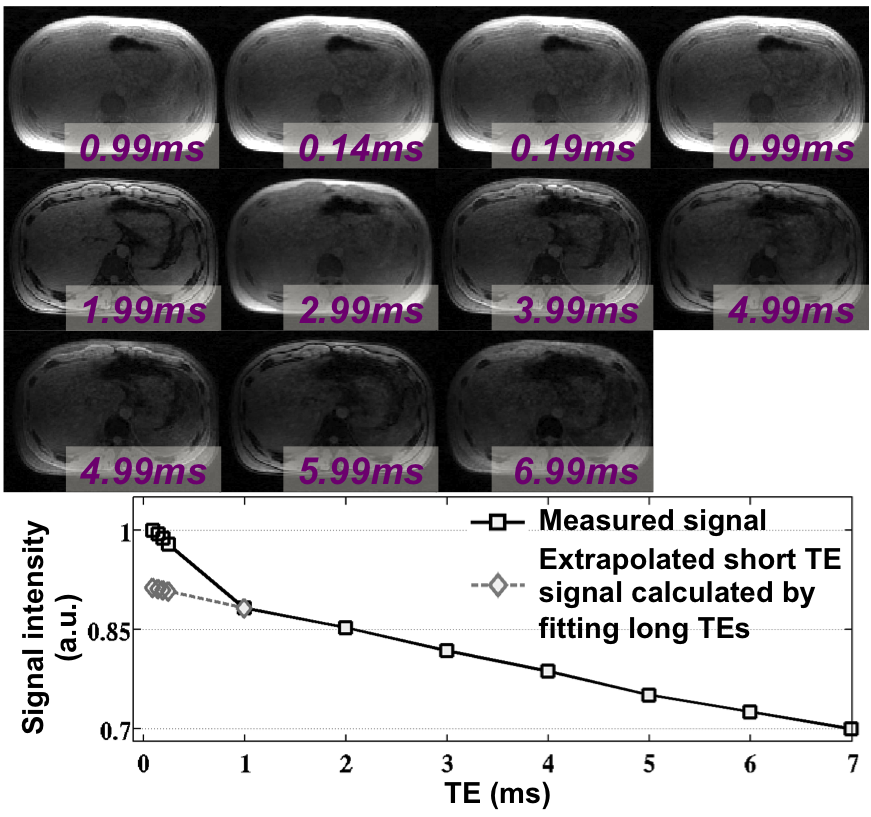
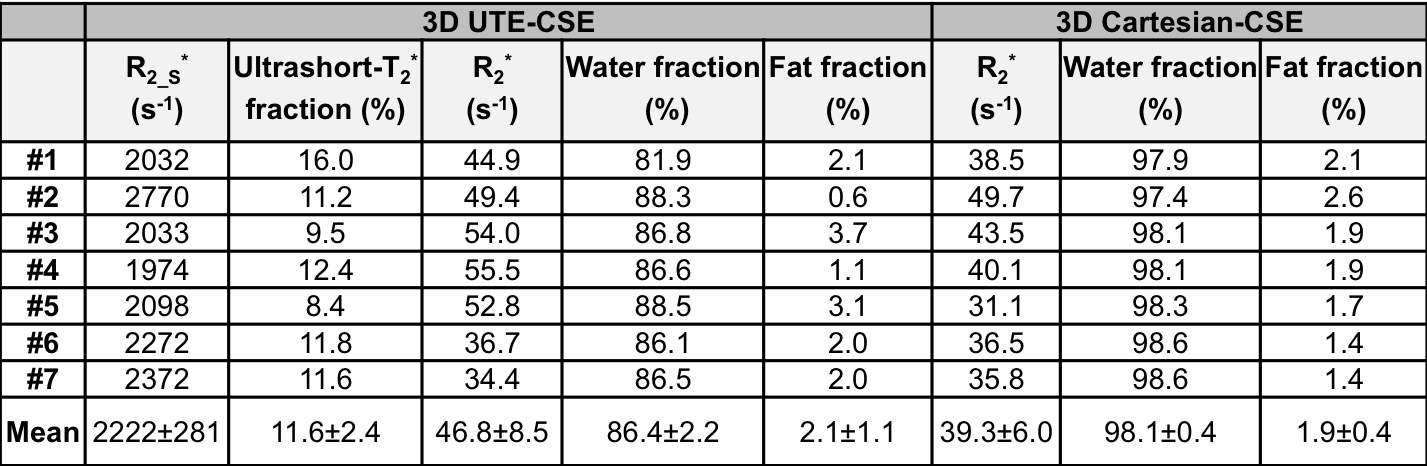
The UTE-CSE images and the signal intensity from the liver of one volunteer are shown in Figure 1. The short-T2* signals, as well as the long-T2* water and fat signals, were captured at the optimized TEs. The estimated three liver components from UTE-CSE signals and the estimated R2* and the water and fat from Cartesian-CSE images are listed in Table 2. The short-T2* signal fraction and R2* were consistent across all subjects with values of 11.6±2.4% and 2222±281s-1 respectively. UTE-CSE based R2* measurements of the water and fat signals with mean 46.8±8.5s-1 are in good agreement with the Cartesian-CSE based R2* measurements with mean 39.3±6.0s-1, which demonstrated the accuracy of quantifying the water and fat in the proposed UTE-CSE acquisition, besides quantifying the short-T2* signals.Discussions and Conclusions
This pilot study demonstrates the presence of a short-T2* signal component in the liver, and quantified this signal component using a radial 3D UTE-CSE acquisition in healthy volunteers. If unaccounted, this signal component will introduce bias and impact reproducibility of CSE fat quantification. For example, using the measured signal features in the Cartesian-CSE technique with a minimum echo time of 0.7ms will introduce a bias of approximately 0.6-2.6% in fat fraction measurements1. The origin of this short-T2* signal component and its characteristics in disease remain unknown. Quantification of this short-T2* signal component may have applications in the assessment of diffuse liver disease, e.g. for quantification of diffuse fibrosis5.
This study has several limitations. The images were slightly T1-weighted such that a signal fraction was measured in this study, rather than a proton density fraction. Therefore, the signal fraction may be affected by scan parameters such as TR and flip angle. Also, while the current acquisition with single-echo per TR minimizes confounding effects from eddy currents and flow, the ~30min scan time limits its application in clinic or in large-scale studies. Therefore, a rapid multi-echo acquisition would be highly desirable.
Further, we assumed a short-T2* model with a single exponentially decaying signal component. However, the true underlying signal characteristics of this component remain unknown. Further optimization of the acquisition and reconstruction, and characterization of the short-T2* signal component is needed.
Acknowledgements
The authors acknowledge the support of the NIH (grants R01-DK088925, R01-DK100651, R01-DK096169 and K24-DK102595), as well as GE Healthcare for their support.References
1. Hernando D, et al. Bias in liver fat quantification using chemical shift-encoded techniques with short echo times. In Proceedings of the 23nd Annual Meeting of the International Society of Magnetic Resonance in Medicine, Toronto, Canada 2015.
2. Hamilton G, et al. In vivo characterization of the liver fat 1H MR spectrum. NMR Biomed. 2011; 24(7):784-90.
3. Hernando D, et al. Chemical shift-based water/fat separation: a comparison of signal models. Magn Reson Med. 2010; 64:811-822.
4. Yu H, et al. Multiecho reconstruction for simultaneous water-fat decomposition and T2* estimation. J Magn Reson Imaging. 2007; 26:1153-1161.
5. de Jong S, et al. Direct detection of myocardial fibrosis by MRI. J Mol Cell Cardiol. 2011; 51(6):974-979.
Figures