0118
Respiratory $$$\alpha$$$-mapping of cystic fibrosis at 1.5T1Department of Radiology, Division of Radiological Physics, University of Basel Hospital, Basel, Switzerland, 2Department of Biomedical Engineering, University of Basel, Basel, Switzerland, 3Division of Respiratory Medicine, Department of Pediatrics, University Children's Hospital of Bern, Bern, Switzerland, 4University Institute for Diagnostic, Interventional and Pediatric Radiology, Bern University Hospital, Bern, Switzerland, 5Department of Pediatric Pneumology, University Children's Hospital Basel, Basel, Switzerland
Synopsis
Respiratory $$$\alpha$$$-mapping is based on native 1H multi-volumetric ultra-fast balanced steady-state free precession (ufSSFP) breath-hold imaging of the lung and provides whole lung isotropic pulmonary ventilation-related information. In this work, respiratory $$$\alpha$$$-mapping is evaluated in pediatric patients with cystic fibrosis (CF) and compared to functional lung parameters from nitrogen multiple-breath washout (N2-MBW). The percentage of respiratory $$$\alpha$$$-impairments measured with $$$\alpha$$$-mapping is strongly correlated with the lung clearance index (LCI), a parameter for global ventilation inhomogeneity.
Purpose
To evaluate 3D respiratory $$$\alpha$$$-mapping, a new method for native whole-lung pulmonary functional imaging at 1.5T derived from 1H multi-volumetric ultra-fast balanced steady-state free precession (ufSSFP) breath-hold scans1,2, in pediatric patients with cystic fibrosis (CF) in comparison to functional parameters derived from nitrogen multiple-breath washout (N2-MBW).
Materials and Methods
Theory
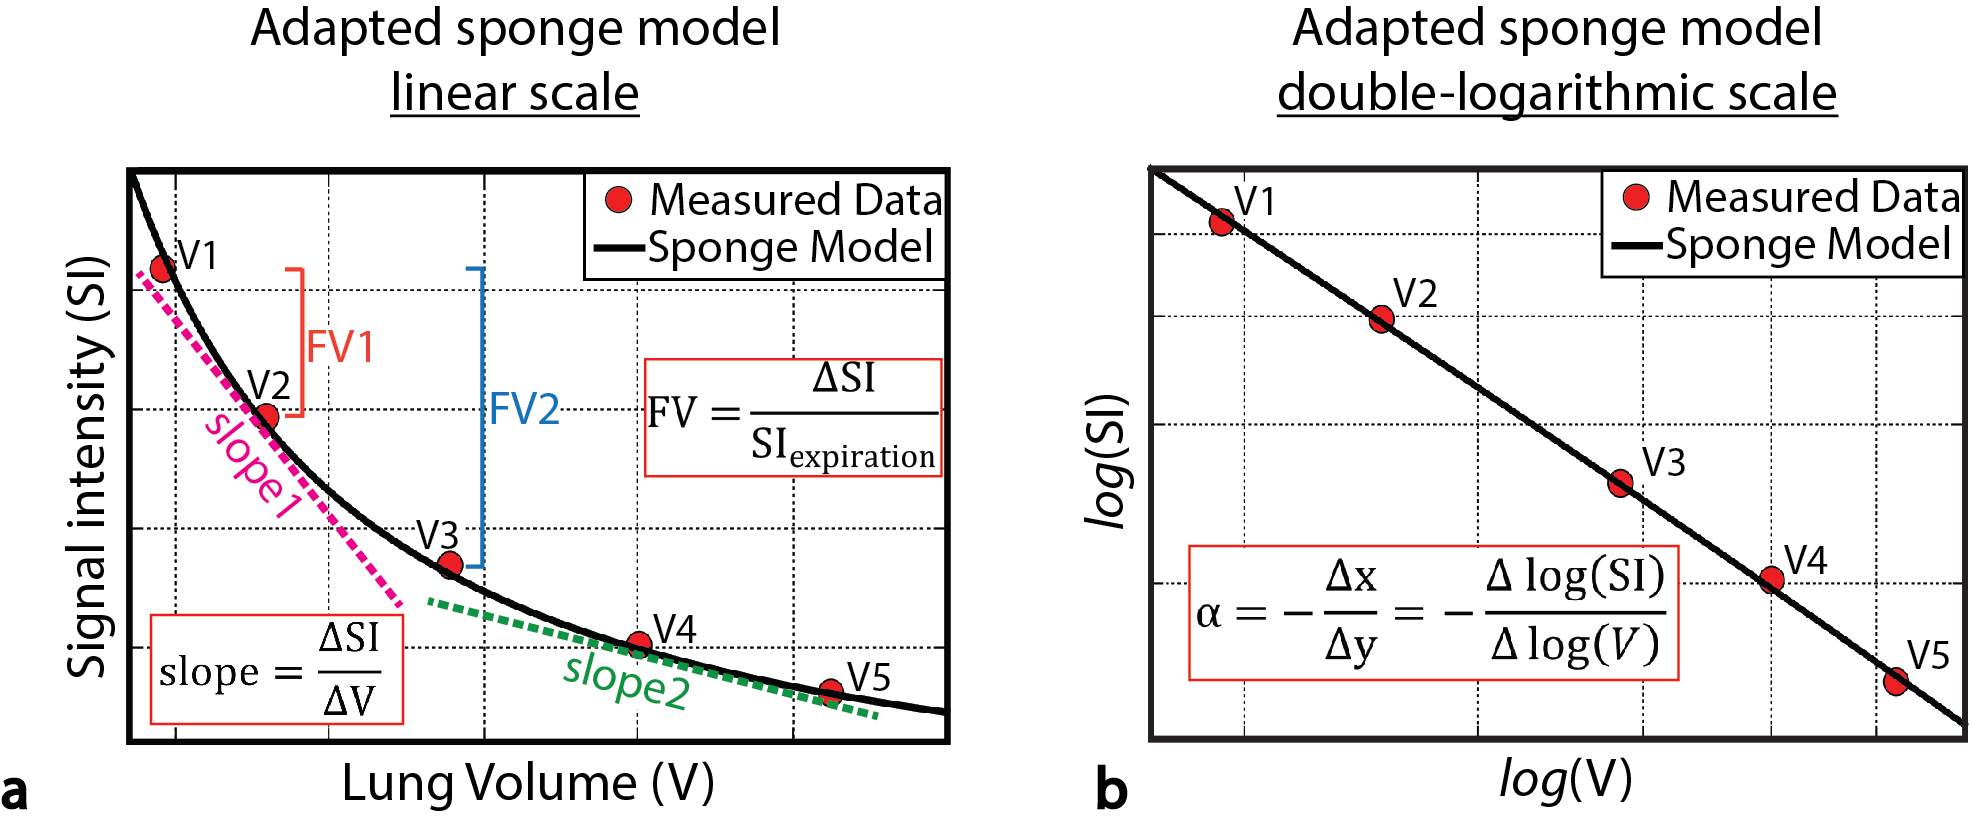
At every breath the lung tissue undergoes compression/expansion and its physical mass density varies ($$$\rho=\frac{M}{V}$$$). The observed ufSSFP signal intensity variation at diverse inspiratory volumes (Fig. 1) is in excellent agreement with the adapted sponge model1, predicting, similar to physical mass density ($$$\rho=\frac{M}{V}$$$), the signal intensity (SI) to scale inversely proportional to the lung volume V:
$$\textrm{SI}\left(V,\vec{x}\right)=\Lambda\left(\vec{x}\right){\cdot}V^{\alpha\left(\vec{x}\right)}+\eta\left(\vec{x}\right)\quad\Rightarrow\quad\alpha\left(\vec{x}\right)=-\frac{\partial\log\left(\textrm{SI}\left(V,\vec{x}\right)\right)}{\partial\log\left(V\right)}\quad[1] $$
where $$$\vec{x}$$$ is the position of a voxel, $$$\Lambda\left(\vec{x}\right)$$$ is a SI scaling factor, $$$ \eta \left ( \vec{x} \right )$$$ the SI in the limit of infinite volume, i.e. noise, and $$$\alpha\left(\vec{x}\right)$$$ maps lung expansion during breathing, referred to as respiratory $$$\alpha$$$-index1. The index $$$\alpha$$$ reflects a ventilation-weighted pulmonary measure (the acronym “$$$\alpha$$$” was chosen after Aeolus, mythical divinity, ruler of the winds!) and is virtually independent from regional lung density, as well as from the inspiratory phase and breathing amplitude (cf. Fig. 1b). From the model, a value $$$\alpha\left(\vec{x}\right)=1$$$ indicates that a region-of-interest (ROI) expands equally to the whole lung mean expansion, whereas $$$\alpha\left(\vec{x}\right)<1$$$ indicates that the ROI expands less [for $$$\alpha\left(\vec{x}\right)>1$$$, more] than the whole lung mean expansion. Generally, functionally impaired under-ventilated lung regions have low respiratory α-values (e.g. $$$\alpha<0.3-0.5$$$).
Subjects and measurement protocol
Respiratory α-mapping was evaluated in 24 pediatric patients with CF [13±3 years, range 6-17 years] and compared to the lung clearance
index (LCI) from N2-MBW measurements, acquired at the same day. This
prospective study was approved by the local Ethics Committee and all
participants/legal guardian provided informed consent.
Multi-volumetric ufSSFP scans of the lung were
performed in breath-hold (< 12 sec) and in supine position at 1.5T (Aera,
Siemens Healthineers).
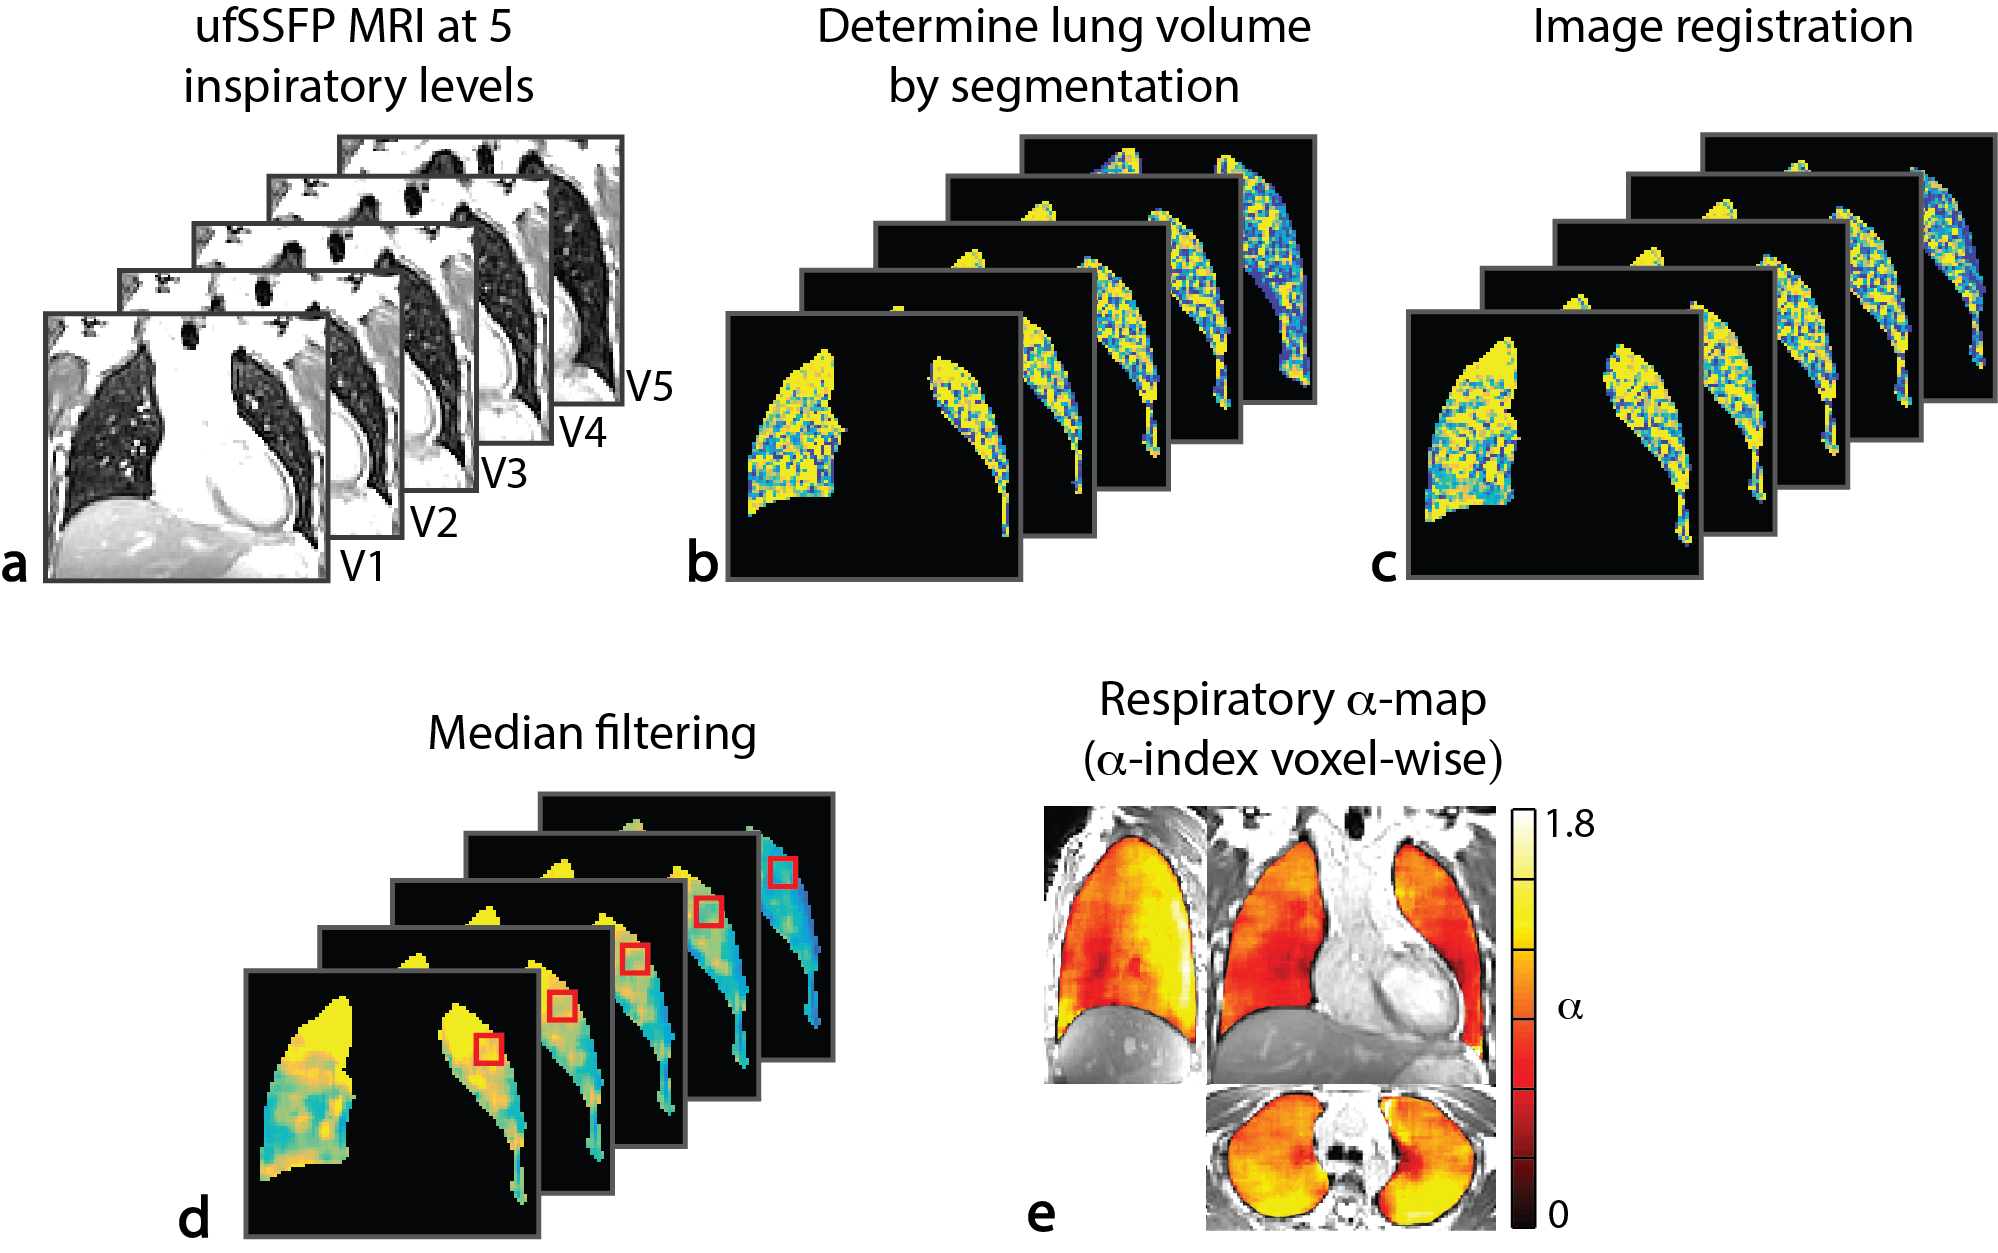
Scanning was repeated at five breath-holding positions comprised in the
tidal respiratory region (Fig. 1a) with an isotropic resolution of 3.1 mm, a TE/TR
= 0.47/1.19 ms, and a flip angle of 19º [see Ref. (1,2) for details]. Clinical
acquisition-time for α-mapping was
less than 3 minutes.
Image post-processing and analysis
Figure 2 summarizes the principal steps to calculate respiratory α-maps, i.e., semi-automatic segmentation of the lung volume, 3D deformable image registration (Elastix), median filtering to remove the vasculature3, and voxel-wise calculation of the respiratory α-indexes (cf. Eq. [1]) . Due to the ventral-to-dorsal respiratory-gradient characteristic e.g. in the α-maps of healthy volunteers (Fig. 2e), respiratory impairments were analyzed iso-gravitationally and automatically associated with an α-value less than 0.75 of the observed median α-value distribution in each coronal plane. From this, a respiratory percent defect ratio was calculated from the number of impaired voxels divided by the total number of voxels enclosing the whole lung.
Results
From the 24 patients enrolled in the study, breath-holding was feasible for 22, and images were artifact-free in 20 patients.
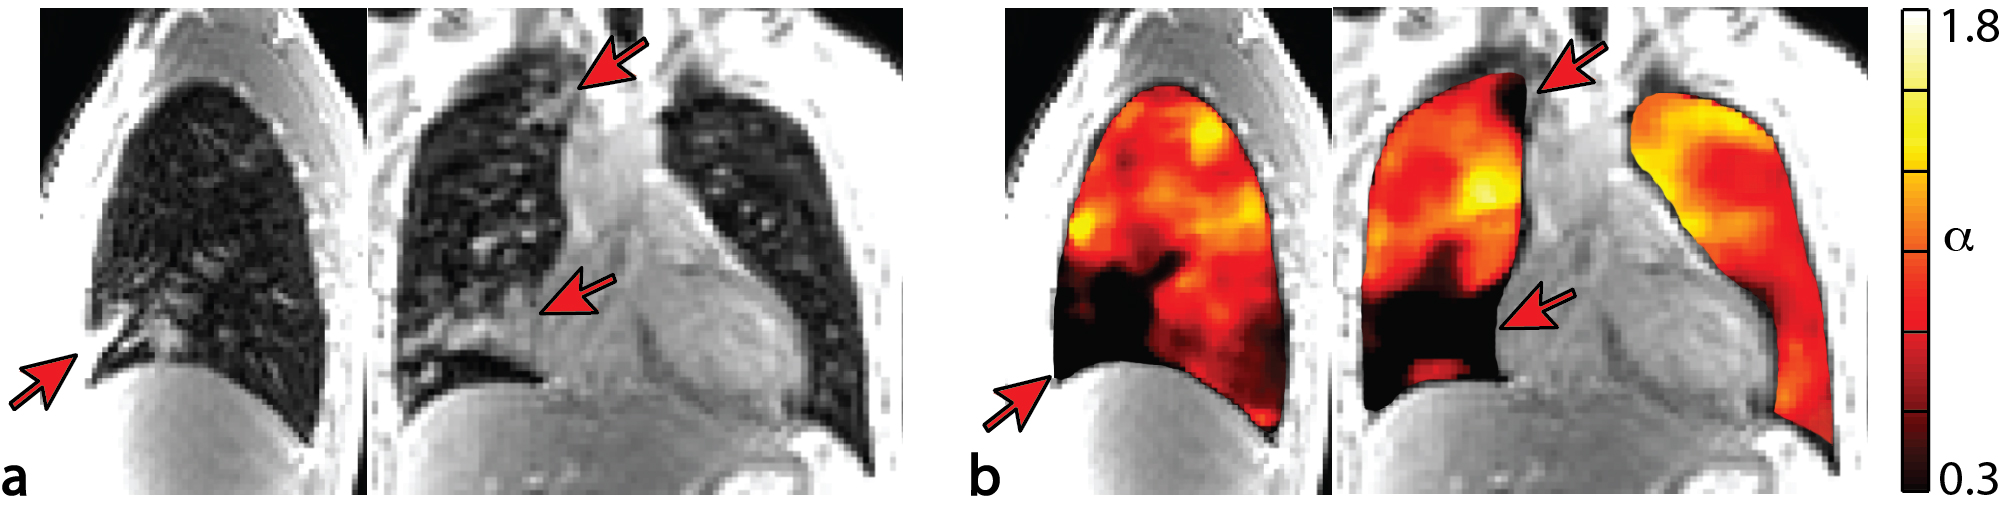
Illustrative morphological ufSSFP images and α-maps in a CF patient (15 y, male) are shown in Figure 3. In contrast to the characteristic iso-gravitational homogeneity and the physiological ventral-to-dorsal respiratory-gradient present in the α-maps of a healthy volunteer (Fig. 2e), respiratory α-maps of the CF patient (Fig. 3b) revealed under-ventilated regions. The α-impairments are mainly associated with heavily atelectatic areas of the lung in this case (Fig. 3a).
Overall, in the cohort of patients, the
percentage of respiratory α-impairments determined by α-mapping
revealed a highly significant (p-value < 10-6) and strong correlation (Spearman r=0.88)
with the LCI, as shown in Figure 4.
Discussion and Conclusions
In this work, we evaluated the recently introduced respiratory $$$\alpha$$$-mapping in a small cohort of pediatric patients with CF. Respiratory α-mapping allows
for regional respiratory assessment of the whole lung, and the percentage of automatically
detected respiratory defects showed a pronounced correlation with LCI from N2-MBW measurements.
The
index α is derived from a multi-volumetric physical compression model of lung
tissue, and since it is virtually independent from the respiratory phase (cf.
Fig 1b), the breathing amplitude and from regional lung density1,
respiratory α-mapping may serve as a
reproducible and normative measure to quantify and evaluate patho-physiological
impairments, and can be potentially used to compare measurements between different subjects and/or
changes in the disease progression, such as in CF patients.
In conclusion, respiratory $$$\alpha$$$-mapping shows good prospects as a quantitative outcome measure for monitoring respiratory impairments or to assess the effect of therapeutic or clinical interventions.
Acknowledgements
This work was supported by a grant from the Swiss National Science Foundation (Grant No. 320030_149576).References
[1] Pusterla O, Bauman G, Wielputz MO,
Nyilas S, Latzin P, Heussel CP, Bieri O. Rapid 3D in vivo 1H human lung
respiratory imaging at 1.5 T using ultra-fast balanced steady-state free
precession. Magn. Reson. Med. 2016.
[2] Bieri O. Ultra-fast steady state free precession and its application to in vivo 1H morphological and functional lung imaging at 1.5 tesla. Magn. Reson. Med. 2013;70:657–663.
[3] Bieri O. A
Method for Visualization of Parenchyma and Airspaces from 3D Ultra-Fast
Balanced SSFP Imaging of the Lung at 1.5T. In: Proc. Intl. Soc. Mag. Reson.
Med. 22; 2014. p. 2300.
Figures