0116
Feasibility of Estimating Placental Oxygen Metabolism in Pregnant Women $$$in$$$ $$$vivo$$$: Initial Experience1Department of Radiology, University of Pennsylvania, Philadelphia, PA, United States, 2Department of Obstetrics and Gynecology, Division of Maternal-Fetal Medicine, University of Pennsylvania, Philadelphia, PA, United States
Synopsis
The development of methods to assess placental oxygen metabolism would allow to clinically evaluate its function. Here, we evaluated the feasibility of estimating oxygen extraction and blood flow in some abdominal and fetal draining veins. Ovarian veins appear to play an important role in draining blood from the uterus in the supine position, where flow increased from the 2nd to 3rd trimester (16.4±8.1 versus 34.3±4.1mL/min/100g). Additionally, elevation of oxygen saturation (61.6±6.6% versus 68.3±5.0%) at the umbilical vein occurred from the 2nd to 3rd trimester, potentially reflecting increased fetal oxygen demand as pregnancy progresses.
PURPOSE
The key function of the placenta is to provide oxygen and nutrients to sustain fetal viability and growth during pregnancy. Placental dysfunction is widely accepted as a major cause of common adverse pregnancy outcomes. However, the etiology of abnormal placental development remains unknown. Therefore, the development of methods that allow assessment of placental oxygen metabolism would allow to clinically evaluate its function. The overarching goal thus would be to be able to measure the rate of O2 supplied to and extracted from both the fetus and the mother. While typically arterial blood is fully saturated, hemoglobin oxygen saturation (HbO2) must be measured in the maternal venous system draining the placenta and at the vessels of the umbilical cord, through which O2 is delivered to the fetus. In this preliminary work we attempted identify these maternal vessels and examine the feasibility of estimating placental oxygen consumption via T2-based MR oximetry and phase-contrast flow quantification.METHODS
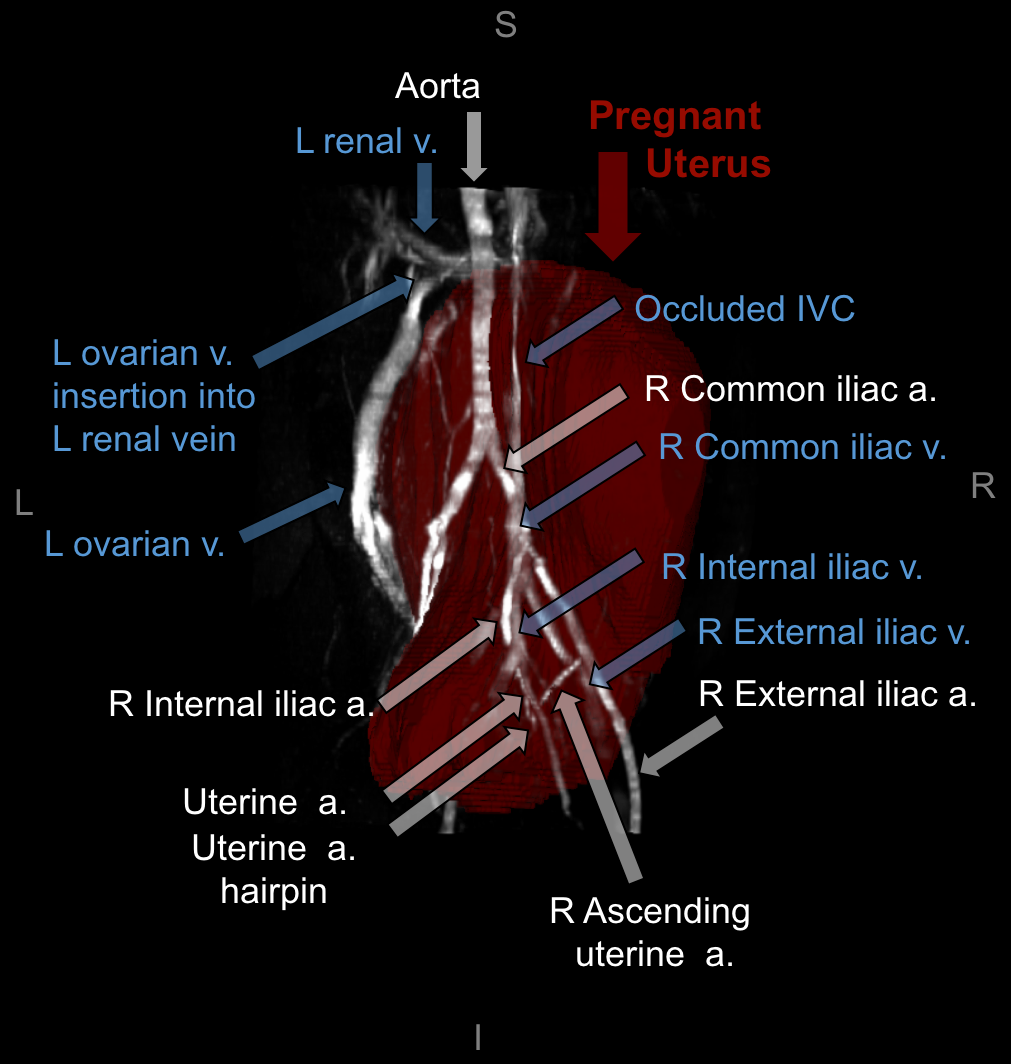
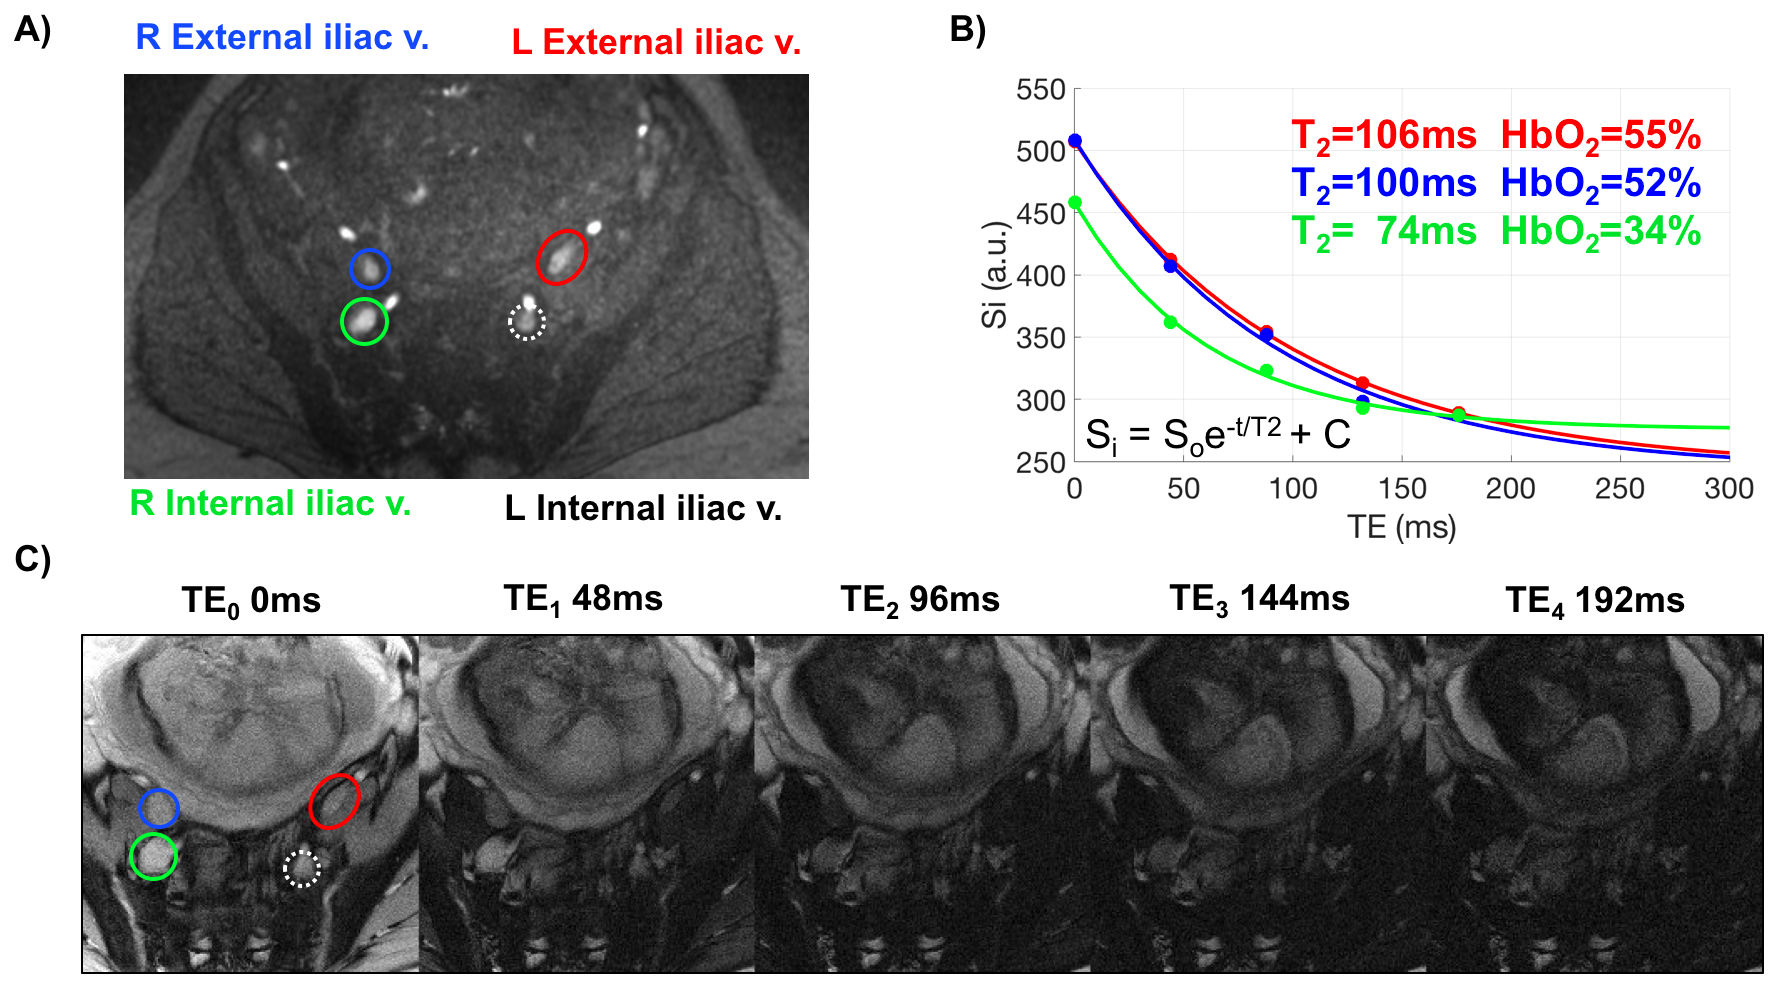
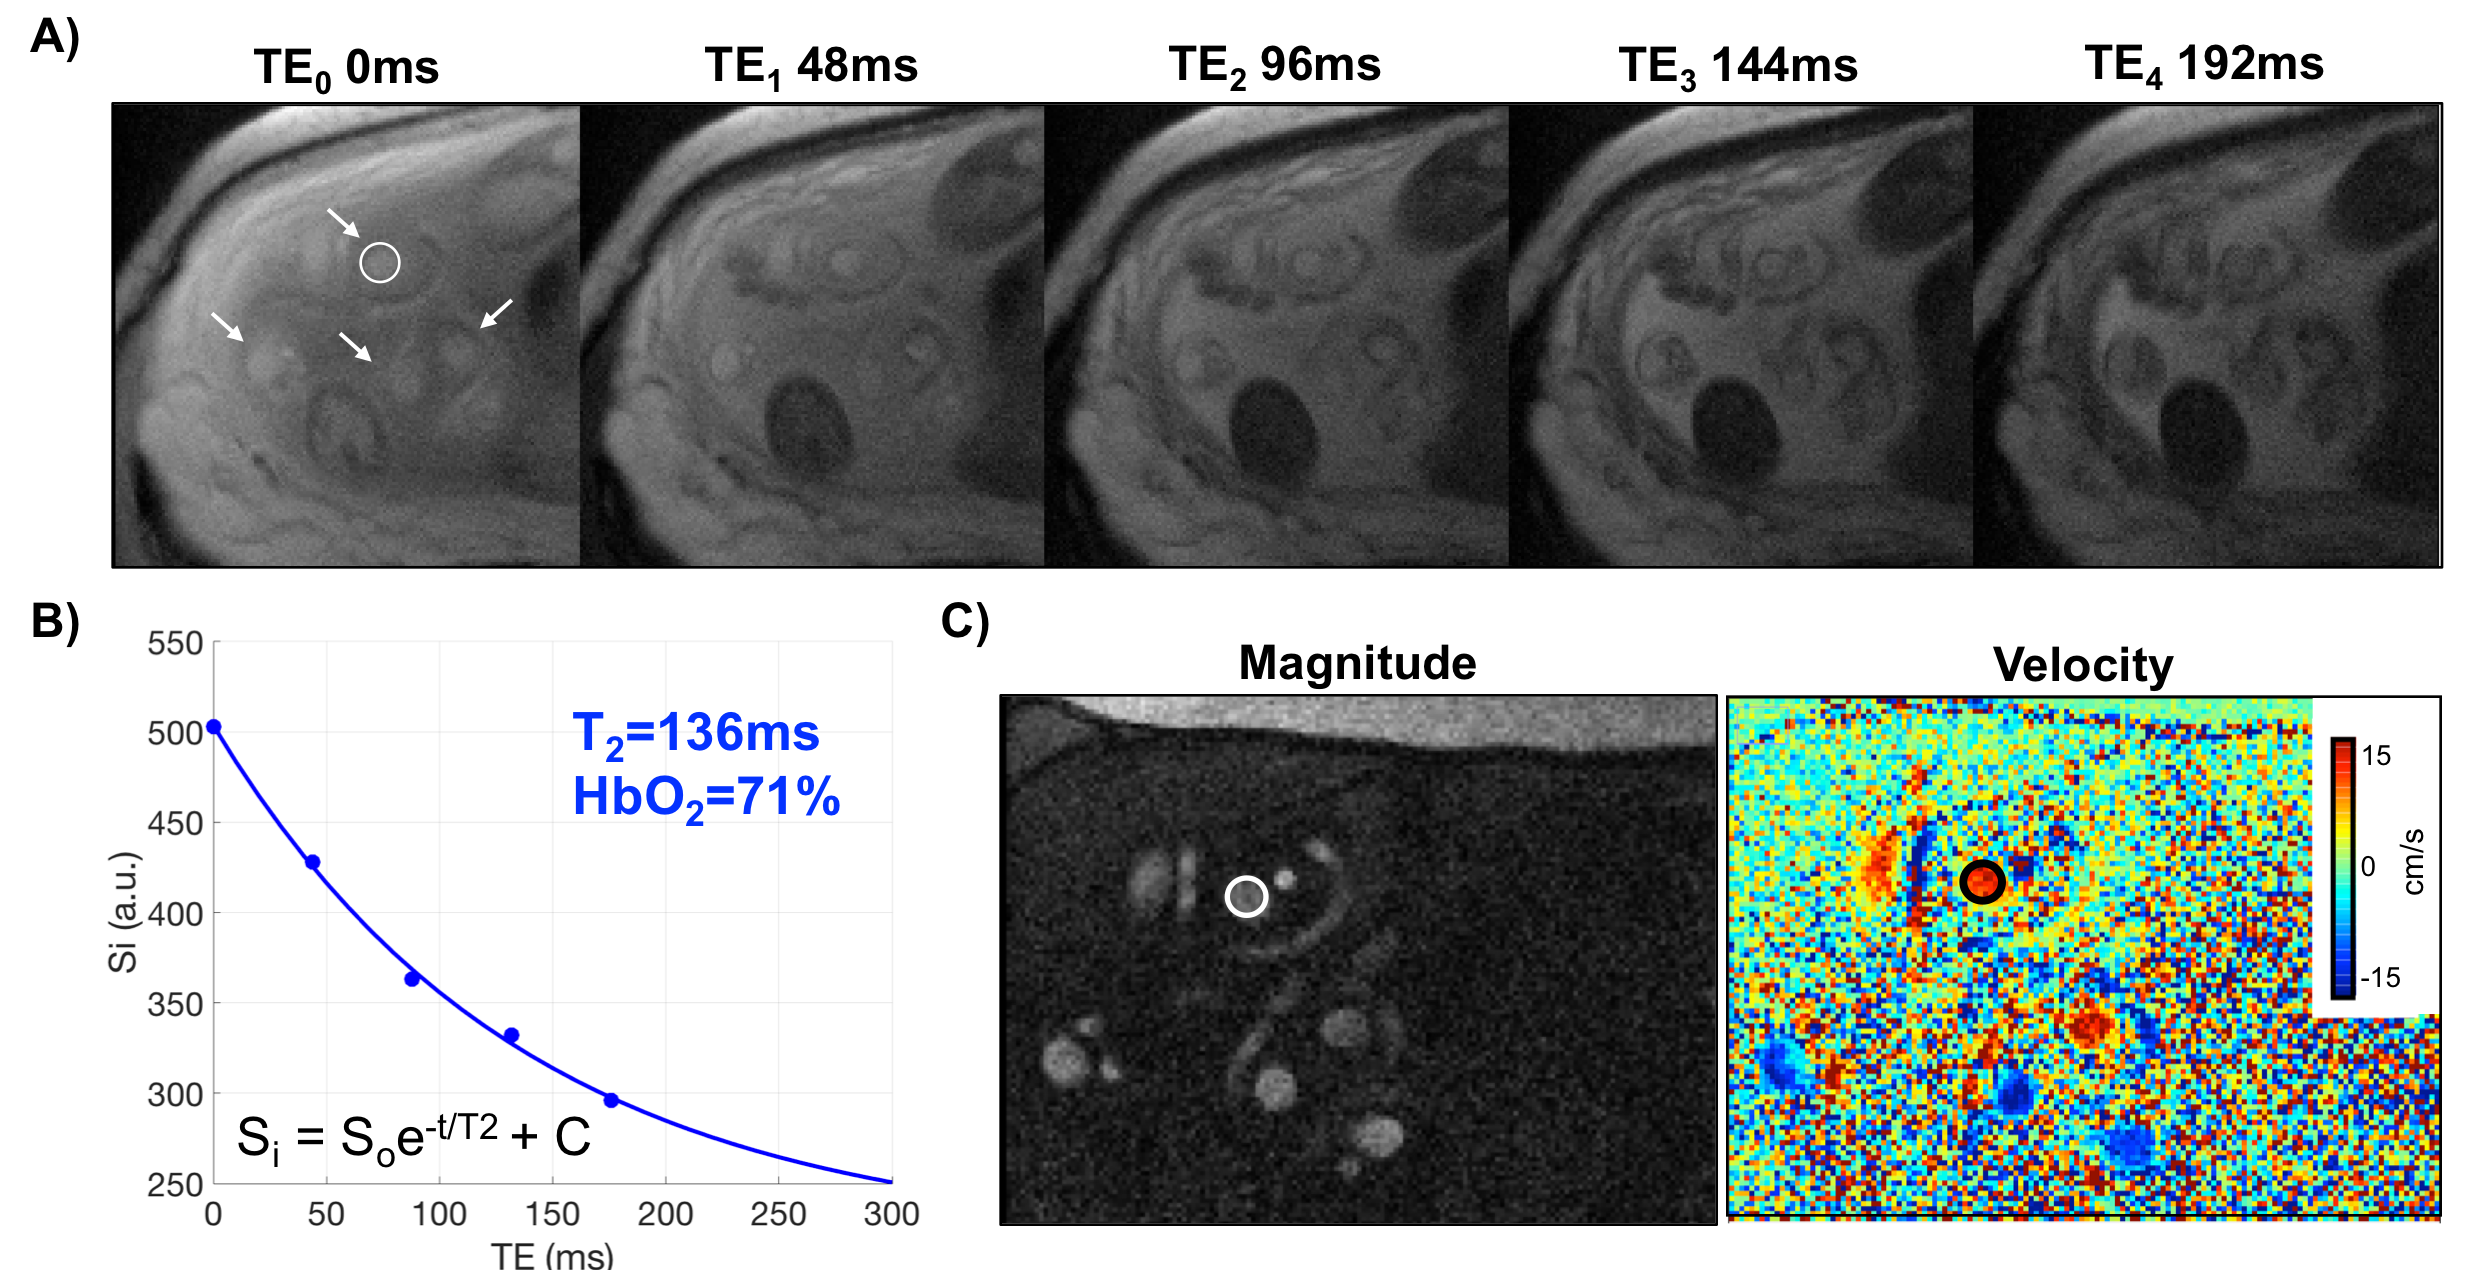
A time-of-flight scan with the following scanning parameters was acquired for slice planning: TR/TE=600/7ms, FOV=350×300mm2, voxel size=1.1×1.1×3.5mm3, FA=60° and no tracking saturation (Fig. 1). SvO2 at internal and external iliac veins (IIV and EIV) and umbilical vein (UV) was quantified in a group of pregnant women. Imaging parameters: T2-preparation, TEs=0,48,96,144,192ms, bSSFP TR/TE=4.1/2.05ms, FOV=300×300mm2, voxel size=0.8×0.8×5mm3, FA=60°, 5 averages, half-Fourier with 14 reference lines, inter-pulse interval (τ180) of 12ms and total acquisition time to collect five TEs of 20s. Additionally, TEs were corrected as the magnetization was temporarily stored along the longitudinal axis (decaying with T1) during the execution of refocusing pulses1 and a three-parameter fit was used to derive T2.2 The T2 of blood was then converted to SvO2 using the Luz-Meiboom model as described by Wright et al $$$\frac{1}{T_2}=\frac{1}{T_{2o}}+K(1-HbO_2)^2$$$.3 The parameter K is the sensitivity of the sequence to detect differences in HbO2 and T2o is the T2 of fully oxygenated blood; both depending on Bo and sequence-specific imaging parameters. K and T2o values were determined beforehand for this specific sequence. The rate of O2 supplied and extracted is quantified in units per time and mass. Therefore, volumetric blood flow rate $$$(\dot{Q})$$$ was also estimated in these vessels using phase-contrast MRI (VENC=10 to 20 cm/s, FOV=256×256mm2, voxel size=0.8×0.8×5mm3, and FA=25°). $$$\dot{Q}$$$ was normalized to expected average fetal weight according to gestational age (GA).4RESULTS
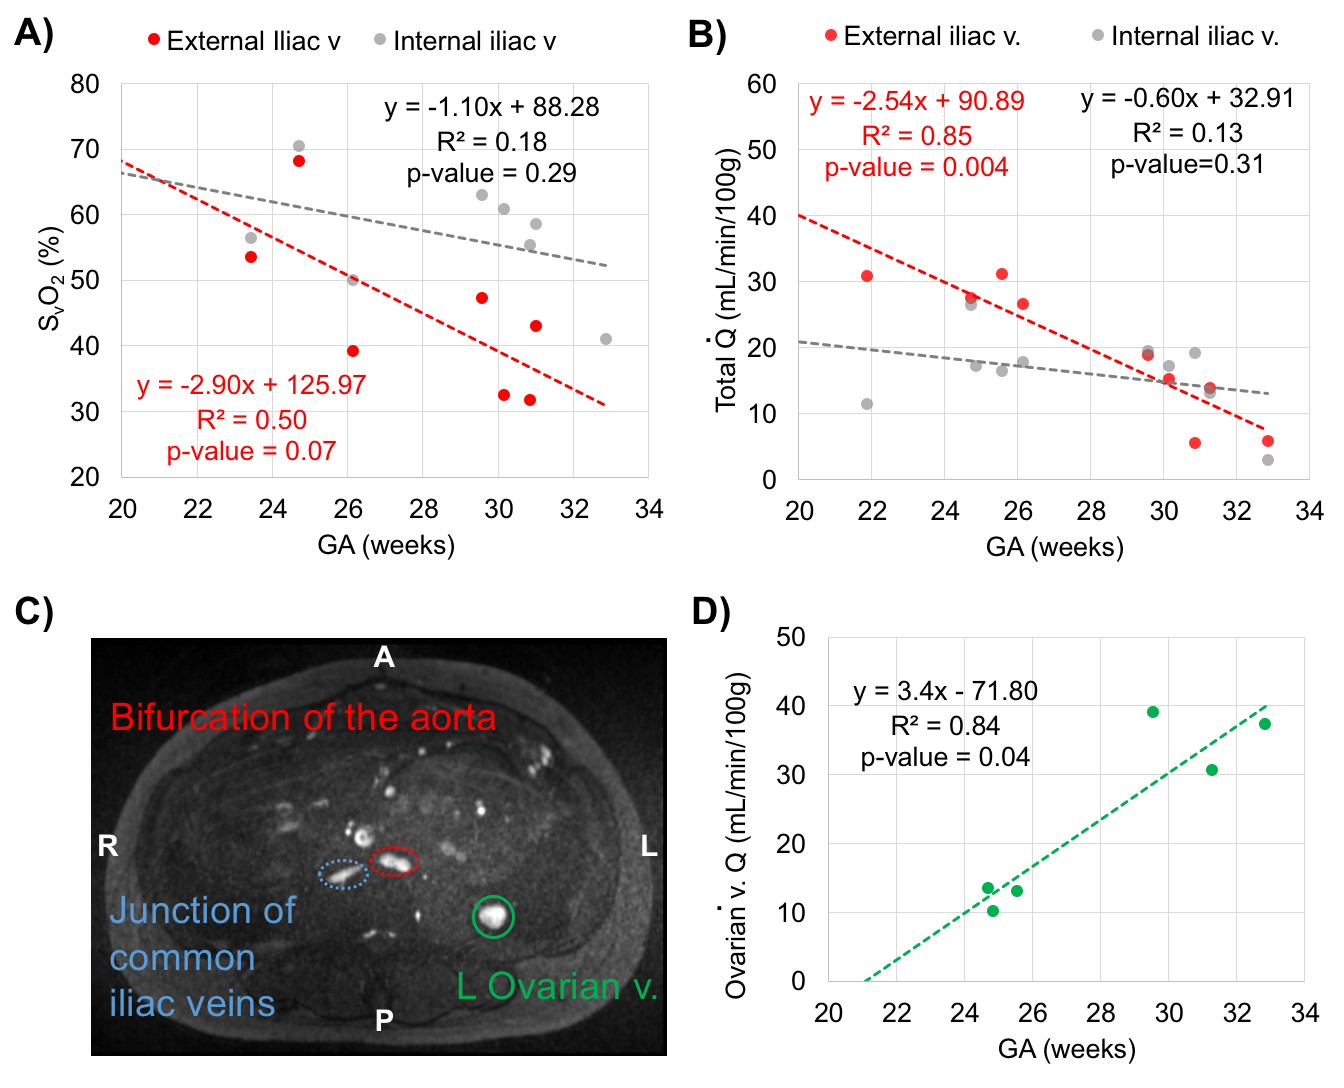
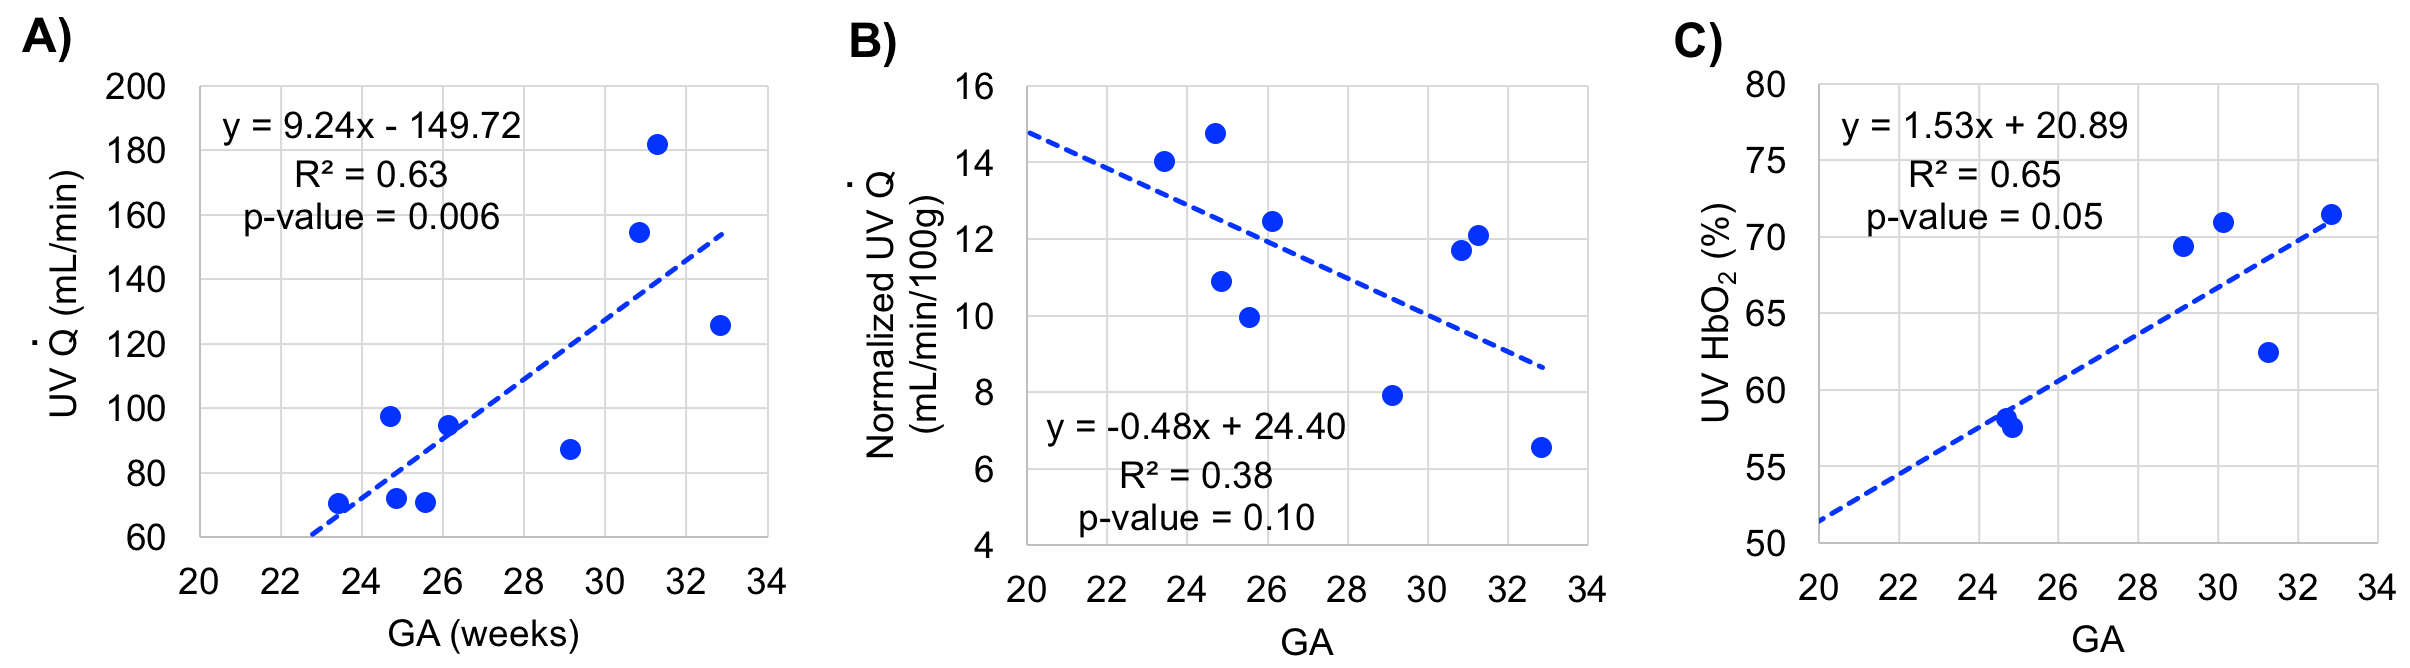
Ten women in the 2nd and 3rd trimester of pregnancy (average GA: 28.3±3.3wks, range 23-32wks) have been studied so far (1.5T Siemens Avanto). Two flexible body coils placed superiorly and inferiorly to the pregnant abdomen were used. Not all measurements were possible in every participant due to fetal motion or flow artifact from surrounding arteries (Fig. 2A, white circle). Of note is ovarian vein unilateral enlargement found in 5 participants (Figs. 1 and 3C). The values of T2o and K used were 169ms and 17.6Hz, respectively. A general trend observed is decreasing SvO2 in the EIVs (right and left R2=0.50, p=0.07) with GA; and similarly in both IIVs (Fig. 3A). Total $$$\dot{Q}$$$ in the right EIV and left IIV were found to decrease with GA (R2=0.85, p=0.004, Fig. 3B), while increasing in the ovarian veins (R2=0.84, p=0.04, Figs. 3C-D). SvO2 and $$$(\dot{Q})$$$ measurements at the UV were taken directly at the cord of fetuses of GA>30wks and in the intra-abdominal UV in those of GA<30wks (Fig. 4). $$$\dot{Q}$$$ significantly increased with GA (R2=0.72, p=0.008, Fig. 5A); however, when $$$\dot{Q}$$$ was normalized to 100g of fetal mass this relationship was reversed (Fig. 5B). Simultaneously, as pregnancy progressed, SvO2 in the UV increased (R2=0.65, p=0.05, Fig. 5C).DISCUSSION and CONCLUSIONs
Knowledge of the hemodynamic status of the pregnant utero-placental circulation is required to examine O2 metabolism of the placenta. IIV were targeted as they are known to drain the pregnant uterus and placenta. However, results presented here suggest that EIV and ovarian veins may also considerably contribute to this task. In addition, flow in the ovarian vein appears to increase in a similar manner as it is reduced in the right EIV as a function of GA. This may potentially be associated with venous occlusion in supine subject position. Although SvO2 data at the UV is limited at the moment, estimated values are in agreement with those measured with gas analyzer from blood collected from the UV after birth.5 Similarly, UV flow during the 3rd trimester was similar to that reported in fetal circulation at full term.6 These results suggest increased fetal O2 demand as pregnancy progresses. Here, we have demonstrated the feasibility of T2-based oximetry to characterize O2 metabolism in the maternal and fetal venous circulation.Acknowledgements
NIH grants U01-HD087180, RO1-HL109545, K25 HL111422.References
1. Foltz WD, Stainsby JA, Wright GA. T2 accuracy on a whole-body imager. Magn Reson Med. 1997;38:759-68.
2. Akçakaya M, Basha TA, Weingärtner S, Roujol S, Berg S, Nezafat R. Improved quantitative myocardial T2 mapping: impact of the fitting model. Magn Reson Med. 2015;74:93-105.
3. Wright G, Hu B, Macovski A. Estimating oxygen saturation of blood in vivo with MR imaging at 1.5T. Magn Reson Med. 1991;1:275-83.
4. Archie JG, Collins JS, Lebel RR. Quantitative standards for fetal and neonatal autopsy. Anatomic Pathology. 2008;126:256-65.
5. Richardson B, Nodwell A, Webster K, Alshimmiri M., Gagnon R, Natale R. Fetal oxygen saturation and fractional extraction at birth and the relationship to measures of acidosis. Am J Obstet Gynecol. 1998;178:572-79.
6. Sun L, Macgowan CK, Sled JG, Yoo SJ, Manlhiot C, Porayette P, Grosse-Wortmann L, Jaeggi E, McCrindle BW, Kingdom J, Hickey E, Miller S, Seed M. Reduced fetal cerebral oxygen consumption is associated with smaller brain size in fetuses with congenital heart disease. Circulation. 2015;131:1313-23.
Figures