0115
Development of a Noninvasive Beta Cell Functional Assay Using a Novel Zinc-Sensitive MRI Contrast Agent in Non-Human Primates1Translational Imaging Biomarkers, Merck Research Laboratories, West Point, PA, United States, 2Advanced Imaging Research Center, The University of Texas Southwestern Medical Center, Dallas, TX, United States, 3Radiology, The University of Texas Southwestern Medical Center, Dallas, TX, United States, 4Pharmacology, Merck Research Laboratories, West Point, PA, United States, 5VitalQuan, LLC, Dallas, TX, United States, 6Translational Biomarkers, Merck Research Laboratories, West Point, PA, United States, 7Chemistry, The University of Texas at Dallas, Richardson, United States
Synopsis
Pancreatic beta cells secrete insulin to maintain normal blood glucose levels, and the integrity and function of pancreatic beta cells have been found to be compromised in Type-1 and Type-2 diabetes. Therefore, non-invasive beta cell function measurements may provide valuable information for improving diabetes diagnostics and disease management. Currently available diabetes assays lack functional information and spatial identification of properly functioning beta cells. In this work, we introduce a new assay to assess the function and identify functional beta cells in vivo in the non-human primate pancreas non-invasively with MRI using a Gd-based zinc sensor as contrast agent.
Purpose
Beta cells found in islets of the pancreas manufacture, store and release insulin in response in to an increase in blood glucose. Given the importance of maintaining systemic glucose in a narrowly regulated range, beta cell function is key to understanding the development of both Type 1 and Type 2 diabetes mellitus. A novel MRI contrast agent that binds to zinc and albumin, CP027, results in a chelate that increases in relaxivity only in the presence of zinc has previously been used to image beta cell function1,2 by detecting release of zinc ions from the mouse pancreas during insulin secretion.The purpose of this work is to image co-release of Zn and insulin from the pancreas of non-human primates stimuated by an increase in blood glucose in order to develop a non-invasive beta cell function assay.Methods
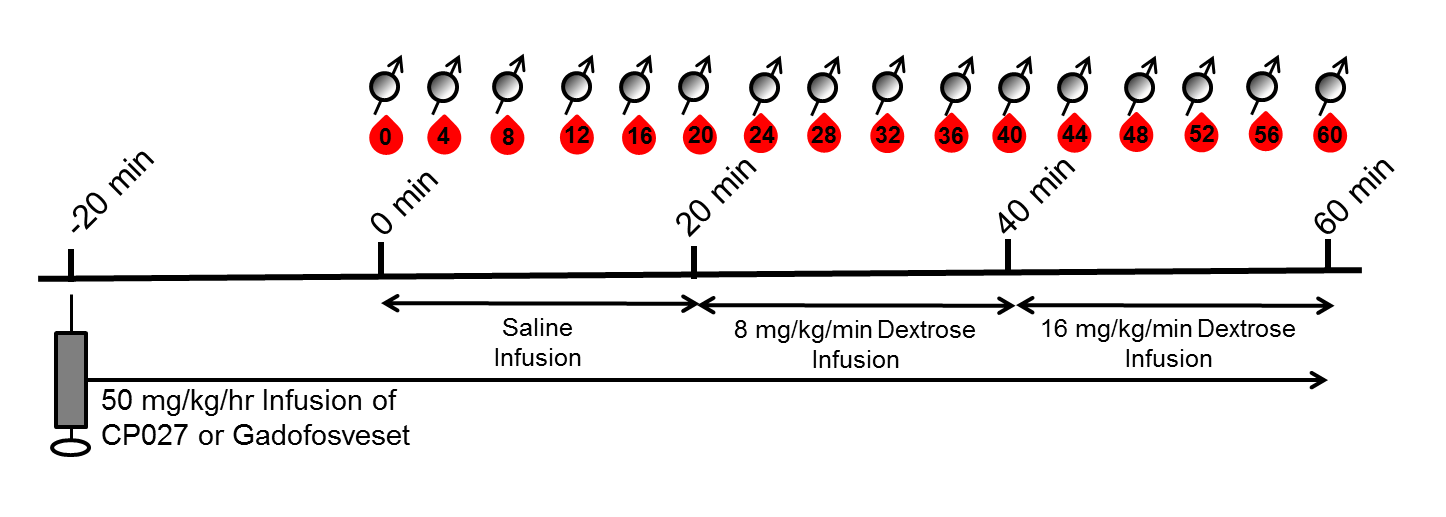
Adult, healthy male and female (n = 2 each) rhesus macaques underwent a contrast-enhanced exam at 3T using a four-channel body coil using an altered Graded Glucose Injection (GGI) paradigm (Fig. 1) to challenge the pancreas to produce insulin. CP027 was administered during Study 1, and gadofosveset trisodium, a comparator agent with similar albumin binding and relaxivity, was administered 3 weeks later using the identical paradigm during Study 2. Blood samples were acquired every 4 minutes for whole blood glucose, plasma insulin, and C-peptide levels. Breath-held MRI of the pancreas was acquired using a T1W 3D gradient echo sequence on the anesthetized animals with simultaneous blood sampling.
“Hotspots”, or small, focal areas of signal enhancement identified on the CP027 exams, which were predominantly found in the pancreas tail region, were measured (n ≥ 4), averaged, and matched as best as possible to the same pancreas anatomy for the gadofosveset exams; the pancreas routinely moved within and between studies. Similarly sized ROIs on the same imaging slice adjacent to the identified hotspots were also measured for both studies to compare with the hotspots (“within-slice comparator ROIs”). All ROIs were normalized to the muscle signal to account for the continuous infusion of contrast agent. Normalized percent signal enhancement over time from 0 min for each agent was then compared to dynamic glucose, insulin, and C-peptide levels.
Results
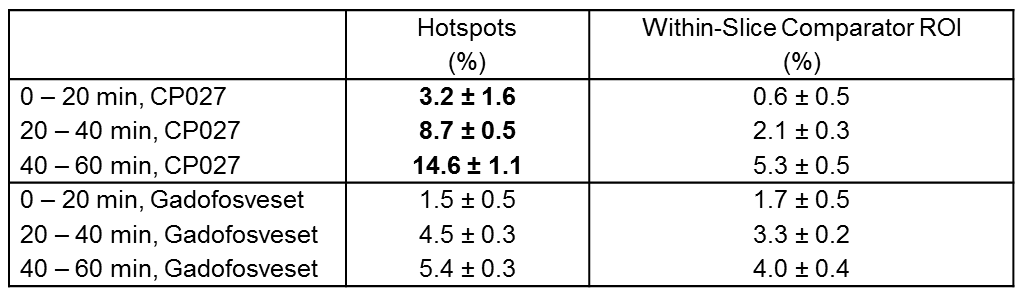
Figure 2 displays a CP027 hotspot in one animal at 60 min, demonstrating increasing intensity throughout the dextrose infusion, alongside its within-slice comparator ROI showing less enhancement. Less enhancement in the anatomically matched ROI at Study 2 using gadofosveset and its within-slice comparator ROI are seen. Furthermore, Table 1 displays the percent change for each 20 min interval for all hotspots and within-slice comparator ROIs across all animals. Of note, the signal intensity in the hotspots approximately doubles between 20-40 min and 40-60 min, an expected pattern due to the doubled dextrose infusion. This pattern cannot be identified when using gadofosveset or in the comparator ROIs. Thus, enhancement in the presence of CP027 was seen in the hotspots are consistent with the focal nature of insulin release3.
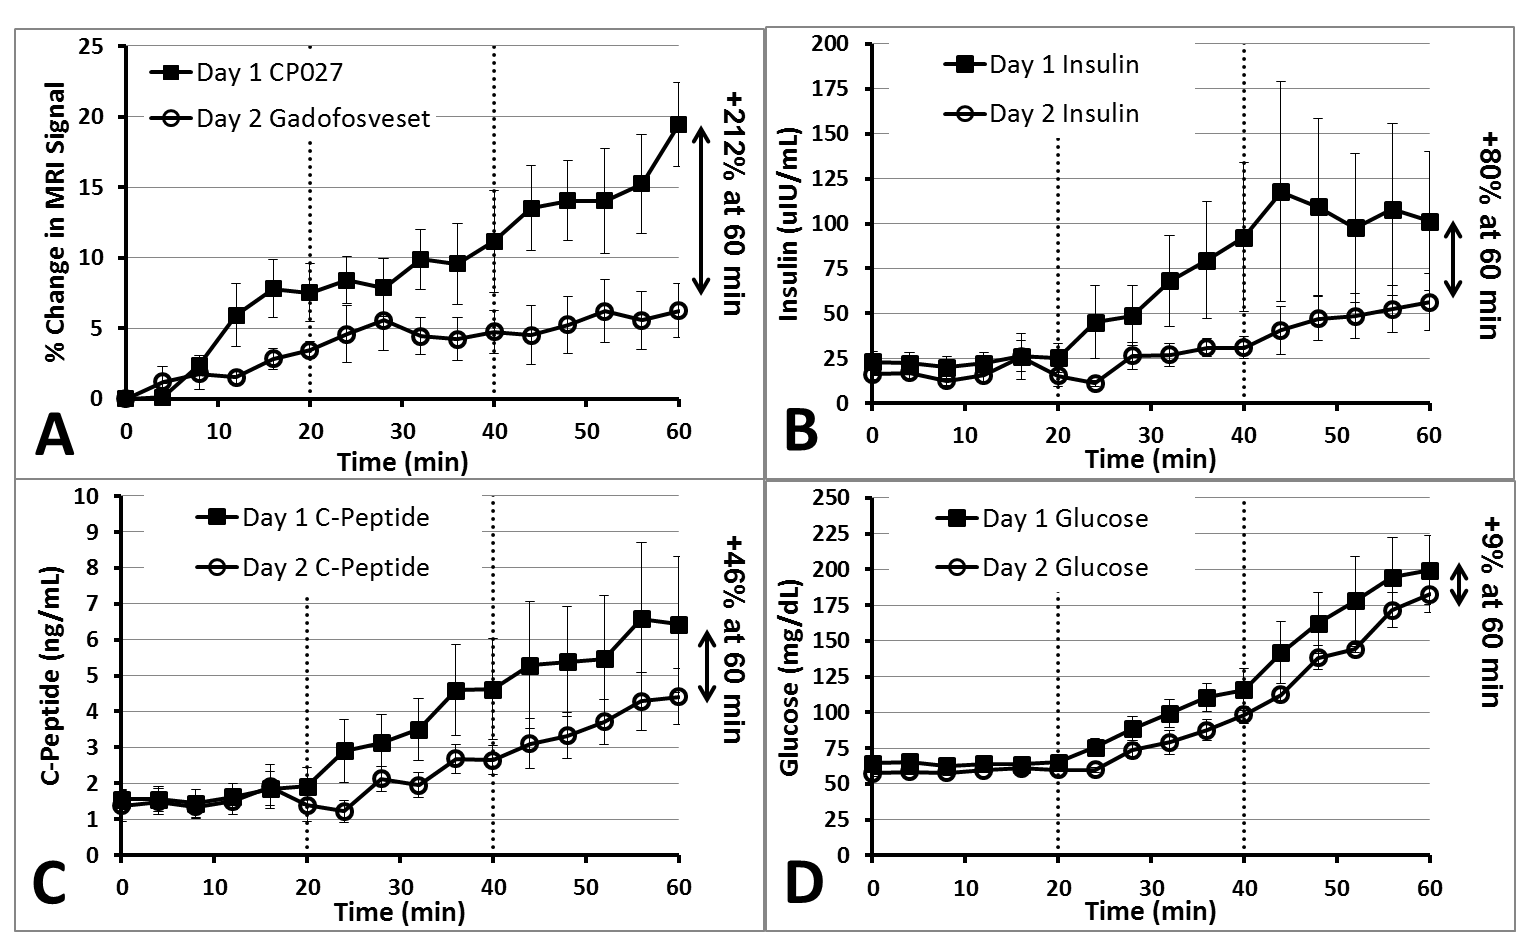
Figure 3 compares the behavior of CP027 and gadofosveset across all animals on Day 1 and 2, respectively, alongside C-peptide and insulin levels. While the production of insulin and C-peptide was greater on Day 1 than Day 2 (Day 1 at 60 min showed +80% and +46%, resp., compared to Day 2 at 60 min), the hotspot enhancement surpassed this difference (+212% compared to Day 2 at 60 min) demonstrating that gadofosveset does not offer functional beta cell information, assuming the same relationship between insulin and C-peptide changes and signal enhancement for both contrast agents.
Discussions and Conclusions
This work has shown the response of CP027 to the co-release of insulin-zinc, and potential focal behavior of insulin release was observed in the tail-dominated hotspots; greater enhancement was expected in the tail due to the approximate doubling of beta cell density in this region4. These results are promising given the small sample size and known high variability of diabetes-related assays5. Interestingly, the signal increase was greater during 0-20 min for CP027 than gadofosveset, which may be due to differences in relaxivity and/or pharmacokinetics of the agents; these properties have yet to be determined. Also, the consistently increased insulin and C-peptide secretion for the CP027-infused animals raises questions regarding zinc hemostasis in the pancreas. As CP027 binds to zinc with high affinity (Kd = ~12nM), it may truncate normal zinc re-absorption within the pancreas. Further investigation and validation will involve the interplay between CP027, insulin secretion and zinc homeostasis, and the specificity of the assay.Acknowledgements
This work was supported in part by NIH DK-095416 and ADA 7-12-IN-42.References
1. Yu J, Martins AF, Preihs C, et al. Amplifying the Sensitivity of Zinc(II) Responsive MRI Contrast Agents by Altering Water Exchange Rates. J. Am. Chem. Soc., 2015, 137 (44): 14173–14179.
2. Lubag, AJ, De Leon-Rodriguez LM, Burgess SC, et al. Non Invasive MRI of β-cell function using a Zn2+- responsive contrast agent. Proc. Nat. Acad. Of Sci., 2011 108 (45): 18400–18405
3. Li D, Chen S, Bellomo EA, et al. Imaging dynamic insulin release using a fluroescent zinc indicator for monitoring induced exocytotic release (ZIMIR). Proc. Nat. Acad. Of Sci., 2011 108 (52): 21063-21068.
4.Wang, X, Misawa R, Zielinski MC, et al. Regional Differences in Islet Distribution in the Human Pancreas - Preferential Beta-Cell Loss in the Head Region in Patients with Type 2 Diabetes., PLOS One., 2013, 8 (6): e67454
5. American Diabetes Association. Standards of medical care in diabetes—2011. Diabetes Care. 2011, 34(Supp 1):S11–S61
Figures