0113
Towards validation and non-invasive interrogation of the hypoxia-driven insulin resistance hypothesis1Mallinckrodt Institute of Radiology, Washington University in St. Louis, St. Louis, MO, United States, 2Department of Medicine, Washington University in St. Louis, St. Louis, MO, United States, 3Department of Chemistry, Washington University in St. Louis
Synopsis
Insulin resistance is a defining feature of type 2 diabetes – a disease associated with severe morbidities and mortality. Recent studies have suggested that adipose tissue hypoxia is a major common pathway to systemic insulin resistance. The goals of this work are to: (i) directly observe evidence of the hypoxia-driven insulin resistance hypothesis in human subjects via gold-standard invasive pO2 measures and (ii) establish an R1-based pO2 metric for future non-invasive studies of adipose pO2 in metabolic disease. Herein, we report initial progress towards these goals.
INTRODUCTION
Insulin resistance is a defining feature of type 2 diabetes – a metabolic disease with severe morbidity and mortality that is primarily brought on by obesity. However, not all obese patients become insulin resistant. Recent studies1-2 have suggested that adipose tissue hypoxia - a condition induced by a rapid expansion of adipose tissue that outpaces angiogenesis - initiates adipose tissue inflammation and, ultimately, leads to systemic insulin resistance. The hypoxia-driven pathogenesis of insulin resistance has been in rodents, yet direct observation of a suppressed oxygen partial pressure (pO2) in humans is lacking. Direct quantification of adipose pO2 in metabolically abnormal humans would be a major advance in validating/understanding the hypoxia-driven insulin resistance mechanism.
A non-invasive method to quantify adipose tissue pO2 (one which does not require incision or damage the interrogated tissue) would be a powerful tool in this effort. To this end, O2 is paramagnetic and directly influences the magnetic resonance (MR)-measured 1H relaxation rate constant of lipid (R1)3-6 via the relationship: R1 = R1,0+ r1 pO2, where R1,0 is the 1H relaxation rate constant of lipid in the absence of O2 and r1 is the lipid relaxivity of O2. By exploiting the paramagnetic nature of O2, MR can directly and non-invasively quantify adipose pO2/hypoxia.
The goals of this work are to: (i) directly observe evidence of the hypoxia-driven insulin resistance hypothesis in human subjects via gold-standard invasive pO2 measures and (ii) establish an R1-based pO2 metric for future non-invasive studies of adipose pO2 in metabolic disease. Herein, we report initial progress towards these goals.
METHODS
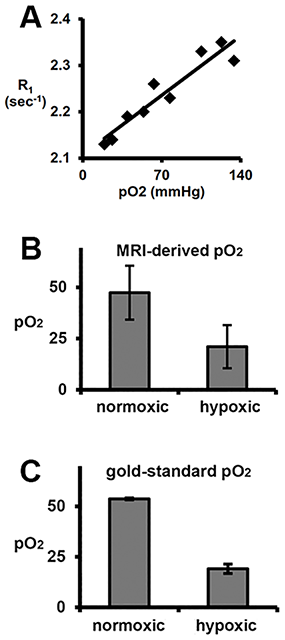
Direct measure adipose pO2 in metabolically normal and (non-diabetic) abnormal subjects: Human studies were approved by the WUSM IRB. Metabolically normal (MNO, n=7) and abnormal (MAO, n=6) subjects with obesity (BMI ≥ 30.0 and ≤ 48.0 kg/m2), ages of 18-55 were recruited into this study. Defining metrics for MNO: IHTG ≤ 3%; serum TG < 150 mg/dl; serum HDL-cholesterol ≥ 40 mg/dl for men and ≥ 50 mg/dl for women; fasting plasma glucose < 100 mg/dl, 2-hr OGTT plasma glucose ≤ 125 mg/dl, and HbA1C ≤ 5.5%. Defining metrics for MAO: IHTG≥5.6%; HbA1C≥5.7%, or fasting plasma glucose ≥100 mg/dl, or 2-hr OGTT plasma glucose ≥140 mg/dl. Amongst other disqualifiers for enrollment was diabetes controlled with medication. Adipose tissue oxygenation was measured for two minutes with a sterile OxyLite (Oxford Optronix, Ltd.) oxygen-sensitive fiber-optic probe inserted into the subcutaneous adipose tissue of subjects through a small incision. Towards quantifying pO2 with MR: Lipid R1 (characterized by the longitudinal relaxation of the 1.3ppm methylene resonance) was measured in the white adipose of an aneasthetized healthy C57Bl/6 mouse under temperature control at discrete adipose pO2 levels (as determined by OxyLite probe). Adipose pO2 was modulated by varying breathing gas O2 content (balance N2) from 12.5% O2 to 100% O2. Further R1 was measured at adipose oxygen tensions previously established to be associated with insulin resistance in rodents (~15 mmHg)1. MR protocol: 4.7-T, custom inversion recovery Point RESolved Spectroscopy (PRESS) sequence; 32 inversion times.RESULTS
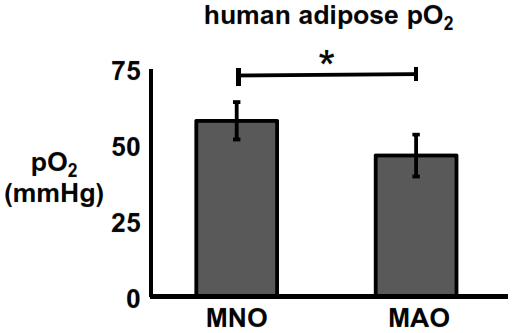
Direct measure of human adipose pO2: The adipose pO2 of MAO subjects was significantly lower than that of their MNO counterparts (p<0.05). Adipose pO2 was measured to be 47±7 mmHg and 58±6 mmHg in MAO and MNO subjects, respectively (Fig. 1). Towards quantifying pO2 with MR: There was a linear relationship between in vivo lipid R1 and adipose pO2 (R2=0.9). From these data, r1 and R1,0 were calculated to be 1.9x10⁻³ mmHg-1sec-1 and 2.11 sec-1, respectively, at 4.7 tesla (Fig. 2A). Using this linear relationship, adipose pO2 levels typical of insulin resistance in mice can be resolved in vivo (Fig. 2B).DISCUSSION & CONCLUSION
Herein we report our initial progress towards validation and non-invasive interrogation of the hypoxia-driven insulin resistance hypothesis. Thus far, we have shown that metabolically abnormal subjects with obesity do indeed have a lower adipose oxygen tension compared to their metabolically normal counterparts. To the best of our knowledge, this is the first direct (pO2) evidence of the hypoxia-driven insulin resistance hypothesis in humans. Ideally, these measurements would be made without an invasive probe, which requires incision and who’s measure is potentially confounded by local trauma caused by the probe. To this end, MR shows promise. We report a direct and robust relationship between R1 and pO2 and show it to be sensitive enough to discern levels of adipose hypoxia characteristic of insulin resistance. Future work will focus on optimization of R1 measurement to improve the fidelity of the pO2 calculation and implementation/validation of the MR-based pO2 metric in humans.Acknowledgements
This work is funded by NIH Grant 1K01DK109119-01References
1. Ye J, Gao Z, Yin J, He Q. Hypoxia is a potential risk factor for chronic inflammation and adiponectinreduction in adipose tissue of ob/ob and dietary obese mice. Am. J. Physiol. - Endocrinol. Metab.2007;293:E1118–E1128.
2. Sun K, Asterholm IW, Kusminski CM, Bueno AC, Wang ZV, Pollard JW, Brekken RA, Scherer PE.Dichotomous effects of VEGF-A on adipose tissue dysfunction. Proc. Natl. Acad. Sci. 2012;109:5874–5879.
3. Berkowitz BA, McDonald C, Ito Y, Tofts PS, Latif Z, Gross J. Measuring the human retinal oxygenationresponse to a hyperoxic challenge using MRI: Eliminating blinking artifacts and demonstrating proof ofconcept. Magn Reson Med. 2001;46:412–416
4. O’Connor JPB, Jackson A, Buonaccorsi GA, et al. Organ-specific effects of oxygen and carbogen gasinhalation on tissue longitudinal relaxation times. Magn Reson Med 2007;58:490–496.
5. Mason RP, Antich PP, Babcock EE, Constantinescu A, Peschke P, Hahn EW. Non-invasive determinationof tumor oxygen tension and local variation with growth. Int. J. Radiat. Oncol. 1994;29:95–103.
6. Jordan BF, Magat J, Colliez F, et al. Mapping of oxygen by imaging lipids relaxation enhancement: Apotential sensitive endogenous MRI contrast to map variations in tissue oxygenation. Magn Reson Med2013;70:732–744.
Figures