0111
Simultaneous fMRI with GCaMP6-mediated neuronal and astrocytic calcium signal recordingMaosen Wang1,2, Yi He1,2, and Xin Yu1
1High Field Magnetic Resonance Department, Max Planck Institute for Biological Cybernetics, Tuebingen, Germany, 2Graduate Training Centre of Neuroscience, International Max Planck Research School, University of Tuebingen, Tuebingen, Germany
Synopsis
Neurovascular coupling is the basis of the BOLD fMRI, however, the mechanisms of the neurovascular coupling remains elusive. By simultaneous cell-type specific Ca2+ recording with BOLD fMRI, it allowed us to study the cellular specific coupling events through the neuron-glia-vessel network. This work showed neuronal Ca2+ and evoked astrocytic Ca2+ signal were positively correlated to the fMRI signal, but an intrinsic astrocytic Ca2+ signal was negatively correlated to the fMRI signal in the cortex. It indicated a novel neuron-glia-vascular coupling event mediated through the intrinsic astrocytic calcium signal (details mechanistic study in another abstract: ID 4475).
Introduction
Functional magnetic resonance imaging (fMRI) based on blood oxygen level dependent (BOLD) signals reflects the changes of oxy/deoxy-hemoglobin ratio in vessels. Simultaneous fMRI studies with electrophysiological recordings have demonstrated that BOLD-fMRI signal correlated with neuronal activity1. In addition, Schulz et al acquired fMRI and calcium (Ca2+) signal simultaneously through Ca2+ sensitive dyes2. Using the similar strategy, we expressed the genetically encoded calcium indicators (GCaMP6f) specifically in either neurons or astrocytes in the rat cortex. The cell-type specific Ca2+ signal showed different coupling features to the BOLD fMRI signal. In contrast to the highly correlated neuronal Ca2+ signal to the fMRI signal, the evoked astrocytic Ca2+ signal remained positively correlated to fMRI signal, but showed an unexpected decoupling outlier event. The outlier event represented higher astrocytic calcium spikes but reduced BOLD signal in comparison to the other evoked events. This work implies a novel neuron-glia-vascular coupling event mediated through the intrinsic astrocytic calcium signaling.Method
Methods All images were acquired with a 14.1 T/26cm horizontal bore magnet (Magnex), interfaced to an AVANCE III console (Bruker) and equipped with a 12 cm gradient set, capable of providing 100 G/cm with a rise time of 150 us (Resonance Research). A transreceiver surface coil was used to acquire fMRI images. Electrodes were placed on the forepaw (FP) to deliver a 1.0 mA pulse sequence (4s, 300μs duration repeated at 3Hz). GCaMP6f 3was expressed by AAV5 in the FP somatosensory cortex (FP-S1) or barrel cortex (BC) with Syn or GFAP promoter. Fiber optic (200um) was inserted into the area which expressed GCaMP for calcium-based fluorescent signal recording.Results
Upon electrical stimulation, the evoked neuronal and astrocytic Ca2+ signal was simultaneously acquired with either LFP recordings or BOLD-fMRI in the rat forepaw S1 cortex (Fig 1). The neuronal calcium was highly correlated with either the sensory evoked potential (Fig 2a~c) or spontaneous LFP (Fig 2d~f). The astrocytic calcium response was correlated with corresponding LFP at different durations of the FP stimulus (Fig 3).Fig 4 shows that the peak amplitude of the evoked neuronal and astrocytic Ca2+ signal is proportional to the peak amplitude of fMRI signal simultaneously acquired at different electrical stimulation intensities. Interestingly, an outlier event demonstrated a negative correlation event between the astrocytic Ca2+ signal and fMRI signal (Fig 4e,f). This outlier event may indicate an unexpected decoupling of astrocytic calcium to fMRI signal.Conclusion
A multi-modal fMRI platform was established to acquire simultaneous fMRI and GCaMP-mediated cell-type specific Ca2+ signal. It allowed us to decipher the cellular specific coupling events through the neuron-glia-vessel network contributing to brain state change. This study implied a novel neuron-glia-vascular coupling event mediated through the intrinsic astrocytic calcium signal. More details about the intrinsic astrocytic calcium signal was described in the other abstract (ID 4475).Acknowledgements
This research was supported by the internal funding from Max Planck Society.References
1. Logothetis et al. Nature, 412:150-157 (2001). 2. Schulz et al. Nature Method, 9: 597-605 (2012). 3. Chen et al. Nature, 499:295-302 (2013).Figures
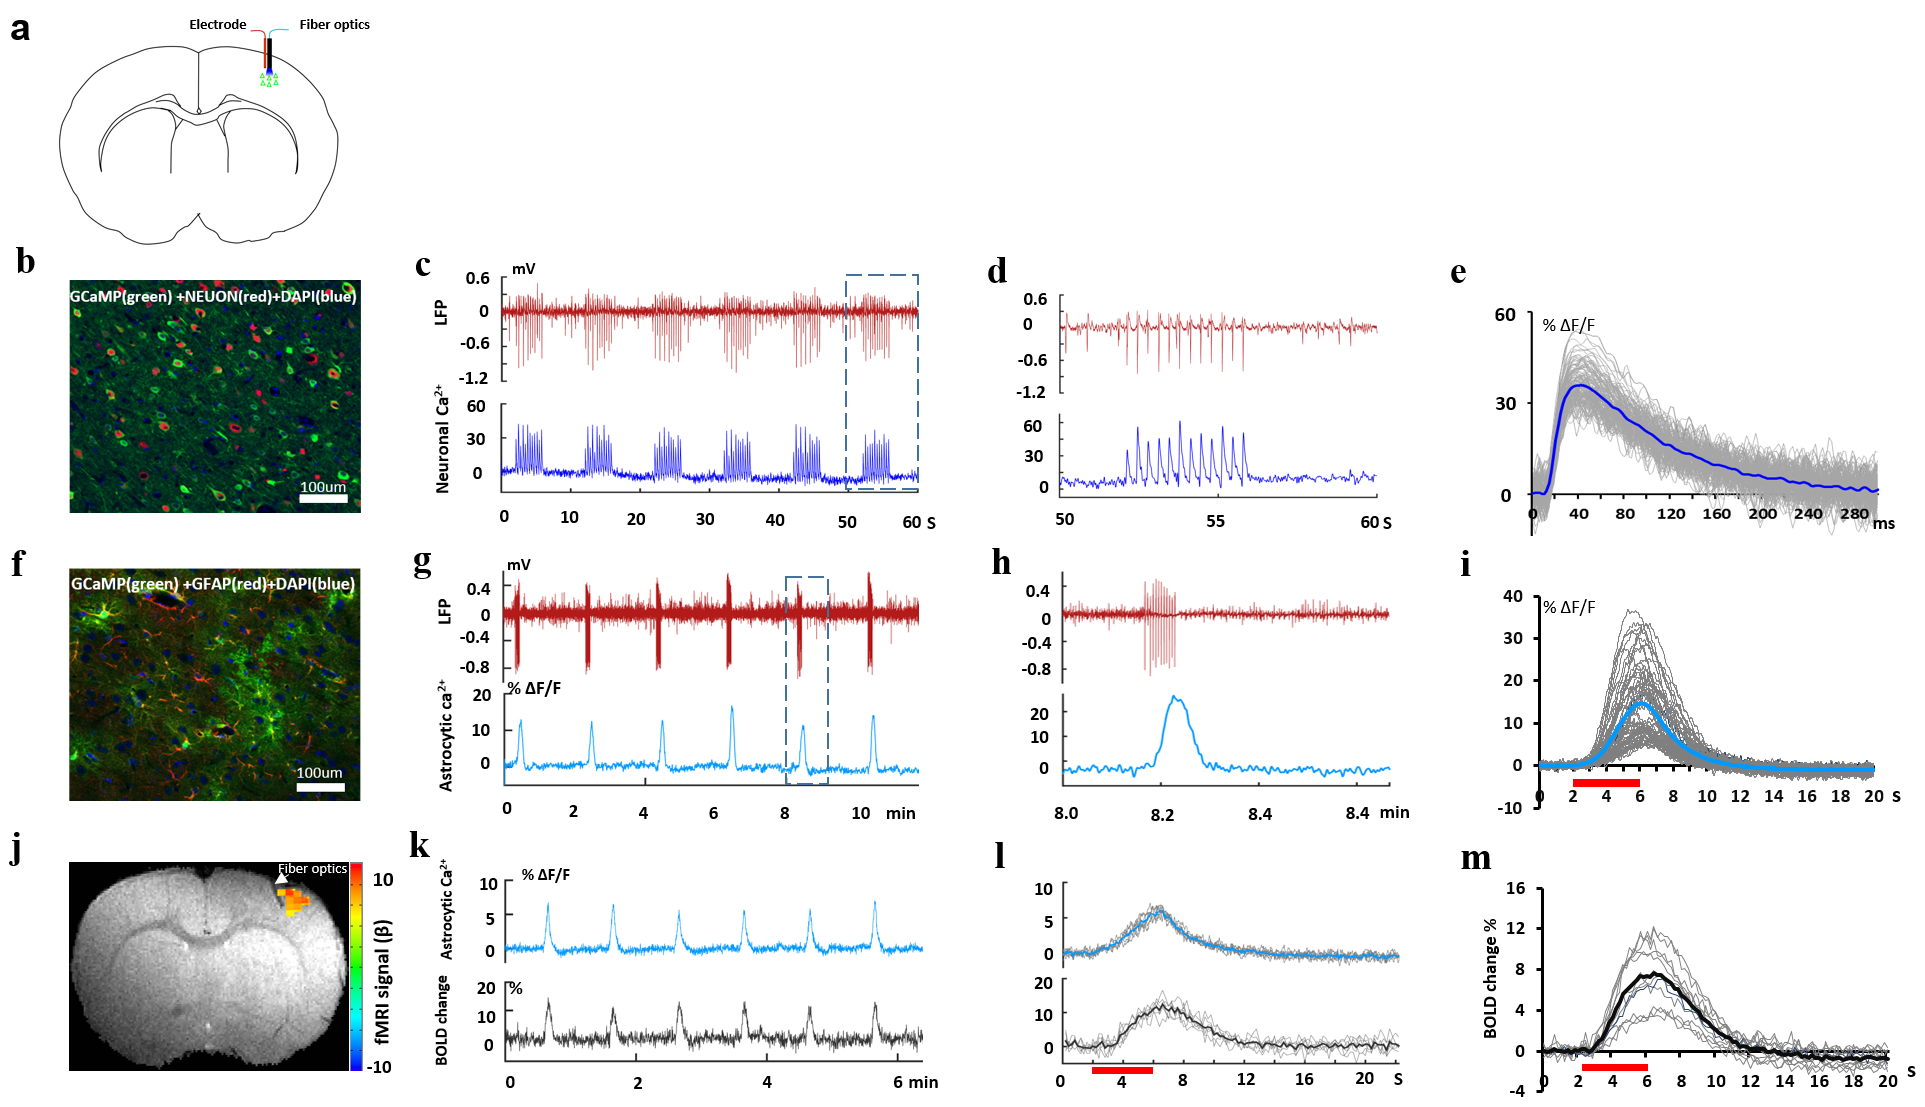
Fig
1. The sensory evoked cell-type specific Ca2+ and corresponding
LFP or BOLD. (a) Schematic of simultaneous LFP and Ca2+
recording. (b) GCaMP was colocalized with specific neuronal nuclear
marker(NEUON). (c) LFP and relative GCaMP in neurons. (d) Zoom-in
corresponding to the box in c; (e) Averaged sensory evoked neuronal Ca2+
response. (f) GCaMP colocalized with specific astrocytes marker(GFAP). (g)
LFP and GCaMP in astrocytes. (h) Zoom-in corresponding to the box in
g. (i) Averaged astrocytic calcium response. (j) fMRI Activation
maps. (k) GCaMP6f in astrocytes and BOLD. (l) Averaged astrocytic
calcium response and BOLD response. (m) Averaged BOLD response.

Fig.
2 Simultaneous LFP with neuronal calcium recording. (a) LFP (red) and corresponding neuronal Ca2+
(blue) at forepaw electric stimulus (each cycle is 30s, rest(22s),
stimulus(8s), 1.0mA, 1.5Hz). (b) Average
SEP and sensory evoked neuronal calcium. (c) Scatter plot the peak
amplitude (>0.3mA) of the LFP and
corresponding neuronal calcium in a. (d) Spontaneous LFP (red) and
corresponding neuronal Ca2+ (blue) at FP-S1. (e) Magnified
view of the box in d. (f) Scatter plot the peak amplitude (>0.3mA) of
the LFP and corresponding neuronal calcium in d.
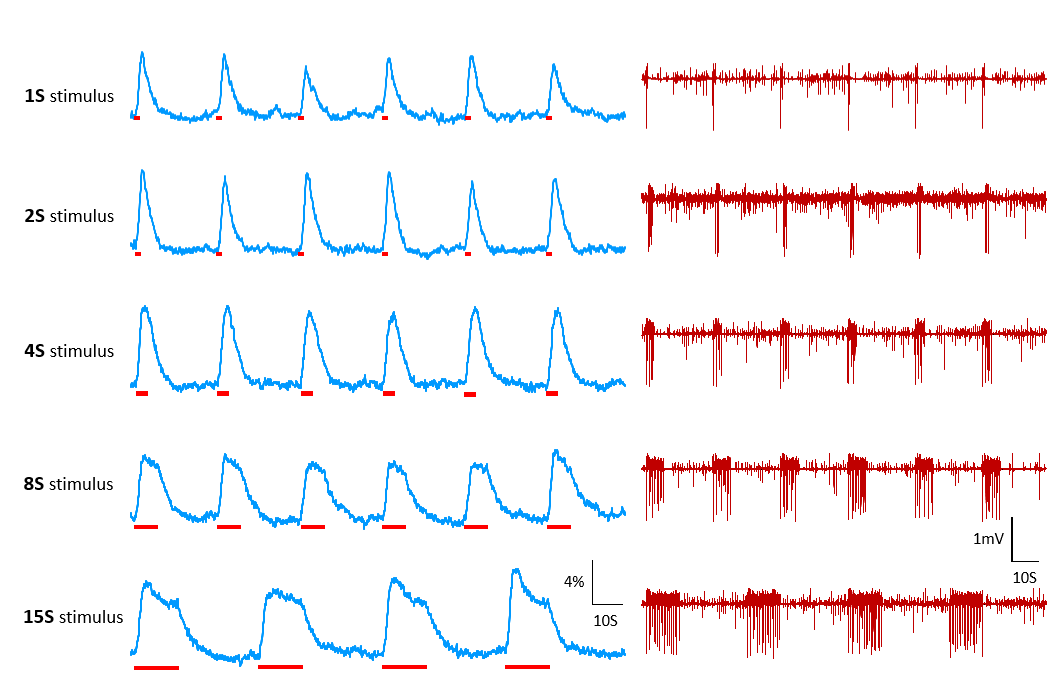
Fig. 3 Simultaneous astrocytic calcium with
LFP recordings at different durations of the FP stimulus. The time course of
the astrocytic calcium(left panel) and corresponding LFP(right panel) at
different duration of the FP stimulus. The red bar indicates the FP electric
stimulus is on.

Fig
4. Simultaneous BOLD with two channels cell-type specific Ca2+
recording. (a) Schematic of simultaneous BOLD and two channels
calcium recording. (b) The neuronal(left) and astrocytic(right) Ca2+
and simultaneous BOLD signal from FP-S1. Activation map(middle). (c)
Averaged BOLD-fMRI signal acquired at different electric intensity in
left(left) and right hemisphere(right). (d) Averaged Ca2+ signal
responses at different electric intensity in neurons(left) and
astrocytes(right). (e) Scatter plot the amplitude of the Ca2+ and
BOLD-fMRI signal at different stimulation intensity (red circle showed the
outlier). (f) The time course of BOLD-fMRI and astrocytic Ca2+ signal
with the outlier event highlighted by red square.