0104
Feasibility of glucose CEST in the human placenta1Fetal-neonatal Neuroimaging and Developmental Science Center, Boston Children's Hospital, Harvard Medical School, Boston, MA, United States, 2Athinoula A. Martinos Center for Biomedical Imaging, Department of Radiology, Massachusetts General Hospital and Harvard Medical School, MA, United States, 3Center for Biomedical Engineering, Department of Electronic Science and Technology, University of Science and Technology of China, People's Republic of China, 4Pathology, Massachusetts General Hospital and Harvard Medical School, MA, United States
Synopsis
Placental glucose transfer is essential to sustain fetal development, yet there has been no report attempting to measure glucose transport across the human placenta with MRI-based approaches. Emerging glucose chemical exchange saturation transfer (glucoCEST) imaging is uniquely sensitive to glucose, which has been explored in tumor imaging. Herein, we have demonstrated glucoCEST MRI is a valid tool to monitor glucose perfusion in ex vivo human placenta, laying the groundwork for in vivo glucoCEST in human placenta.
Purpose
Placental glucose transfer is essential to sustain fetal development, yet there has been no report attempting to measure glucose transport across the human placenta with MRI-based approaches.1 Emerging glucose chemical exchange saturation transfer (glucoCEST) imaging is uniquely sensitive to glucose, which has been explored in tumor imaging.2-4 Herein, we aim to assess the feasibility of glucoCEST in accessing placenta glucose transport.Materials and Methods
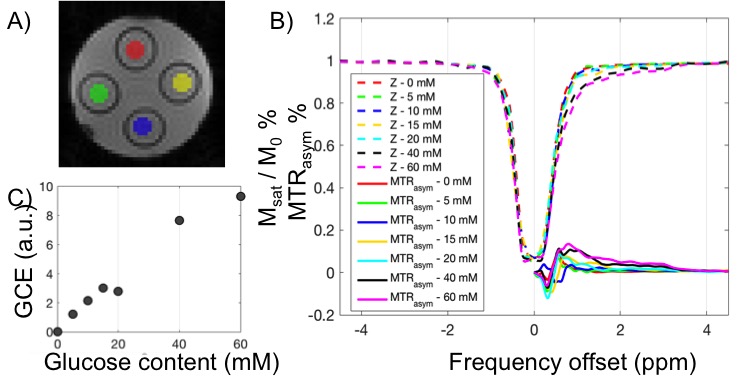
Materials: Glucose phantom: D-glucose was dissolved in distilled water at concentrations of 5, 10, 15, 20, 40, 60 mM (pH 6.5) and transferred into separate 50mL Falcon tubes, positioned in a cylindrical sample holder. During MRI scan, the temperature was maintained at room temperature (25 C).
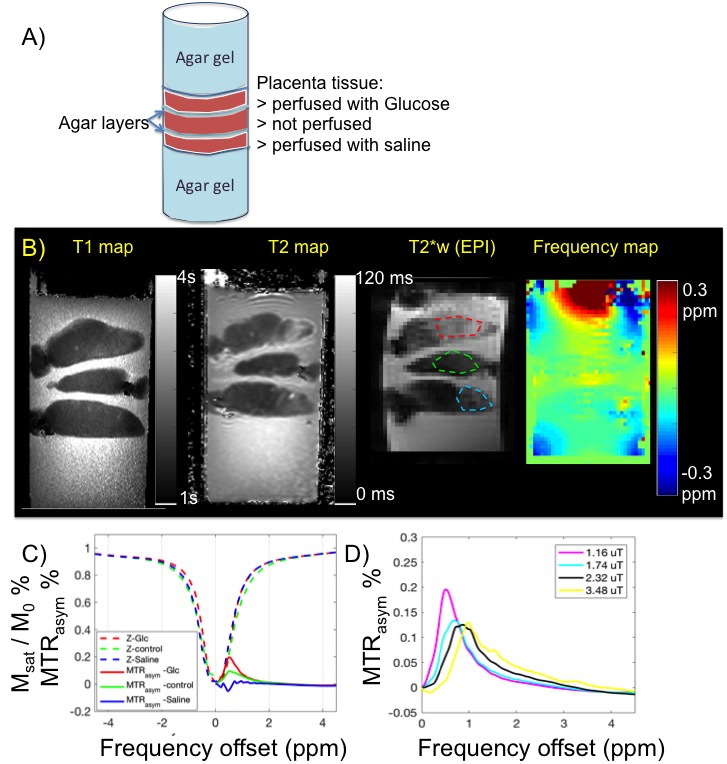
Placental tissue sample: Cannulation was performed on the surface fetal chorionic artery of the placenta specimen. Saline with heparin and D-glucose solution (20mM) were perfused in separate placenta cotyledons of the same placenta (normal, within 6 hrs of delivery). After perfusion, the area around the perfused cotyledon was clamped, sutured, and dissected to fit in to a cylindrical container of 10cm diameter. Three placenta sections were prepared and stacked in the container, with the bottom, the top and gaps between tissue filled with agar gel to fix their location and to improve field homogeneity. After gel solidification (at 4C) sample was maintained at room temperature.
Data Acquisition: Studies were performed on a 3T Trio scanner (Siemens Healthcare, Erlangen, Germany) using a 32-channel array head coil at room temperature. CEST imaging of the glucose phantom was collected using single-shot gradient echo EPI, with pulsed RF irradiation scheme (duty cycle 0.5) with varying B1 field: 0.29, 1.16, 2.32, 3.48, 6.96 µT. Imaging matrix 48 x 48, 8 slices; readout direction along z, with 100% oversampling; in plane resolution 3 x 3 mm2, slice thickness 10mm; TR/TE = 5 s/17 ms, FA = 90°, BW = 2.3kHz/px, averages= 2. Saturation frequency offset ranged from -5 to 5 ppm with 0.25ppm steps. T2 mapping was calculated based on images acquired by double spin echo, with TR 1s, FA 90 degree, TE1/TE2= 8.5/50ms. T1 mapping was calculated based on images acquired with double flip angle gradient echo sequence TR/TE 15ms / 1.7ms, FA1/FA2=5/26 degree.
Data Processing: B0 map was obtained by Lorentzian fitting of z-spectrum of the weak B1, followed by WASSR correction of z-spectrum.5 ROIs of placental perfusion regions (and phantom tubes) were manually segmented and corrected z-spectrum and MTRasym (defined as Msat(+) - Msat(-) / Mref) were plotted for each ROI. CEST-EPI was acquired after high order field adjustment. The glucose CEST enhancement (GCE) is defined as the change in the integral of MTRasym between 0 and 4 ppm.
Results and discussions
Based on previous simulations6 we estimate B1 level around 2μT was optimal for glucose CEST effect at 3.0 Tesla. To test the detection limit of CEST-EPI, we measured CEST effect in glucose solutions with various concentration, with range covering physiological sugar level (Figure 1). Z-spectra and MTRasym each concentration have been plotted in Figure 1B, and Figure 1C shows that we can detect glucose concentration as low as 5mM at 3T. To understand the glucose CEST effect in placental tissue, we compared glucoCEST effect of glucose perfused fresh placenta tissue, non-perfused tissue and saline perfused tissue (Figure 2). Sub regions of perfused tissue were identified based on T2* contrast change. As expected, the glucose perfused tissue demonstrated strongest CEST effect. T2 relaxation rate constant has been reported to depend on glucose concentration,7 however the strong T2 effect of glucose perfused ex vivo tissue may not be representative for in vivo study if it is caused by deoxyHb washout. CEST effect in the non-perfused tissue possibly due to blood content in the fetal vasculature (10% v/v8). Blood sugar level in the placenta is reported to be around 5mM in vivo,9 which may become higher in the postpartum tissue due to fluid loss. On the other hand, the saline perfused tissue has less glucose due to blood washout. Moreover the tissue might have non-negligible MT effect at -1 ppm, leading to a slightly negative baseline shift.Conclusion
We have demonstrated glucoCEST MRI is a valid tool to monitor glucose transport in ex vivo human placenta, laying the groundwork for in vivo glucoCEST in human placenta.Acknowledgements
The study is supported by NIH R01 EB017337, NIH U01 HD087211.References
1. Desoye G, Gauster M, Wadsack C. Placental transport in pregnancy pathologies. American Journal of Clinical Nutrition. 2011;94.
2. Walker-Samuel S, Ramasawmy R, Torrealdea F, Rega M, Rajkumar V, Johnson SP, Richardson S, Gonçalves M, Parkes HG, Årstad E, Thomas DL, Pedley RB, Lythgoe MF, Golay X, Arstad E. In vivo imaging of glucose uptake and metabolism in tumors. Nature medicine. 2013;19:1067-72
3. Chan KW, McMahon MT, Kato Y, Liu G, Bulte JW, Bhujwalla ZM, Artemov D, van Zijl PC. Natural D-glucose as a biodegradable MRI contrast agent for detecting cancer. Magn Reson Med. 2012 Dec;68(6):1764-73
4. Xu X, Chan KW, Knutsson L, Artemov D, Xu J, Liu G, Kato Y, Lal B, Laterra J, McMahon MT, van Zijl PC. Dynamic glucose enhanced (DGE) MRI for combined imaging of blood-brain barrier break down and increased blood volume in brain cancer. Magn Reson Med. 2015 Dec;74(6):1556-63.
5. Kim M, Gillen J, Landman BA, Zhou J, van Zijl PCM. Water saturation shift referencing (WASSR) for chemical exchange saturation transfer (CEST) experiments. Magn Reson Med. 2009;61(6):1441-50.
6. Jiang W, Zhou IY, Wen L, Zhou X, Sun PZ. A theoretical analysis of chemical exchange saturation transfer echo planar imaging (CEST-EPI) steady state solution and the CEST sensitivity efficiency-based optimization approach. Contrast Media Mol Imaging. 2016 Sep;11(5):415-423
7. Yadav NN, Xu J, Bar-Shir A, Qin Q, Chan KW, Grgac K, Li W, McMahon MT, van Zijl PC. Natural D-glucose as a biodegradable MRI relaxation agent. Magn Reson Med. 2014;72(3):823–828.
8. Egbor M, Ansari T, Morris N, Green CJ, Sibbons PD. Morphometric placental villous and vascular abnormalities in early- and late-onset pre-eclampsia with and without fetal growth restriction. BJOG. 2006 May;113(5):580-9.
9. Holme AM, Roland MC, Lorentzen B, Michelsen TM, Henriksen T. Placental glucose transfer: a human in vivo study. PLoS One. 2015 Feb 13;10(2):e0117084
Figures