0102
Assessment of uterine artery hemodynamics in normal pregnancy with 4D Flow MRI1University of Pennsylvania, Philadelphia, PA, United States, 2Children's Hospital of Philadelphia, Philadelphia, PA, United States
Synopsis
In vivo imaging of uterine artery blood flow during remodeling is potentially valuable in assessing placental function during pregnancy. We present 4D flow MRI of the uterine arteries, demonstrating inter- and intrasubject heterogeneity in vessel anatomy and hemodynamics. This high spatial resolution, multi-location approach potentially addresses the limitations of Doppler ultrasound in quantifying pulsatility and resistance indices as clinical biomarkers of placental health.
Purpose
A gradual reduction in uterine artery (UtA) resistance during pregnancy is essential to support the increased flow to the placenta. Adverse pregnancy outcomes, such as preeclampsia and intrauterine growth restriction, have been associated with increased UtA resistance likely due to pathologic downstream placental development1,2. However, there is little understanding of how this process may be impaired in disease, in part due to the lack of methodologies to assess it. Doppler ultrasound (US) is currently the primary method used to assess UtA hemodynamic in pregnancy, typically at a single location where the UtA can be identified as it crosses the external iliac artery. However, the correlation between UtA Doppler PI and RI and disease is inconsistent3,4. Here, we assessed the feasibility of using 4D flow MRI to evaluate UtA anatomy and hemodynamic at multiple locations from near the internal iliac artery to the arcuate artery adjoining the placenta and compared the results to single-location Doppler US in normal pregnant subjects.Methods
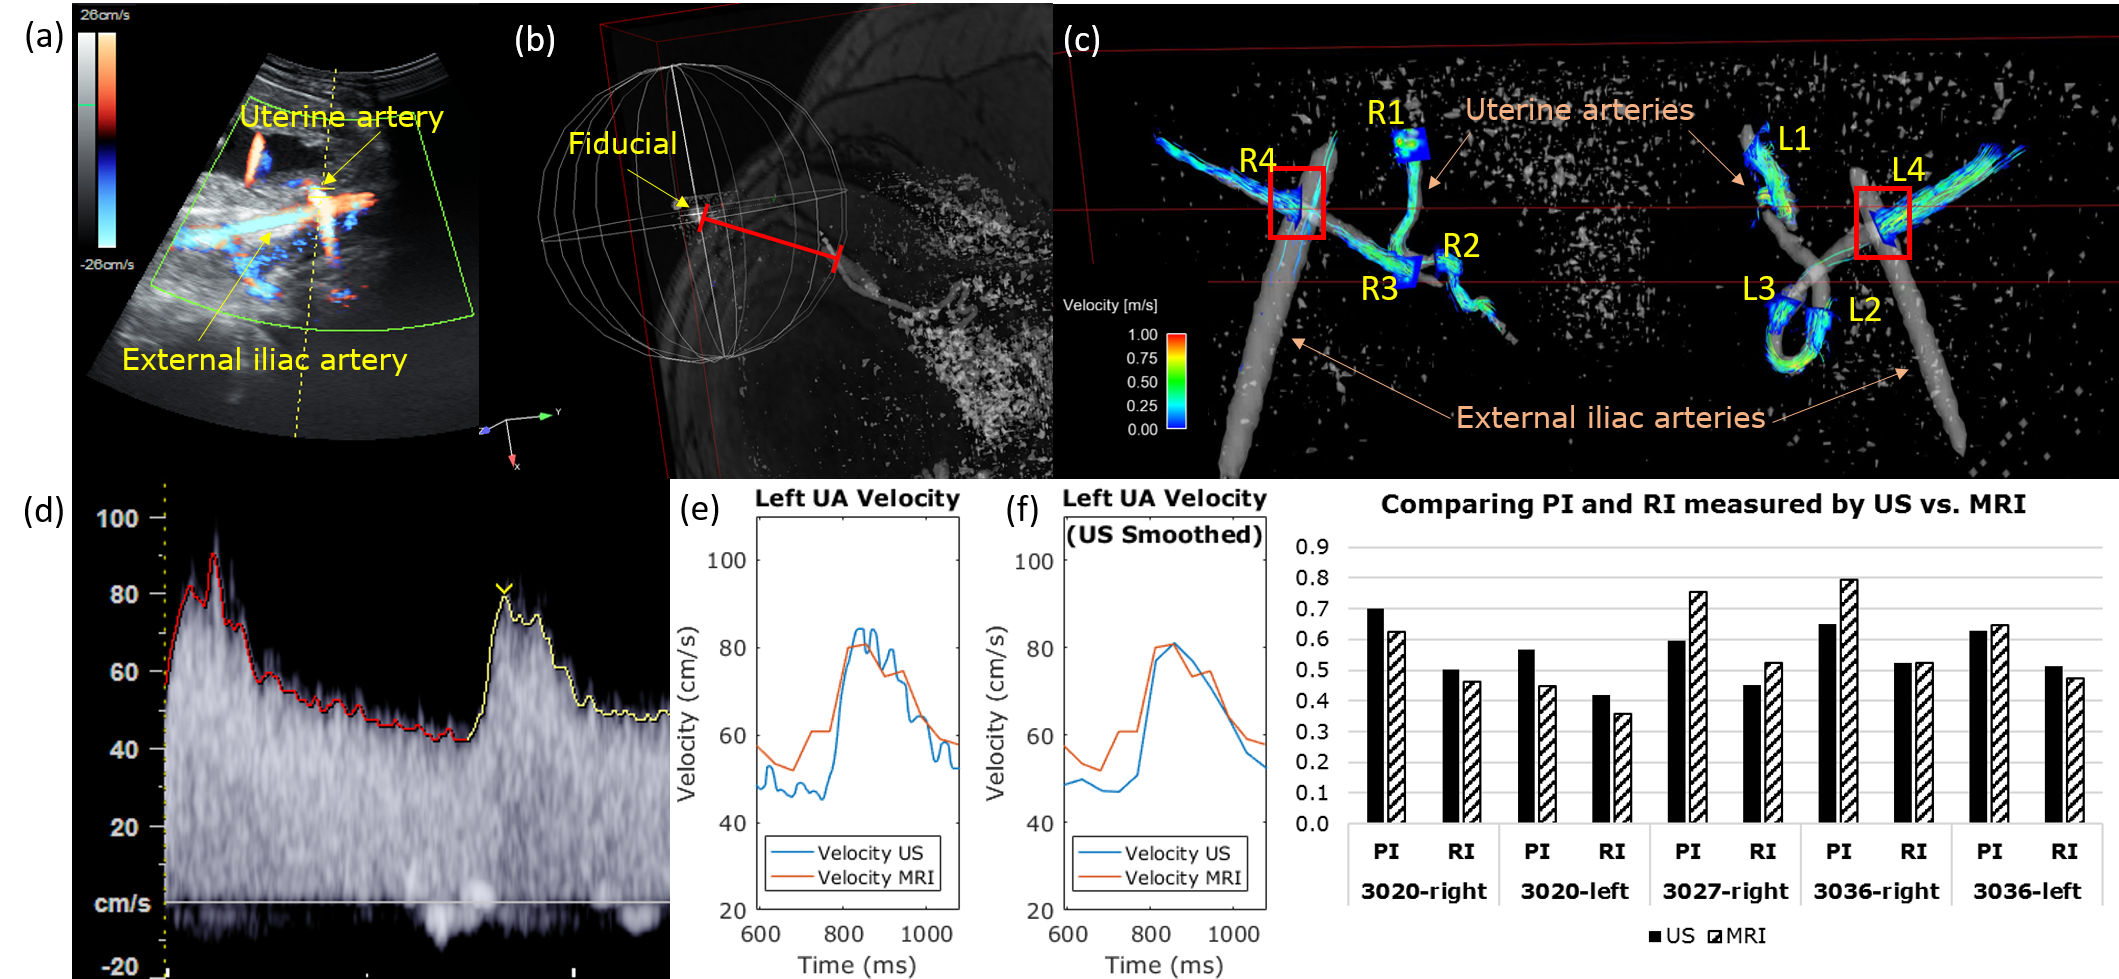
Ten pregnant subjects (gestational age=18-31 weeks) were imaged at 1.5 T (Avanto, Siemens) with an 18-channel body array coil. Uterus and uterine artery localization was performed with HASTE and ECG-gated time-of-flight. 4D flow was performed with four-point velocity encoding and the following parameters: flip angle=8 degrees, TR/TE=5.5/2.9 ms, FOV=320x280x60 mm3, voxel size=1.25x1.25x1.25mm3, BW=445 Hz/pixel, segments=2, temporal resolution=44 ms, acceleration factor=4.75, and venc=100 cm/sec6. The total acquisition time was 12-15 min. Peak velocity, pulsatility index (PI), resistivity index (RI), and temporal standard deviation (SD) were estimated from four UtA cross-sections from the internal iliac to arcuate arteries using Ensight (CEI; Apex). Peak velocity is the spatial maximum velocity in the plane, $$$PI=\frac{v_{max}-v_{min}}{\overline{v}}$$$, $$$RI=\frac{v_{max}-v_{min}}{v_{max}}$$$, and temporal $$$SD=\sqrt{\frac{\sum_n (v_n-\overline{v})^2}{N-1}}$$$, where $$$v_n$$$=peak velocity at time index $$$n$$$, $$$N$$$=number of time points, $$$v_{max}$$$=peak systolic velocity, $$$v_{min}$$$=minimum diastolic velocity, and $$$\overline{v}$$$=average velocity over time. Three of the subjects (3020,3027,3036) underwent UtA Doppler ultrasound (US) prior to MRI (E10 Voluson, GE Healthcare) and MRI-compatible fiducials were placed at the location of the US probe (Fig. 3). US data (~160-360 points per cardiac cycle) was downsampled to match 4D flow MRI (~14 cardiac phases).Results
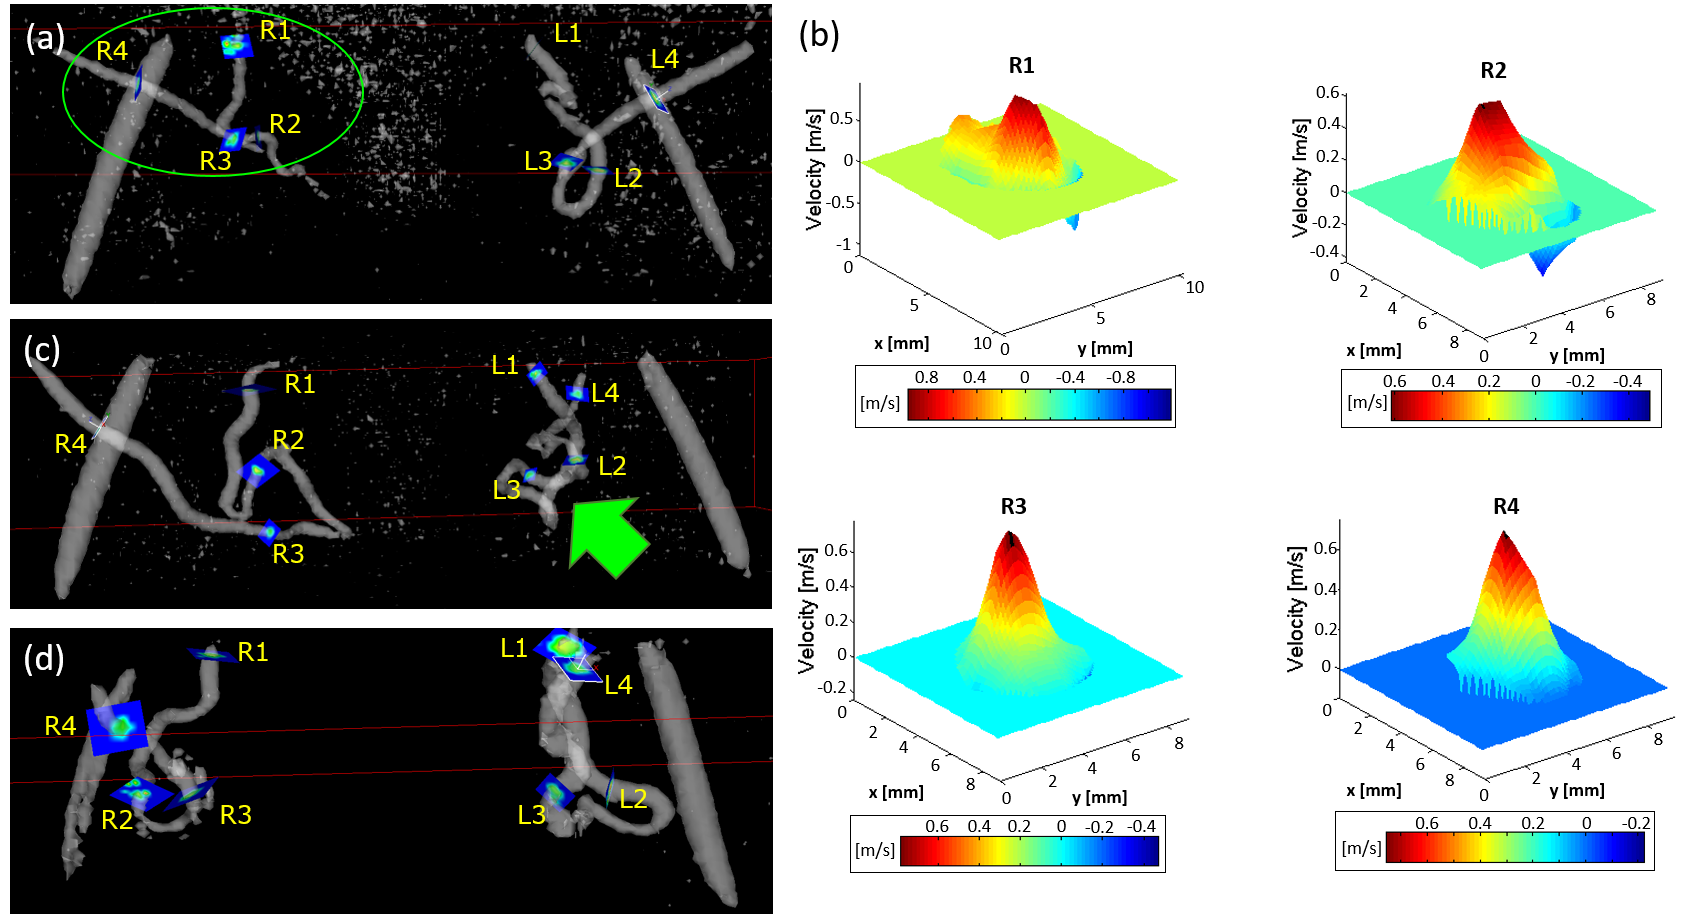
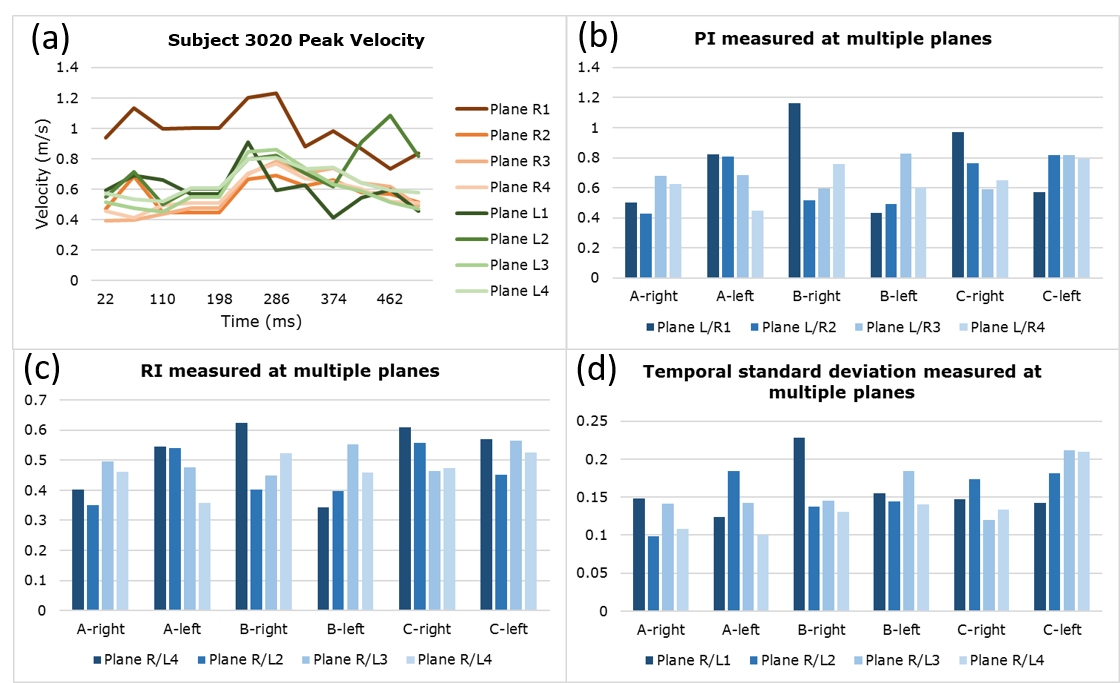
In all subjects, right and left UtA branched from the right and left internal iliac artery, entered a tortuous hairpin proximal segment, transitioned from superior-inferior (SI) to IS trajectory, and entered a distal straight segment towards the uterus before branching at the arcuate artery (Fig. 1a,c,d). However, there was considerable inter- and intrasubject (left-right UtA) anatomical and hemodynamic heterogeneity. Fig. 1b shows the varying 3D planar velocity profiles of four planes at the time of peak systole in the right UtA of Subject 3020. Proximal flow appeared to be more non-laminar with slight flow reversal compared to distal flow. Fig. 2a shows the waveforms from Subject 3020 along each UtA. PI, RI, and SD decreased from proximal to distal locations in the left UtA in Subject 3020 and the right UtA in Subject 3036 (Fig. 2b-d). PI, RI, and SD were variable across the four planes in each uterine artery with an average coefficient of variation (CV) of CVSD=19.3±5.3%, CVPI=25.2±7.7%, and CVRI=16.1±3.9%. There was close agreement between 4D flow and Doppler US velocity, PI, and RI at the intersection of the UtA and external iliac artery (i.e. Planes R/L4) (Fig. 3).Discussion
Our results demonstrate that 4D flow MRI is a feasible approach for assessing hemodynamics at multiple locations, is not severely affected by fetal and respiratory motion, and shows close agreement with Doppler US (Fig. 3g). Both intersubject and intrasubject heterogeneity of UtA anatomy could be visualized by 4D flow MRI (Fig. 1a,c,d). Corresponding heterogeneity of UtA hemodynamics was also demonstrated by the differences in velocity profiles along a representative UtA (Fig. 1b) and individual PI, RI, and temporal SD with considerable coefficient of variation (Fig. 2). The complex geometry of the hairpin contributes to local flow acceleration, non-laminar flow, flow reversal in proximal UtA, and laminar flow in distal linear segments (Fig. 1b).Conclusion
4D flow MRI of the UtA in pregnancy is feasible and offers high spatial resolution and multi-location imaging useful for imaging complex UtA structure and hemodynamics. It also provides a means of cross-validating Doppler US metrics, and has potential for robustly evaluating both normal and pathologic uterine artery flow during pregnancy.Acknowledgements
We gratefully acknowledge support from U01 HD087180, NSF 1321851, P41 EB015893, NIH R00 HL108157References
1. Ilekis J V, Tsilou E, Fisher S, Abrahams VM, Soares MJ, Cross JC, et al. Placental origins of adverse pregnancy outcomes: potential molecular targets: an Executive Workshop Summary of the Eunice Kennedy Shriver National Institute of Child Health and Human Development. Am J Obstet Gynecol Elsevier Inc.; 2016;215(1):S1–46.
2. Weiss G, Sundl M, Glasner A, Huppertz B. The trophoblast plug during early pregnancy?: a deeper insight. Histochem Cell Biol. Springer Berlin Heidelberg; 2016.
3. Hawkes RA, Patterson AJ, Priest AN, Harrison G, Hunter S, Pinney J, et al. Uterine artery pulsatility and resistivity indices in pregnancy: Comparison of MRI and Doppler US. Placenta [Internet]. Elsevier Ltd; 2016;43:35–40.
4. Papageorghiou AT, Yu CKH, Nicolaides KH. The role of uterine artery Doppler in predicting adverse pregnancy outcome. Best Pract Res Clin Obstet Gynaecol [Internet]. 2004;18(3):383–96.
5. Jung B, Ullmann P, Honal M, Bauer S, Hennig J, Markl M. Parallel MRI with extended and averaged GRAPPA kernels (PEAK-GRAPPA): Optimized spatiotemporal dynamic imaging. J Magn Reson Imaging. 2008;28(5):1226–32.
6. Markl M, Frydrychowicz A, Kozerke S, Hope M, Wieben O. 4D flow MRI. J Magn Reson Imaging. 2012;36(5):1015–36.
Figures