0100
A One-Step Biomarker Quantification Methodology for DCE-MRI of Complex Ovarian Masses: Capturing Kinetic Pattern from Early to Late Enhancement1Quantitative MR Imaging and Spectroscopy Group, Research Center for Molecular and Cellular Imaging, Tehran University of Medical Sciences, Tehran, Iran, 2Department of Medical Physics and Biomedical Engineering, Tehran University of Medical Sciences, Tehran, Iran, 3Department of Mathematics, Islamic Azad University, Qazvin Branch, Qazvin, Iran, 4Department of Diagnostic Imaging, Shohada-e-Tajrish Hospital, Shahid Beheshti University of Medical Sciences, Tehran, Iran
Synopsis
Accurate characterization of sonographically-indeterminate ovarian masses before surgery is crucial for proper disease management. While DCE-MRI has emerged as a problem-solving technique, accurate parameter estimations from semi-quantitative or PK analysis are dependent on multiple steps, including proper protocol design, motion reduction, selection of physiology-based PK model and AIF, which discourages development and reliability of computer-aided diagnostic procedures. Here, we aimed to develop a one-step pre-processing and quantification classification scheme based on a five-parameter Sigmoid model, capturing early- to late-enhancement kinetics, including washout as a previously overlooked parameter for ovarian masses, to generate accurate differentiation of complex ovarian masses.
Introduction
Accurate characterization of sonographically-indeterminate ovarian masses before surgery can elucidate patient-specific disease management, for which dynamic contrast-enhanced (DCE-) MRI has evolved into a helpful functional diagnostic technique 1,2. Yet, estimations of diagnostic DCE-MR-derived biomarkers, such as semi-quantitative or pharmacokinetic (PK) parameters, are dependent on multiple steps, which may complicate computer-aided diagnostic approaches: in the former, inevitable organ motion artifacts, bias fields, and ignoring the late-phase wash-out behavior of dynamic curves, and in the latter, inadequate selection of arterial input function (AIF) or physiology-based PK model, can adversely impact the quantification outcome 3,4. To account for deficiency of current methods in quantification of DCE-MRI of complex adnexal masses from early to late-phase while accounting for misregistration of consecutive dynamic images, in this study, we intended to investigate the role of a one-step pre-processing and quantification method based on a five-parameter Sigmoid function and its associated primary features in discriminating complex ovarian masses.
Methods
Data Acquisition: Pre-operative DCE-MRI of 43 women was acquired on a 3T scanner (MAGNETOM Tim TRIO, Siemens), with a pelvic phased-array coil in supine position, using a 3D Turbo FLASH gradient-echo T1-weighted pulse sequence with 5 measurements before and right after injection of 0.2mL/kg of Gadolinium followed by 20cc normal saline solution with 3mL/min injection rate, continued to 32 measurements with 7.6 s/frame intervals. All patients underwent surgery and were provided with post-operative histopathological assessment results confirming 24 benign and 19 malignant patients.
Image Analysis and Data Quantification: For each patient, regions of interest (ROIs) were delineated on most suspicious regions according to anatomical images by an experienced radiologist. The ROIs were overlaid on the corresponding unprocessed images and time-intensity curves (TICs) were generated over all dynamic time-points. A five-parameter Sigmoid model including a scaled linear function (P5.t) that represents the late enhancement portion of the kinetic curve 4 was implemented (Eq. 1). $$ f(t)=P_{1}+\frac{P_{2}+\left(P_{5}.t\right)}{1+exp(\frac{-(t-P_{3})}{P_{4}})} $$ (Eq. 1)
Here, P5 is the late enhancement slope (a positive value shows an increasing and a negative value indicates a decreasing wash-out phase), P1 denotes minimum of the signal, P2 is the signal enhancement amplitude, P3 and P4 represent approximations to time of maximal slope and maximal slope (Fig.1). For comparison, PK parameters (Ktrans, Kep, Vp) based on two-compartment Tofts model and semi-quantitative parameters (Maximum Relative Enhancement (SIrel), Time-to-Peak (TTP), Wash-in-Rate (WIR), and Wash-out-Rate (WOR)) were computed.
Statistical Analysis and Classification: The means of each of the features were compared among benign and malignant lesions using two-tailed Student’s t-test by assuming nonequality of variances with a significance level of 0.0033 after Holm-Bonferroni correction for multiple comparisons. For each parameter, Fischer’s linear discriminant analysis (LDA) classifier was applied to discriminate benign from malignant patients.
Results
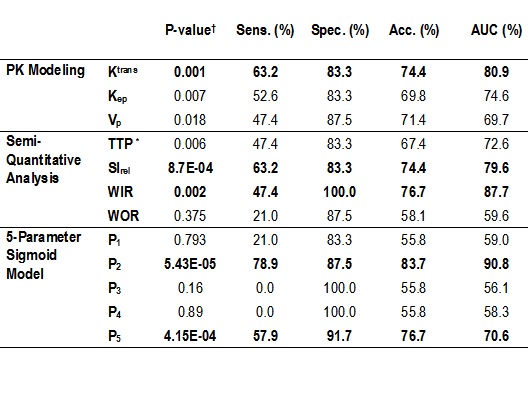
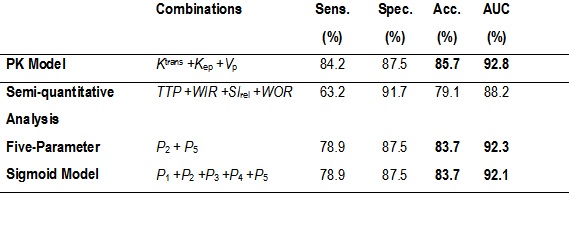
Among the features of five-parameter sigmoid (Table 1), the means among benign and malignant lesions were significantly different for P2 (P=5.43E-05) and P5 (P=4.15E-04). Ktrans showed statistically significant differences among benign and malignant lesions (P=0.001). Among semi-quantitative parameters, SIrel (P=8.7E-04), WIR (P=0.002) showed statistically significant differences. P2 and P5 were the most accurate kinetic features respectively with accuracies of 83.7% and 76.7%, among all features including Ktrans, SIrel, and WIR. WIR as a highly specific marker of ovarian tumor and representative of early-enhancement behavior of contrast uptake, performs almost the same (accuracy of 76.7%) as the late-enhancement characteristic feature P5, with a comparable specificity and higher sensitivity. The combination of parameters in each category (semi-quantitative, PK, and five-parameter sigmoid models) revealed that the five-parameter sigmoid model outperforms other analytical models with the highest diagnostic performance of 94.3% (in comparison with PK model with AUC=92.8%) (Table 2).Discussion
By quantifying the whole-temporal kinetic of the enhancement curves – from early to late-enhancement – through a one-step pre-processing (artifact reduction) and quantification methodology, the early-phase feature (P2) with close definition to maximum relative enhancement with high sensitivity and specificity surpassing performances of previously proposed parameters (derived from semi-quantitative and PK) was discovered. The washout feature (P5) showed close diagnostic performance to the early-phase semi-quantitative WIR, which has repeatedly been suggested as a useful discriminating feature in related studies 5,6. This finding suggests that in situations where initial acquisition is performed with insufficient time points, late-phase Sigmoid washout may still be used as an alternative to the initial-phase semi-quantitative WIR or SIrel features which may have been estimated inaccurately.Conclusion
The presented one-step quantification approach is helpful for accurate discrimination of benign from malignant complex ovarian masses. Accordingly, P2 has considerably high diagnostic performance and washout representative parameter (P5) as a previously overlooked ovarian tumor feature contributes more than widely-accepted early-enhancement kinetic features.Acknowledgements
No acknowledgement found.References
1. Bernardin L, Dilks P, Liyanage S, et al. Effectiveness of semi-quantitative multiphase dynamic contrast-enhanced MRI as a predictor of malignancy in complex adnexal masses: radiological and pathological correlation. Eur Radiol. 2012; 22(4):880-90.
2. Thomassin-Naggara I, Bazot M, Darai E, et al. Epithelial ovarian tumors: value of dynamic contrast-enhanced MR imaging and correlation with tumor angiogenesis. Radiology. 2008;248(1):148-59.
3. Hamy V, Dikaios N, Punwani S, et al. Respiratory motion correction in dynamic MRI using robust data decomposition registration–Application to DCE-MRI. Medical image analysis. 2014;18(2):301-13.
4. Moate PJ, Dougherty L, Schnall MD, Landis RJ, Boston RC. A modified logistic model to describe gadolinium kinetics in breast tumors. Magn Reson Imag 2004;22(4):467-473.
5. Sourbron SP, Buckley DL. On the scope and interpretation of the Tofts models for DCE-MRI. Magnetic Resonance in Medicine. 2011;66(3):735-45.
6. Kazerooni AF, Malek M, Haghighatkhah H, et al. Semiquantitative dynamic contrast-enhanced MRI for accurate classification of complex adnexal masses. J Magn Reson Imag. 2016.
Figures