0099
Histogram analysis of intravoxel incoherent motion MRI in predicting chemoradiotherapy response in cervical cancer1Department of Diagnostic Radiology, The University of Hong Kong, Hong Kong, Hong Kong, 2Department of Health Technology and Informatics, The Hong Kong Polytechnic University, Hong Kong, 3University of California, Berkeley, CA, United States, 4Philips Healthcare, Hong Kong, Hong Kong
Synopsis
Histogram analysis of intravoxel incoherent motion (IVIM) diffusion-weighted MRI (DWI) could be a promising quantitative approach in predicting tumour response to chemoradiotherapy (CRT) in cervical cancer. We retrospectively studied twenty-five patients with cervical cancer who had paired IVIM MRI examinations before and at week-4 of treatment. We observed that histogram skewness of true diffusion coefficient (D) prior to treatment and that a large increase in the 90th percentile of D following CRT were predictive of better CRT response.
Purpose
The purpose of this study was to determine the value of histogram indices of IVIM parameters in predicting CRT response and to determine the difference in diffusion and perfusion profiles between responder and non-responders.Methods
Twenty-five patients with newly diagnosed cervical cancer were prospectively recruited. All patients received whole-pelvis radiotherapy and concurrent chemotherapy (CRT) as the primary treatment. Two sequential MRI examinations were performed on 3.0T Achieva TX scanner, Philips Healthcare at pre-treatment (MRI-1) and week-4 of CRT (MRI-2). DWI was acquired using single-shot spin-echo echo-planar imaging in free breathing with background body signal suppression (b=0-1000 s/mm2). Parametric maps of ADC were generated; D and perfusion fraction (f) maps were calculated using non-linear least squares Levenberg-Marquardt algorithm in MATLAB (R2016a, The Mathworks Inc.). Volumetric regions of interest (VOIs) were placed to encompass the whole tumour volume and histogram parameters (skewness, kurtosis, mean, percentiles) were calculated. Primary tumour volume (PTV) was evaluated on the sagittal T2-weighted images. Tumour response to CRT was dichotomised into responder and non-responder groups, where a volume reduction of 65% in PTV was considered as responder. For univariate analysis, student’s t-test was used to compare ADC and IVIM histogram indices at MRI-1, MRI-2, and the difference across both time-points between responders and non-responders. For multivariable analysis, forward stepwise linear regression on significantly different histogram indices was used as automatic variable selection to determine significant predictors of CRT response. Prediction accuracy and optimal cut-off points was assessed by receiver operating characteristic (ROC) analysis under the leave-one-out cross-validation strategy.Results
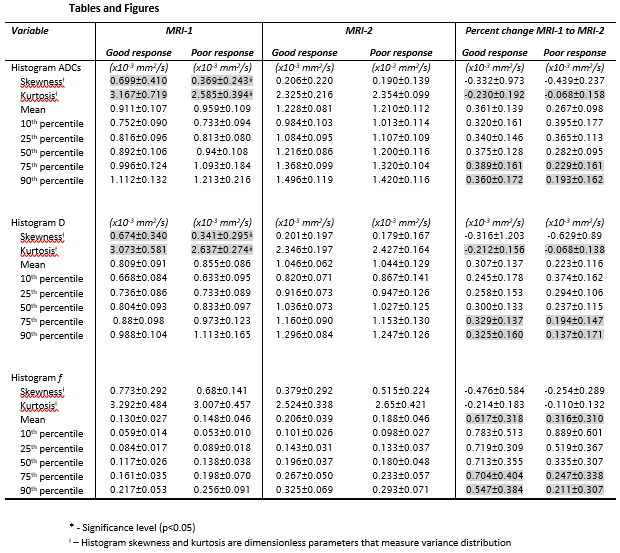
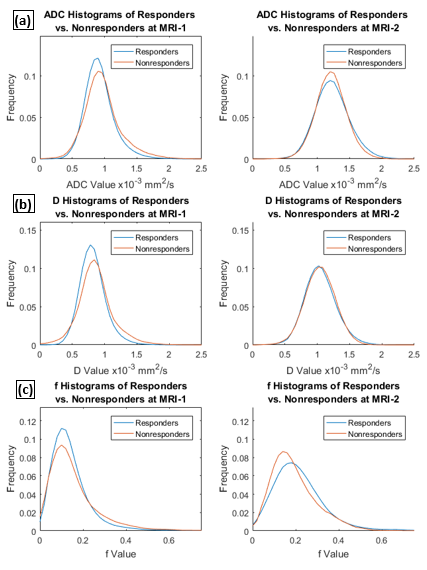
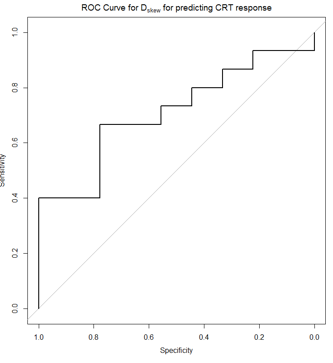
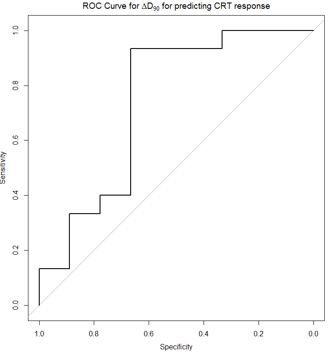
Sixteen patients were considered responders to CRT (with one patient having complete response with no residual tumour at MRI-2) and nine patients were considered as nonresponders. Results of univariate analysis are tabulated in Table 1, averaged histograms of responders vs. nonresponders in ADC, D, and f at MRI-1 and MRI-2 are plotted in Figure 1. At MRI-1, the ADCskew, ADCkurt, Dskew, and Dkurt of responders were significantly greater than those of non-responders. Automatic variable selection determined that only Dskew was a significant predictor of CRT response and achieved an AUC of 0.711 with an optimal cut-off of 0.564 (sensitivity = 0.667, specificity = 0.778) as shown in Figure 2. Following CRT, the changes in ADCkurt, ADC75, ADC90, Dkurt, D75, D90, fmean, f75, and f90 were significantly greater in responders compared to non-responders. Automatic variable selection determined that only the change in D90 was a significant predictor of CRT response and achieved an AUC of 0.741 with an optimal cut-off of 0.196 mm2/s (sensitivity = 0.933, specificity = 0.667) as shown in Figure 3.Discussion
Histogram analysis is a promising tool in quantifying spatial information in the heterogeneous microenvironment of cervical cancer and has been shown to be useful in detecting poor prognostic features [1]. A normal distribution would have kurtosis equal to three where increasing kurtosis results in sharper peaks and heavier tails. This may be interpreted as increasing image homogeneity as more pixels are concentrated in a narrower range of grey values. Observed image heterogeneity is correlated to phenotypic variation [2]. A normal distribution would have skewness equal to zero where increasing skewness results in increasingly left-shifted peaks and is a measure of the difference between the mean and median of a histogram. The observed significant difference in skewness and kurtosis of ADC and D between responders and non-responders at MRI-1 imply that pre-treatment diffusion profiles of tumours are useful in predicting CRT response. Compared to non-responders, responders have initially higher skewness and kurtosis which imply that they had significantly more restricted and homogenous diffusivity profile. The observed significant differences in the change of kurtosis, 75th and 90th percentile in ADC and D, but a lack of significant difference in the skewness of ADC and D at MRI-2 suggest the effect of treatment of responders was to reduce cellular density thereby increasing diffusivity as measured by percentiles. In comparing ADC and D, the mean and percentile histogram indices of D were lower than that of ADC, and that the trends in ADC and D were similar, in concordance with the literature [3]. While there was significant differences in the changes in fmean, f75 and f90 between MRI-1 and MRI-2 between responders and non-responders, f was ultimately not predictive of CRT response, suggesting that the main added-value of IVIM is the perfusion-free parameter D [4, 5].Conclusion
Histogram analysis of IVIM-based diffusion parameters is a potentially useful technique in predicting CRT response in cervical cancer.Acknowledgements
No acknowledgement found.References
1. Downey, K., et al., Relationship between imaging biomarkers of stage I cervical cancer and poor-prognosis histologic features: quantitative histogram analysis of diffusion-weighted MR images. AJR Am J Roentgenol, 2013. 200(2): p. 314-20.
2. Just, N., Improving tumour heterogeneity MRI assessment with histograms. Br J Cancer, 2014. 111(12): p. 2205-13.
3. Lee, J.M., et al., Pattern of lymph node metastasis and the optimal extent of pelvic lymphadenectomy in FIGO stage IB cervical cancer. Journal of Obstetrics and Gynaecology Research, 2007. 33(3): p. 288-293.
4. Kuru, T.H., et al., Intravoxel incoherent motion (IVIM) diffusion imaging in prostate cancer-what does it add? Journal of computer assisted tomography, 2014. 38(4): p. 558-564.
5. Wang, Y.-C., et al., Assessing the Early Response of Advanced Cervical Cancer to Neoadjuvant Chemotherapy Using Intravoxel Incoherent Motion Diffusion-weighted Magnetic Resonance Imaging: A Pilot Study. Chinese medical journal, 2016. 129(6): p. 665.
Figures