0095
An MRI-based assessment of the correlation between cerebral white matter changes, muscle structure, and muscle function in myotonic dystrophy1Radiology, University of Iowa, Iowa City, IA, United States, 2Neurology, University of Iowa, Iowa City, IA, United States, 3Psychiatry, University of Iowa, Iowa City, IA, United States, 4Physical Therapy and Rehabilitation Science, University of Iowa, Iowa City, IA, United States
Synopsis
The purpose of this work was to study subjects with myotonic dystrophy (DM1) utilizing MRI to assess correlations between global cerebral white matter abnormalities, muscle structure, and muscle function. MRI-based measures of white matter (fractional anisotropy), muscle structure (volume, fat fraction, T2 mapping) along with muscle function testing demonstrated several significant correlations. The combination of neuroimaging and muscle structure assessment with MRI holds considerable promise towards elucidating the relationships between CNS abnormalities and neuromuscular dysfunction.
Introduction
Myotonic dystrophy type I (DM1) is a progressive, multisystem, autosomal dominant disorder. Although the primary symptoms of classical DM1 are myotonia and muscle weakness, patients may also have a variety of cognitive impairments such as reduced intelligence, attention deficit (hyperactivity) disorder and/or mood disorders. DM1 pathophysiology is complex and the origin of cognitive, psychosocial and motor impairment remains unclear.
Brain MRI findings vary among DM1 patients ranging from no abnormalities to marked brain atrophy with severe white matter involvement.1 MRI studies have shown abnormal white matter integrity in multiple tracts, including motor pathways.2 A recent study using functional MRI showed DM1 subjects with grip myotonia had greater cerebral blood oxygen level signals during a grip task in high-order cortical motor control areas.3 Taken together, these studies support the hypothesis for CNS involvement in DM1 motor function. More importantly, CNS abnormalities may contribute to DM1 neuromuscular dysfunction. The purpose of this pilot work was to use MRI-based measures to assess correlations between global cerebral white matter abnormalities, muscle structure, and muscle function.
Methods
Informed consent was obtained in a pilot group of five subjects with classical DM1 and five healthy age/sex matched controls for comparison. In DM1 subjects, disease duration and muscle impairment rating scale (MIRS) were recorded. Bilateral images of calf muscle were acquired on a Siemens Tim Trio 3T scanner using a surface array coil and built-in spine coil. The imaging protocol was similar to those previously reported4 and included multislice T1, STIR, gradient-echo (GRE) based 3-point Dixon, and multiecho T2 sequences. Each bilateral acquisition generated 30 slices of 0.7 mm thickness with no gap in about 30 minutes of scan time.
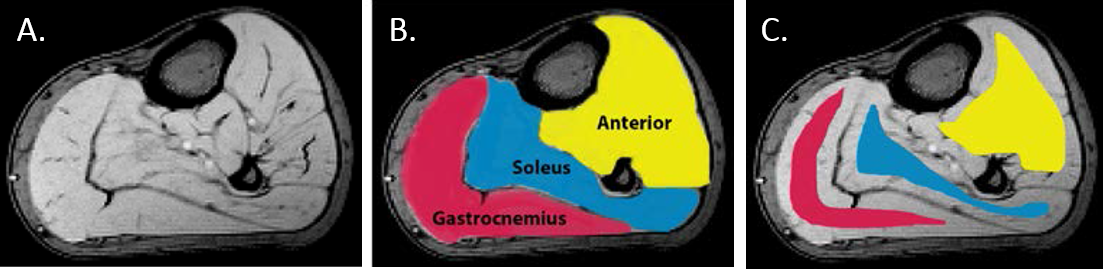
Muscle volumes were derived from tracings of GRE images (Figure 1A). Full regions of interest (ROIs) defined individual muscle volumes (Figure 1B). Quantitative total T2 maps were produced from multiecho T2 image data by a standard nonlinear curve fitting algorithm and used to assess a combination of tissue water changes and fat fraction within the muscle. Fat fraction (FF) quantification was computed from the 3-point Dixon acquisition. Eroded ROIs from the defined muscle regions were used for mean T2 and FF measurements (Figure 1C). Global cerebral fractional anisotropy (FA) was derived from 64-direction diffusion tensor imaging (DTI),5 where low FA measures indicate abnormalities in white matter structure.
Muscle function tests relied on established protocols using a custom force measurement apparatus to evaluate soleus force and fatigue.6 A custom-designed neuromuscular control evaluation system (lower extremity tracking task; LETT) was used to perform a functional weight bearing movement assessment.7 MRI-derived measures of muscle structure and function were compared by analysis of variance (ANOVA) for the two subject groups, and both MRI measurements and indices of muscle function were compared to brain FA by linear regression analysis.
Results
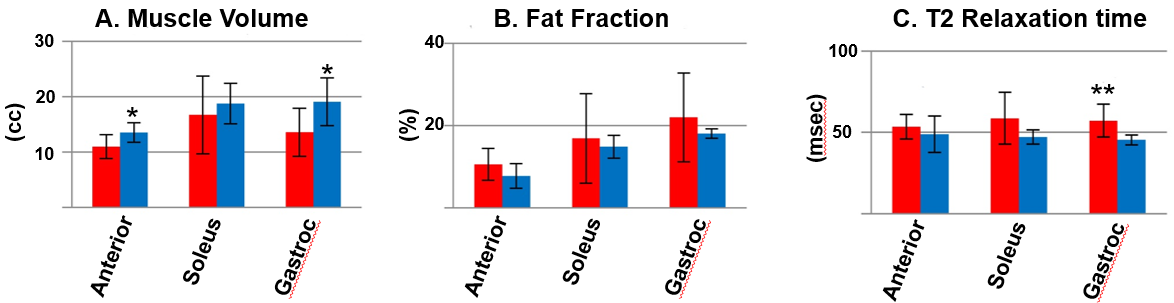
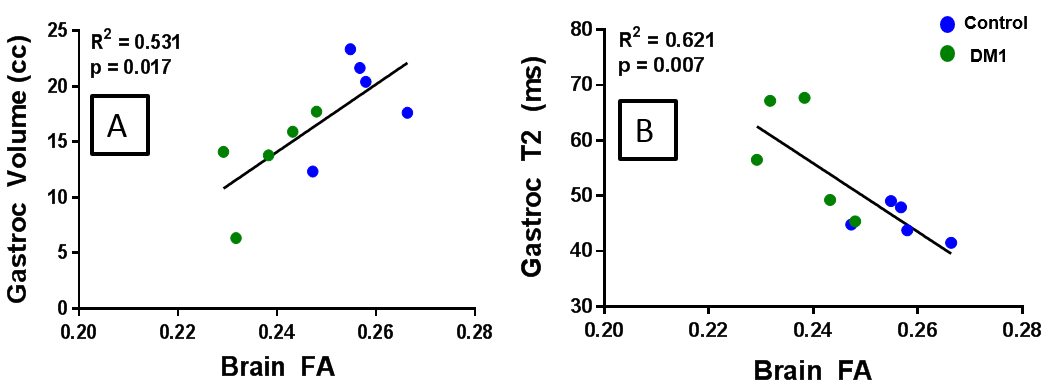
Subjects ranged in age from 34 to 58 years old (mean 43.3 yo), and DM1 subjects had a range of 1-22 years since symptom onset (mean 12.6 years) and mild to severe impairment. MRI-based characterization of muscle showed that DM1 patients had lower muscle volume, higher FF, and higher T2 compared to controls (Figure 2), with the most significant differences seen in T2 measurements. Overall, global brain FA was significantly lower in DM1 subjects compared to controls. Reduced brain FA (indicative of greater white matter abnormality) was highly correlated with both lower muscle volume and higher T2 measurements indicative of greater muscle abnormality (Figure 3). Brain FA also was highly correlated with both force and error rate in the lower extremity tracking task.Discussion
MRI-based measures of brain and muscle structure and muscle function testing demonstrated several significant correlations. These were large effect sizes in a small sample size (n=5 DM1 subjects), supporting the sensitivity of MRI of lower limb muscles to changes from DM1 pathology. The additional correlations of brain FA with both structural and functional muscle measurements suggest the CNS may contribute to neuromuscular changes in DM1. The combination of neuroimaging and muscle structure assessment with MRI holds considerable promise towards elucidating the relationships between CNS abnormalities and neuromuscular dysfunction.Acknowledgements
The University of Iowa Magnetic Resonance Research Facility granted pilot data acquisition time for this study.References
1. Conforti R, de Cristofaro M, Cristofano A, et al. Brain MRI abnormalities in the adult form of myotonic dystrophy type 1: a longitudinal case series study. Neuroradiol J. 2016;29:36-45.
2. Wozniak JR, Mueller BA, Lim KO, et al. Tractography reveals diffuse white matter abnormalities in myotonic dystrophy type 1. J Neurol Sci. 2014;341:73-8.
3. Toth A, Lovadi E, Komoly S, et al. Cortical involvement during myotonia in myotonic dystrophy: a fMRI study. Acta Neurol Scand. 2015;132:65-72.
4. Morrow JM, Sinclair CD, Fischmann A, et al. MRI biomarker assessment of neuromuscular disease progression: a prospective observational cohort study. Lancet Neurol. 2016;15:65-77.
5. Magnotta VA, Kim J, Koscik T, et al. Diffusion Tensor Imaging in Preclinical Huntington's Disease. Brain Imaging Behav. 2009;3:77-84.
6. Dudley-Javoroski S, Littmann AE, Iguchi M, et al. Doublet stimulation protocol to minimize musculoskeletal stress during paralyzed quadriceps muscle testing. J Appl Physiol 2008;104:1574-82.
7. Madhavan S, Burkart S, Baggett G, et al. Influence of age on neuromuscular control during a dynamic weight-bearing task. J Aging Phys Act. 2009;17:327-43
Figures