0091
Dynamic interleaved NMR measurements of perfusion, deoxymyoglobin and phosphorylated metabolites during ischemic and exercise paradigms in the calf and thigh muscles1NMR Laboratory, Institute of Myology, Paris, France, 2CEA, DRF, I²BM, MIRCen, Paris, France
Synopsis
NMR allows to investigate multiple aspects of physiological parameters like regional perfusion, blood and tissue oxygenation, intracellular pH or high-energy phosphate metabolism. In the past, interleaved multi-parametric multi-nuclear dynamic NMR imaging and spectroscopy of skeletal muscle was developed on prototype scanners. Here we developed an interleaved pulse sequence combining NMR acquisitions of a perfusion image, 1H deoxy-myoglobin and 31P spectra on a clinical system without any hardware modifications from the customer. We successfully evaluated this sequence in the ischemic calf muscle and exercising quadriceps muscle. Nevertheless, using a surface coil for pulsed-ASL measurements remains a limitation at this time.
Purpose
NMR allows to investigate multiple aspects of physiological parameters in vivo such as regional perfusion, blood and tissue oxygenation, intracellular pH or high-energy phosphate metabolism. Classically, NMR acquisition schemes rarely explore more than a few biological parameters which are often measured in separate experimental sessions, adding experimental variability1 on biological processes which are already multifactorial2,3. Interleaving multinuclear dynamic NMR measurements have widely been practiced on prototype or user-modified scanners4-8. Recently, interleaved multi-nuclear NMR measurements were done in a commercial scanner without hardware modifications from the user9,10. Here, the interleaved approach was expanded to enable simultaneous measurements of perfusion, deoxygenated myoglobin (dMb) and phosphorylated metabolites. Ischemia-hyperemia and exercise paradigms were evaluated in the calf and the thigh, respectively.Methods
Experimental SetupTwo healthy subjects (24 and 33 years old) participated in this study. Experiments were done on a 3-T/60-cm bore Siemens Magnetom Prisma MR system (Siemens Healthineers, Erlangen, Germany) equipped with the multi-nuclear option. A dual-tuned 1H/31P flex transceiver coil was used (RAPID Biomedical GmbH, Rimpar, Germany). The coil was wrapped around the muscle of interest with the 11-cm-diamater surface 31P coil facing either the gastrocnemius or rectus femoris muscle. Thigh exercise: The thigh was placed on an inclined plane allowing a 60° knee extension and a plastic shell with sandbags (13 kg) was placed over the leg as a load. The leg was raised and kept contracted for 3 seconds and then allowed to rest for 3 seconds. This cycle was repeated for 6 mins, ending by an isometric knee extension until exhaustion. Calf ischemia: A cuff was applied proximal to the knee for a duration of 8 mins (250 mmHg).
Interleaved NMR
One 31P (1024 complex points, 4 kHz bandwidth) and 80 1H dMb (128 complex points, 20 kHz Bandwidth, -70 ppm shift) non-localized NMR spectra were acquired during the evolution time (820 ms) of a pulsed-ASL (SATIR11) sequence generating a single 2D image (FLASH, radial read-out, 256 points, 128 spokes, 1.6 x 1.6 mm in-plane resolution, 10 mm thickness). NMRS and NMRI data sets were generated every 2 seconds (ischemic paradigm) or 3 seconds (exercise paradigm) during the 20-min experiment, the later chosen to be longer to allow movement during the sequence idle time.
Data Analysis: The raw data was reconstructed and quantified using Matlab routines developed in-house(The MathWorks, MA, USA). No motion correction was applied. 31P spectra were zero-filled to 2048 points and the dMb spectra of every data set were averaged before applying a baseline correction (exercise data only) using a polynomial fit (degree 7) downfield of the water resonance. Zero- and first-order phase corrections were applied to all spectra. Perfusion values were calculated from every alternating pair of images as described previously11. Perfusion images were reconstructed using a non-uniform FFT algorithm12.
Results
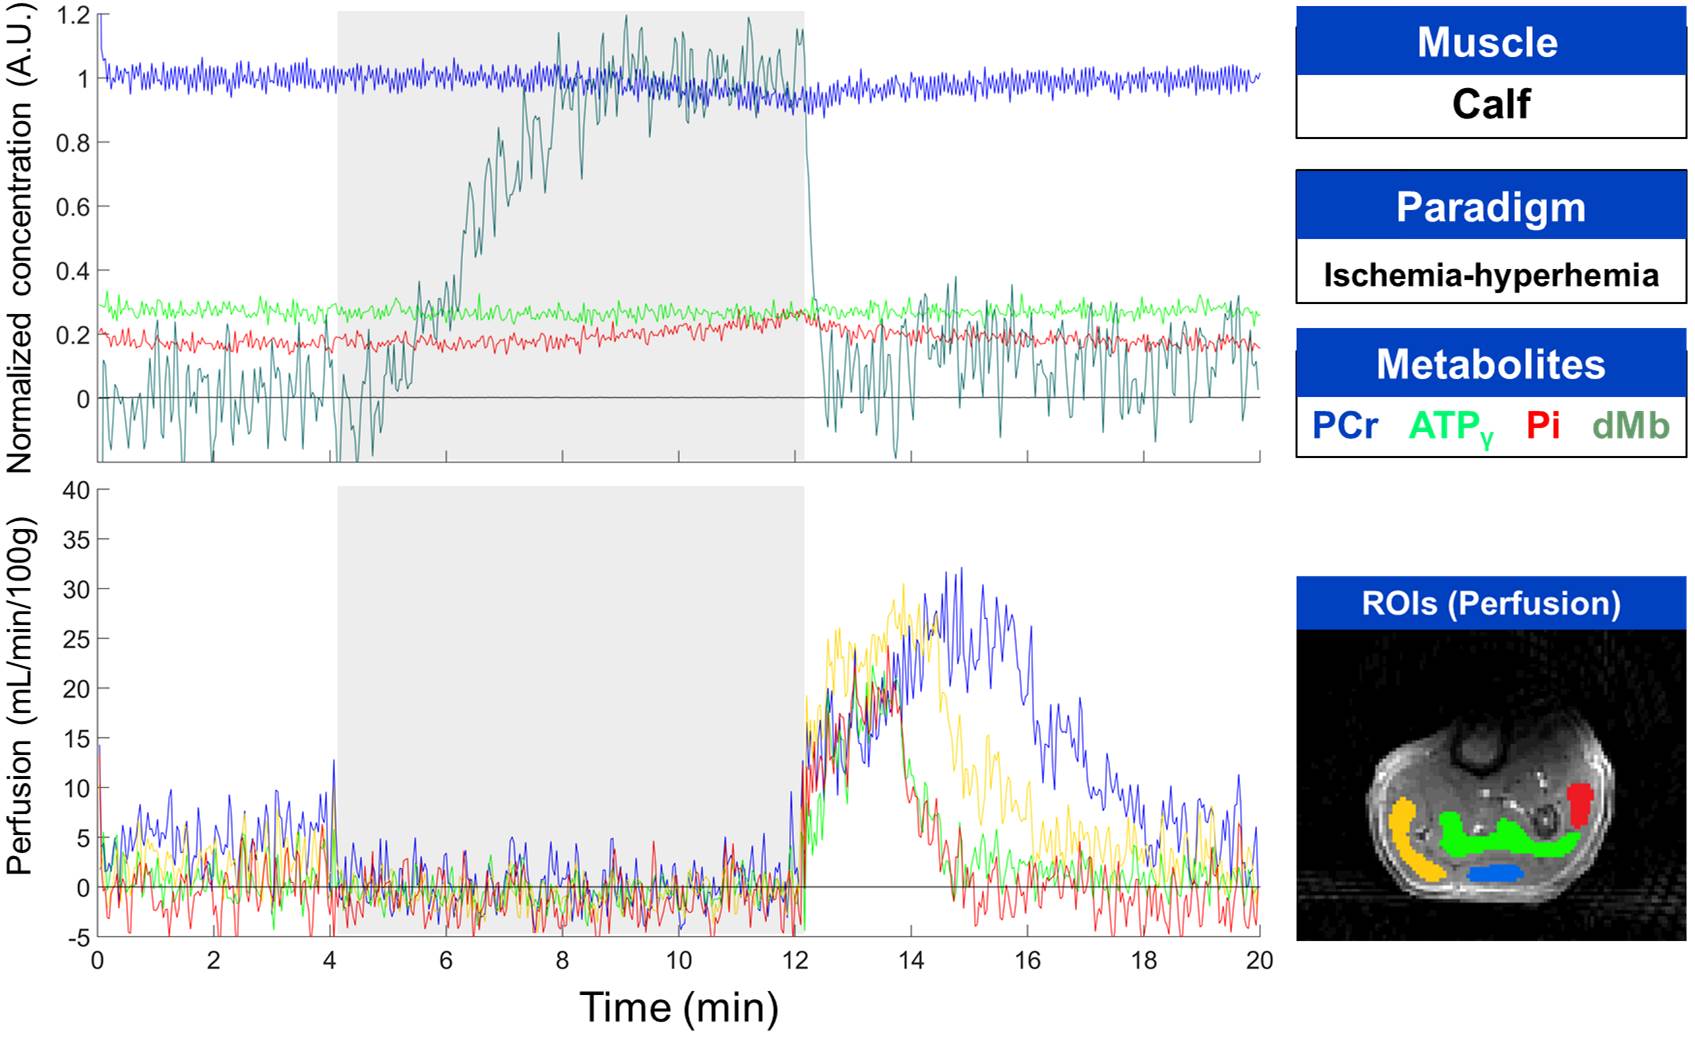
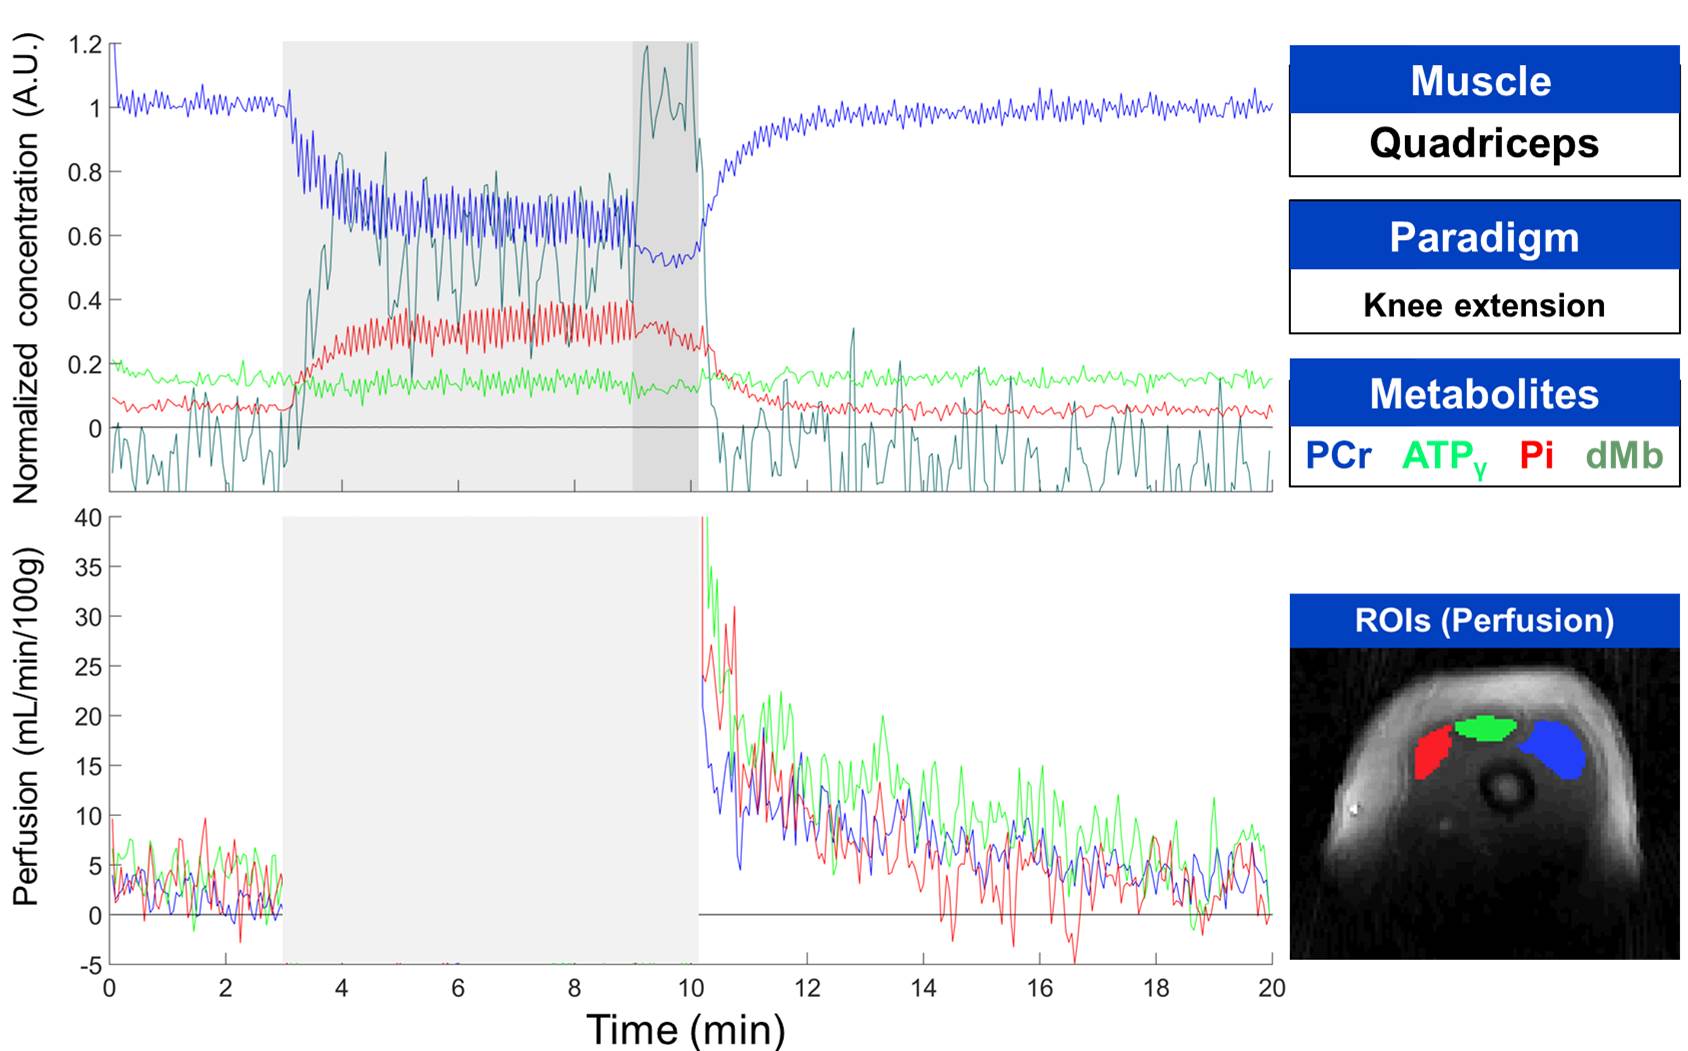
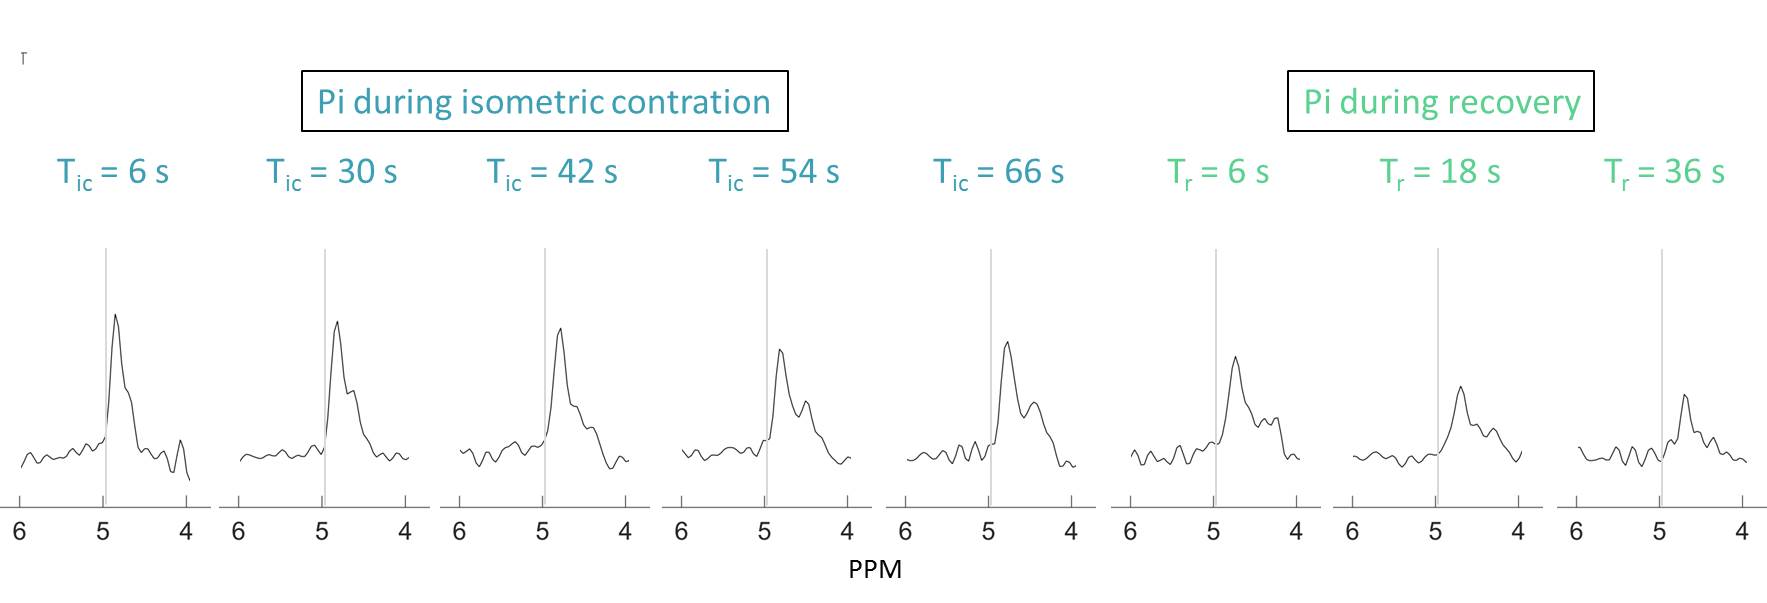
Multi-parametric time courses are shown for the calf ischemia-hyperemia and the thigh exercise, respectively in figures 1 and 2. The biochemical responses were in agreement with the literature for both calf13,14 and thigh15 muscles but peak perfusion values in the calf were lower here. In the ischemic muscle, the desaturation of myoglobin was clearly observed after 1 minute of the application of the cuff and the decrease of PCr/Pi ratio was observed upon complete myoglobin desaturation 3 mins after. Following cuff release, dMb, PCr and Pi rapidly returned to baseline levels. The increased perfusion during hyperemia showed a longer response in the gastrocnemius muscle with respect to the soleus. During the thigh muscle exercise, dMb was clearly detected during the 1-minute isometric contraction, as expected15. Notably, during this effort, splitting of the Pi resonance was observed, indicating a fast intracellular acidification during this period (figure 3).Discussion and Conclusion
A more comprehensive interleaved multi-nuclear pulse sequence was successfully implemented on a standard clinical scanner without hardware modifications. The work presented here demonstrates the feasibility of dynamic interleaved measurements with a high temporal resolution as it was previously performed in a prototype scanner7 and the possibility of adaptations to different experimental paradigms. An important limitation of this work is the reduced B1+ coverage inherent to surface coils, limiting the FOV of images and most importantly the length of the tagged bolus for perfusion measurements, inducing estimation errors16 in ASL (by the arrival of non-inverted blood into the tissue during the evolution time). To address this issue, future studies will employ a volume 1H excitation coil for an increased tagged bolus length combined with an adapted 31P transceiver.Acknowledgements
No acknowledgement found.References
1. Carlier PG, Bertoldi D et al. NMR Biomed. 2006; 19:954-967.
2. Toussaint JF, Kwong KK et al. J Appl Physiol. 1996; 81: 2221–2228.
3. Gillies RJ. NMR in Physiology and Biomedicine. Academic Press: San Diego, CA, 1994.
4. Thulborn KR, Soffe NF and Kadda G. J Magn Reson. 1981; 45: 362-366.
5. Brillaut-Salvat C, Giacomini E et al. NMR Biomed. 1997; 10(7): 315-323.
6. Meyerspeer M, Magill AW et al. MRM 2016; 76(5) :1636-1641.
7. Brillaut-Salvat C, Giacomini E et al. Cell Mol Biol (Noisy-Le-Grand). 1997; 43(5): 751-762.
8. Meyerspeer M, Krssák E et al. MAGMA. 2005; 18(5): 257-262.
9. Lopez Kolkovsky AL, Marty B et al. ESMRM. 2016; 349.
10. Bakermans AJ, Wessel CH et al. ISMRM. 2016; 2399.
11. Raynaud JS, Duteil S et al. MRM. 2001; 46 :305-311.
12. Fessler, JA & Sutton BP. IEEE Trans on Signal Processing. 2003; 51(2):560-574.
13. Duteil S, Bourrilhon C et al. Am J Physiol Regul Integr Comp Physiol. 2004; 287: R 1441-1449.
14. Englund EK, Langham MC et al. J Cardiovasc Magn Reson. 2013; 15:70.
15. Vanderthommen M, Duteil S et al. J Appl Physiol. 2003; 94:1012-1024.
16. Lipton ML, Branch, CA et al. J Magn Reson Imag. 2001; 13 :207-214.
Figures