0090
Dynamic PCr and pH imaging of the human lower leg muscle during exercise at 3T1Bernard and Irene Schwartz Center for Biomedical Imaging, Department of Radiology, New York University School of Medicine, New York, NY, United States, 2Center for Advanced Imaging Innovation and Research (CAI2R), Department of Radiology, New York University School of Medicine, New York, NY, United States
Synopsis
Dynamic phosphorous MRSI is an established non-invasive method for studying muscle metabolism. It allows quantification of the post-exercise phosphocreatine resynthesis rate, which provides insights into various physiological and pathological conditions. Due to low SNR, 31P imaging experiments are typically limited by long acquisition times relative to the metabolic recovery. We developed an imaging method to measure localized phosphocreatine resynthesis and pH changes in muscles of the lower leg following exercise at 3T with a high temporal resolution of 6 s required for an accurate estimation of quantitative phosphocreatine recovery rates.
Introduction
Phosphorous (31P) MRS enables non-invasive investigation of human skeletal muscle metabolism [1]. In particular, the rate of phosphocreatine (PCr) resynthesis following physical exercise is an index of mitochondrial oxidative phosphorylation, which is impaired in many diseases including diabetes mellitus and peripheral arterial disease [2-4]. The majority of 31P-MRS studies have used surface coils and either unlocalized or single voxel pulse sequences that yield high signal-to-noise ratio (SNR) spectra with adequate temporal resolution (~6 s) for characterizing the kinetics of PCr resynthesis. However, these techniques are limited to measuring only superficial muscle regions, and cannot differentiate between muscle groups. More recently birdcage coils combined with a spin echo imaging sequence allowed volumetric imaging, however at significantly lower temporal resolution (~24 s at 3T) [5]. The aim of this work was to develop an imaging method to measure localized PCr resynthesis and pH changes in muscles of the lower leg following exercise at 3T with a temporal resolution comparable to that of single voxel MRS sequences.Methods
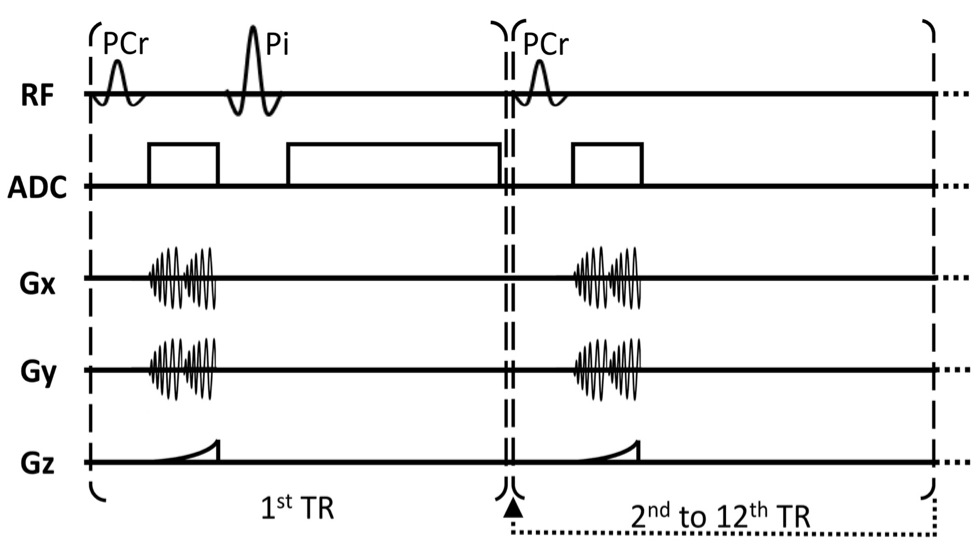
We recruited 9 healthy volunteers who were scanned on a whole body 3T clinical scanner (Siemens, Erlangen), using an in-home designed and constructed 31P/1H array [6]. The array has eight 31P receivers with spatially distinct profiles and improved SNR over a traditional volume coil, along with an integrated eight-channel 1H module that provides clinical-quality and dynamic 1H-MRI capability. Each subject performed a 90 s plantar flexion exercise using a MR compatible ergometer at approximately 40% maximum voluntary contraction. We imaged PCr using a modified frequency selective 3D non-Cartesian FLORET sequence [7] (TR=500 ms, flip angle 25°, 12 ms Gaussian pulse / 125 Hz bandwidth, 3 hubs at 45°, 4 interleaves/hub, FOV = 550 mm, 32x32x32 matrix size), which yielded 17 mm nominal isotropic resolution and 6 s temporal resolution. The relatively long T2 relaxation time of PCr (~300 ms) was exploited to improve SNR by combining signals in the imaging domain from two identical spiral readouts that were interspersed with a rewinding gradient. After PCr signal readout we used another frequency selective excitation to acquire unlocalized Pi spectra (60° flip angle, TR=6 s, 2.5 Hz spectral resolution, 10kHz bandwidth) within the same TR such that no time penalty was added (Figure 1). In order to localize the Pi spectra, we processed data independently for each coil and assigned it to a specific muscle group based on the coil proximity from co-registered 1H images.Results
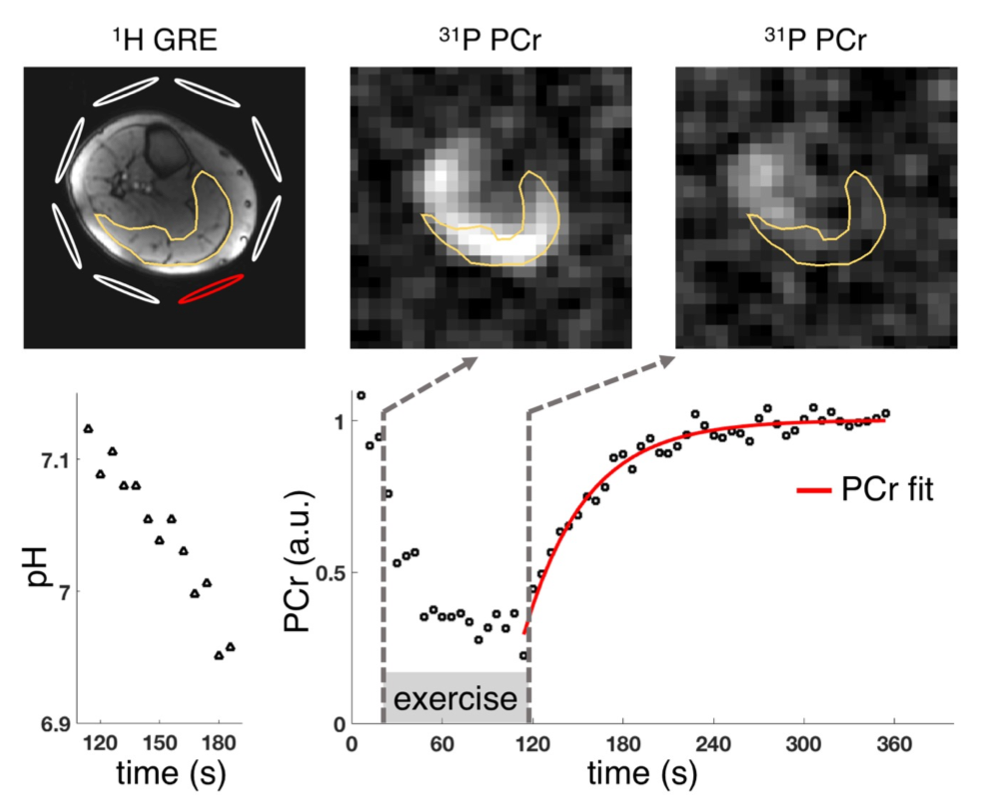
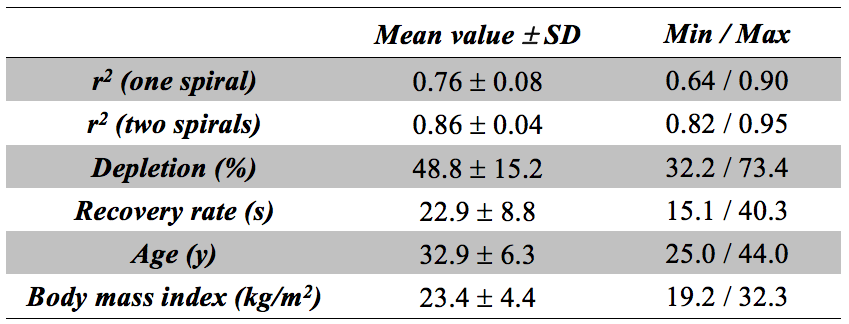
PCr signal evolution in the gastrocnemius muscle (GCM) was estimated by applying a mask from manually segmented 1H images, and the resulting PCr recovery after exercise was fitted based on a monoexponential fit model [1]. The use of a second spiral readout significantly improved SNR of PCr images and the fit quality (Table 1). PCr recovery rates following 90 s plantar flexion exercise at 0.66 Hz varied between 15 s and 40 s (n=9 healthy volunteers), depending on physiological differences between subjects, and the corresponding pH values after exercise (estimated based on chemical shift of Pi relative to PCr) were typically in range of 7.0-7.1 in the GCM. Figure 2 shows exemplary data of PCr images and time courses of PCr signal and pH in the GCM. The continuous pH reduction after exercise is consistent with recently reported findings [8].Conclusions
The combination of a novel dual-tuned 8-channel array and a time-efficient non-Cartesian imaging sequence allowed us to characterize PCr resynthesis kinetics following exercise. Our method yields superior temporal and spatial resolution compared to results reported at 3T and similar to the recent ones at 7T [9]. Additionally, it allows quantification of pH, that can significantly affect PCr recovery kinetics. The ability to perform quantitative 31P-MRI at 3T will allow us to combine this method with other clinically established 1H imaging methods, such as IDEAL water–fat separation, arterial spin labeling or post exercise BOLD imaging.Acknowledgements
This work was supported in part by NIH grant R01 DK106292 and was performed under the rubric of the Center for Advanced Imaging Innovation and Research (CAI2R, www.cai2r.net), a NIBIB Biomedical Technology Resource Center (NIH P41 EB017183).References
[1] Kemp et al. Magn Reson Q 1994;10(1):43–63.
[2] Prompers et al. NMR Biomed 2006;19:927–953.
[3] Crowther et al. Am J Physiol Endocrinol Metab 2003;284:E655–E662.
[4] Schocke et al. Vasa 2008;37:199–210.
[5] Parasoglou et al., NMR Biomed 2013;26:348-356.
[6] Brown et. al., Sci Rep 2016;6:30568.
[7] Pipe et al. MRM 2011;66:1303-1311.
[8] Fiedler et al., Sci Rep 2016; 6:32037.
[9] Schmid et al. MRM 2016;75:2324-2331.
Figures