0087
Increased muscle BOLD following exercise training in older adultsJill M Slade1, Anne Tonson2, David Hurley1, Mitchell Rozman1, George S Abela3, and Ronald A. Meyer2
1Radiology, Michigan State University, East Lansing, MI, United States, 2Physiology, Michigan State University, 3Medicine, Michigan State University
Synopsis
Functional MRI (BOLD) of skeletal muscle was used to evaluate changes in microvascular function before and after aerobic exercise training in older adults. Peak BOLD responses increased by ~30% after exercise training, supporting the use and sensitivity of BOLD MRI to assess changes in microvascular function.
Introduction
Peripheral microvascular function is clearly reduced with age (1,2,8) even when comparing sedentary young and older adults (1). This is important because declines in microvascular function may contribute to reduced muscle performance and activity limitations in aging. Furthermore, the microvasculature has been shown to be crucial in the control of blood flow (3) and microvascular dysfunction has been implicated in many chronic diseases (4,5). Blood Oxygen Level Dependent (BOLD) imaging of skeletal muscle using functional magnetic resonance imaging (fMRI) can be used to assess microvasculature function (2,6,7). Microvascular function is greater in healthy endurance trained young adults compared to sedentary young adults (8). This suggests that exercise training may be used to enhance small vessel function. The study aimed to assess changes in microvascular function using BOLD MRI in older adults following aerobic exercise training.Methods
Twenty five healthy, sedentary older adults participated in a 12-week randomized graded treadmill walking intervention (control (CON), n=13, 66±4 yrs, BMI=31±6; exercise (EX), n=16, 68±6 yrs, BMI=29±5; mean±SD). Walking was done 4 days a week for 45 minutes at 70% heart rate reserve. Controls were asked to maintain a sedentary lifestyle. GE Excite 3T MRI and a quadrature extremity coil were used to acquire images of the calf. T2* weighted images were used to acquire microvascular BOLD images using a gradient recalled echo planar sequence (TR/TE=1000/35 ms, 60 degree pulse, 1cm slice, 64x64 matrix). Maximal voluntary plantar flexion contractions (1 s in duration) were performed once every 90 s for a total of five contractions to examine contraction induced peak BOLD. Anatomical images of the entire leg were also acquired (TR/TE=600/12.4ms, 256x192 matrix). 31P MR spectroscopy was used to quantify oxidative capacity of the plantar flexor muscles before and after training. Spectra were acquired using a 12cm surface coil placed under the calf (51.7MHz, TR=3s. 2500Hz sweep, 60° pulse). Subjects performed 30-s of plantar flexion at 0.7 Hz for a total of 20 contractions. BOLD responses of the soleus muscle were averaged over the highest 2-4 contractions with respect to BOLD response and force. MRS data were processed with JMRUI AMARES algorithm. A monoexponential model was used to fit the time constant of phosphocreatine recovery following exercise. Repeated measures ANOVA was used to assess differences between groups with significance at p <0.05.Results and discussion
Peak post-contraction BOLD response in the soleus increased by ~30% in EX (PRE= 103.5±1.4%, POST=104.5±1.6%) compared to CON (PRE: 103.6±1.9%, POST: 103.6±1.7%); Fig. 2, a significant interaction was present between time and group, p = 0.019. Muscle oxidative capacity (tau,s) of the plantar flexors improved by 34% for EX compared to CON (Fig. 3); a significant interaction was present over time between groups, p = 0.001. These findings show that age related declines in small vessel function can be improved with moderately intense exercise. BOLD MRI can be used to evaluate changes in microvascular function.Acknowledgements
Supported by NIH AG042041References
(1) Slade JM, Noble K et al., Med Sci Sport Exerc 46(S5): S354, 2014. (2) Slade JM, Towse TF, et al., J Appl Physiol 111(5):1361-71, 2011. (3) VanTeeffelen JW, and Segal SS. Am J Physiol Heart Circ Physiol 290: H119-127, 2006. (4)Robbins JL, Jones et al., J Appl Physiol 111(1):81-6, 2011. (5) Vithian K, and Hurel S. Clin Med 10: 505-509, 2010. (6) Meyer RA, Towse TF, et al., NMR Biomed 17:392–398, 2004. (7) Towse TF, Slade JM, et al., J Appl Physiol 111(1): 27-39, 2011. (8) Hughes WE, Ueda K, et al., Physiol Rep. 3(8): e12516, 2015.Figures
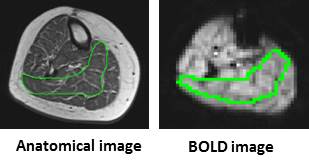
Fig.1 Sample images
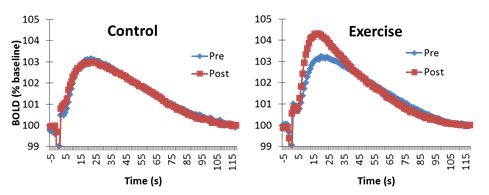
Fig.2 Time course of contraction
induced BOLD response before (pre) and after (post) 12 weeks of exercise training.
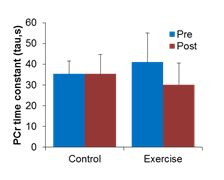
Fig.3 Muscle oxidative capacity assessed with
31P MRS before (pre) and after (post) exercise training.