0080
Effects of RF pulse profile and within-slice phase dispersion on accuracy of MR fingerprinting with balanced SSFP readout1National Taiwan University, Taipei, Taiwan, 2Radiology, Veterans General Hospital, Taipei, Taiwan, 3Graduate Institute of Biomedical Electronics and Bioinformatics, National Taiwan University, Taipei, Taiwan, 4Radiology, University of Cambridge, Cambridge, United Kingdom, 5Electrical Engineering, National Taiwan University, Taipei, Taiwan, 6Computer Science and Engineering, National Sun Yat-Sen University, Kaohsiung, Taiwan, 7Radiology, University Medical Center Freiburg, Freiburg, Germany
Synopsis
To investigate the effects of within-slice phase dispersion and RF pulse profile on quantitative relaxation mapping using MR fingerprinting with balanced steady-state free precession readout, simulations based on Bloch equations were performed assuming uniform distributions of off-resonance frequency (widths from 0, 1.0, to 2.0 Hz) and imperfect slice profiles of sinc-shaped RF pulses without and with side lobes. Results showed that slight within-slice phase dispersion by 1 to 2 Hz resulted in prominent T2 under-estimations, particularly at large T2 values. Slice profile imperfection led to under-estimations of T1, which became greater as regional off-resonance frequencies increased.
Introduction
MR fingerprinting (MRF) is a promising technique for rapid quantitative relaxation mapping 1,2. For MRF with unbalanced steady-state free precession (SSFP) readout, the effects of RF slice profile have been systematically evaluated, whereas within-slice phase dispersion has no influence on MRF accuracy 2,3. A trade-off with unbalanced SSFP MRF is the reduced sensitivity to off resonance, hence hampering applications to fat-water separation 4. This study therefore investigates the effects of within-slice phase dispersion and RF pulse profile on accuracy of MRF using balanced SSFP readout.Methods
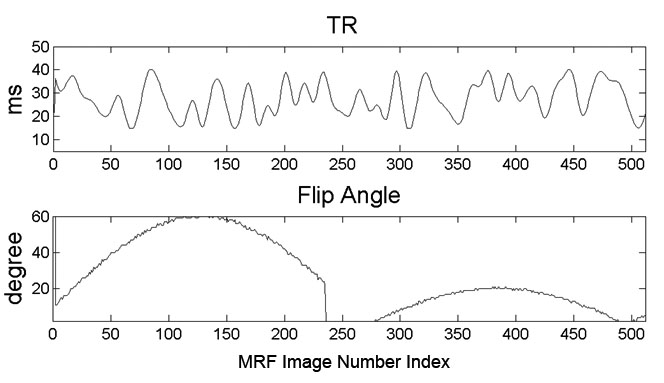
The MRF pulse sequence in Fig.1 with bSSFP readout was used for simulations based on Bloch equation. Uniform distributions of off-resonance frequency with widths of 0 Hz (exactly on-resonance), 1.0 Hz (off-resonance from –0.5 to +0.5 Hz), and 2.0 Hz (–1.0 to +1.0 Hz) were assumed. The signal evolution pattern of an image voxel was then obtained by numerical integration of those corresponding to different frequencies (0.1 Hz stepping). Similarly, RF slice profile effects were investigated by numerical integration of signal evolution patterns at different flip angles, the weights of which were computed from sinc-shaped RF pulses without and with one side lobes. The initial inversion pulse was assumed to be ideal with adiabatic passage.
MRF dictionary was created assuming that each voxel contained one single spin isochromat. Tissue parameters included T1 (100 to 2000 ms), T2 (10 to 500 ms), and off-resonance frequency (–500 to +100 Hz). The size of the dictionary was 603,729 x 512. The orthogonal matching pursuit method 1,5 was used to find the best match between the simulated signals and the dictionary template. Imaging experiments were performed in the brain in vivo on healthy adults at 3T (slice thickness 3 mm, 256x256, FOV 220 mm) using the scheme in Fig.1 with Cartesian k-space coverage.
Results
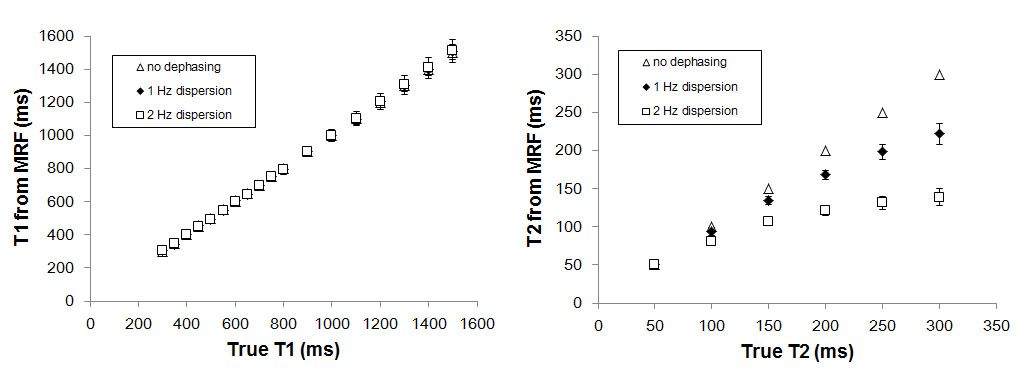
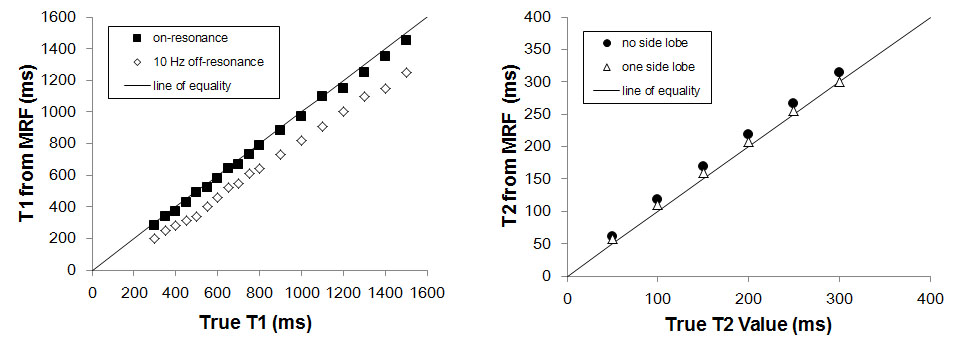
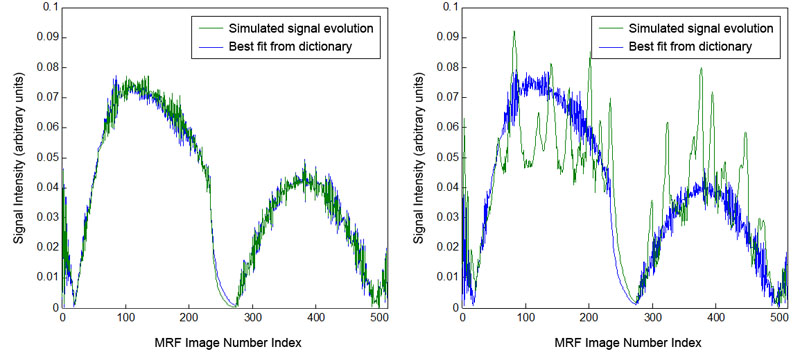
Within-slice phase dispersion up to 2 Hz did not affect MRF T1 measurements (Fig.2, left). But accuracy in MRF T2 was prominently influenced, particularly at large T2 values (Fig.2, right). The degree of T2 under-estimation worsened with increasing widths of off-resonance distribution. In contrast, imperfect slice profile affected T1 to a greater extent than T2 (Fig.3). While T1 estimations by MRF in the presence of imperfect slice profile showed good accuracy when there were no off-resonance effects (errors well explainable by quantization errors for dictionary construction), a 10-Hz off-resonance led to prominent T1 under-estimation (Fig.3, left). Interestingly, MRF estimation of the off-resonance frequency remained accurate, with errors less than 1 Hz under all conditions simulated in this study (not shown), even though the signal evolution pattern substantially deviated from its best match template at 10 Hz off-resonance (Fig.4).
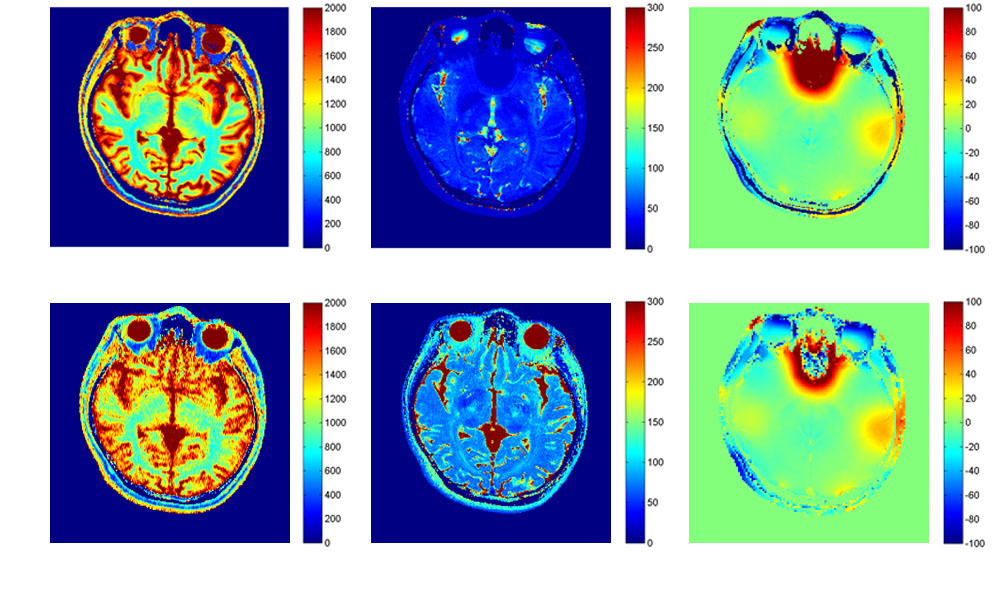
The T1, T2, and off-resonance maps from the in vivo MRF experiments (from left to right, top row in Fig.5) with their corresponding maps obtained via conventional inversion recovery, multi-echo, and Dixon approaches (bottom row in Fig.5) showed highly consistent T1 and off-resonance maps between MRF and conventional results. The T2 map from MRF, however, was seen to exhibit substantially lower values than the multi-echo results, suggesting that within-slice phase dispersion affected MRF relaxation mapping substantially. MRF T1 under-estimation shown in the simulations was not noticeable in the experimental results likely due to on-resonance in most of the regions.
Discussion
The incremental line broadening simulated in this study was at least an order of magnitude less than that encountered in situations when unbalanced SSFP readout is used 2,3, but close to what can be achieved in single-voxel MR spectroscopy in vivo with automatic local shimming. Therefore, MRF with balanced SSFP readout would likely face a situation close to what we have investigated in this work. The increased sensitivity to within-slice phase dispersion with balanced SSFP could potentially be solved by making the pulse sequence fulfilling the pseudo SSFP criteria 6. On the other hand, deviations from the designated flip angle at the slice boundaries due to RF profile effects were shown to affect T1 quantification, a situation in distinct difference from MRF with unbalanced SSFP readout where erroneous T2 estimations were reported 2,3. While slice profile information could be incorporated into the dictionary 3, unknown within-slice phase dispersion would necessitate another variable dimension, increasing the computational load drastically.
We conclude that MRF using balanced SSFP readout in the presence of within-slice phase dispersion and imperfect slice profile both lead to inaccuracies in quantitative relaxation mapping. Developments of MRF based on balanced SSFP readout therefore need to take these effects into considerations.
Acknowledgements
SCC, TML, and HWC received support in part from the Ministry of Science and Technology under grant MOST 104-2221-E-002-209-MY3. SCC is a recipient of DAAD pre-doctoral student exchange Scholarship. JML received support from the Ministry of Science and Technology under grant MOST 105-2811-E-002 -049. CWK received support in part from the Ministry of Science and Technology under grants MOST 105-2221-E-110-037 and MOST 102-2918-I-110-002.References
1. Ma D, Gulani V, Seiberlich N, Liu K, Sunshine JL, Duerk JL, et al. Magnetic resonance fingerprinting. Nature 2013;495:187-92.
2. Chen Y, Jiang Y, Pahwa S, Ma D, Lu L, Twieg MD, et al. MR Fingerprinting for rapid quantitative abdominal imaging. Radiology 2016;279:278-86.
3. Buonincontri G, Sawiak SJ. MR fingerprinting with simultaneous B1 estimation. Magn Reson Med 2016;76:1127-35.
4. Chiu SC, Chung HW, Buechert M, Bock M. MR fingerprinting: fat-water separation imaging, in Proceedings of the 22nd Annual Meeting of ISMRM, Milan, Italy. 2014. p.1668.
5. Tropp JA, Gilbert AC. Signal recovery from random measurements via orthogonal matching pursuit. IEEE Trans Inf Theory 2007;53:4655-66.
6. Assländer
J, Glaser SJ, Hennig J. Pseudo steady-state free precession for
MR-Fingerprinting. Magn Reson Med 2016. doi:10.1002/mrm.26202.
Figures