0078
Measurement of Small-Tip RF Pulses using Gradient Reversal1University of Southern California, Los Angeles, CA, United States
Synopsis
We present a simple pulse sequence for measuring RF pulses in the small-tip regime. In a uniform phantom, results matched closely (<4% difference) with a pick-up RF coil over a broad range of RF pulse parameters, with one outlier (6.1% difference). In non-uniform phantoms and in-vivo, this method combined with an outer-volume suppression (OVS) pre-pulse produced accurate (<3% difference) measurements compared to a pick-up RF coil. Speed and lack of additional hardware could make the proposed method ideal for RF pre-distortion correction.
Purpose
RF subsystem imperfections can cause subtle but significant errors in the envelope of transmitted RF pulses. This can lead to errors in excitation performance including excitation of unwanted side-lobes when using multi-band pulses1. Recent work has focused on measurement using RF pick-up coils and pre-distortion of RF waveforms, which requires extra hardware, processing, and synchronization1-3. We investigate a simple method to measure RF waveforms without added hardware or synchronization. We call this Gradient Reversal Approach to Evaluate RF (GRATER) because it relies on reversal of an excitation gradient, and inclusion of pre-pulses that limit signal to a relatively homogeneous section of the sample being imaged. This method was inspired by problem 6.4 from Reference 4.Theory
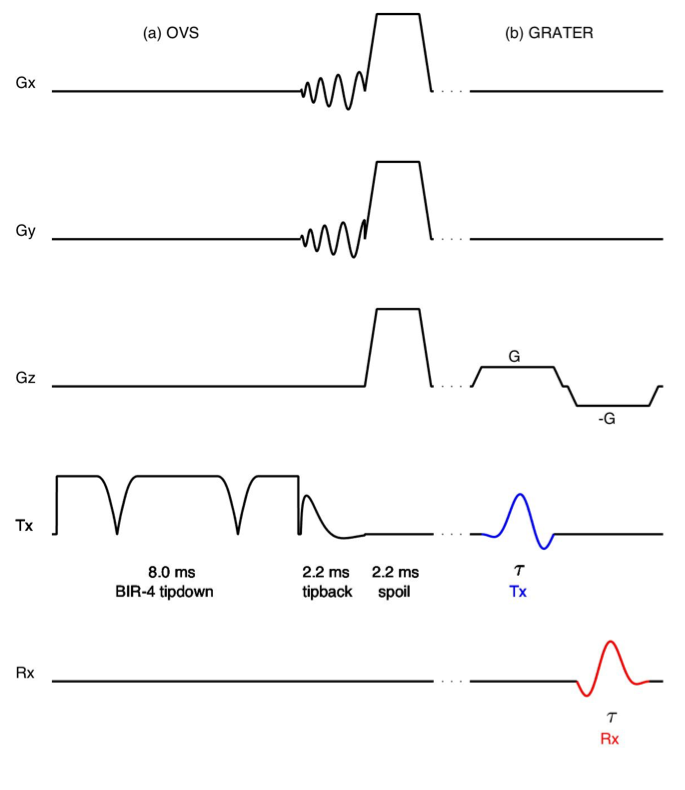
Figure 1b shows the GRATER pulse sequence. A constant gradient during RF excitation is inverted during signal reception. Assuming a uniform object along the axis of this gradient, the small tip-angle approximation, negligible off-resonance ($$$\Delta\omega$$$), negligible T2* effects, and letting t=0 correspond to the beginning of the readout gradient with amplitude -G, the transverse magnetization M and acquired signal s(t) follow:$$M(\tau,z)\propto e^{-i\omega (z)\tau}\int_{s=0}^{\tau}e^{i\omega (z)s}\gamma B_1(s)ds\quad [1]$$ $$s(t)\propto\int_{z}M(\tau,z)e^{-i\omega (z)t}e^{-i\Delta \omega (z)t}e^{-t/T2^*(z)}dz$$ $$\propto B_1(T-t) \quad [2]$$ M is proportional to the Fourier transform of the RF pulse and s(t) is proportional to Fourier transform of M, essentially revealing a time-reversed version of the RF pulse. Under these ideal circumstances, the signal s(t) provides an experimental measurement of the true transmitted RF waveform. In-vivo, we anticipate that a homogenous region can be found such that an outer-volume suppression (OVS) pulse5 (figure 1a) can be used to eliminate signal from neighboring regions, allowing for reasonable in-vivo RF measurement.Methods
Experiments were performed on a GE HDxt 3T scanner using the body coil. DAQ sampling and RF transmit rates were matched for easy comparison of measured vs. expected (programmed) waveforms. Region-of-interest shimming was performed to mitigate off-resonance. Echo times were minimized to mitigate T2* effects. RF waveforms were simultaneously measured using GRATER and an external pick-up coil, demodulated, and filtered as described by Zhu et al1. The pick-up coil was used as a reference. Measured waveforms were normalized with respect to their maximum amplitude and compared to the programmed waveform. GRATER waveforms were corrected for off-resonance shifts and T2* decay.
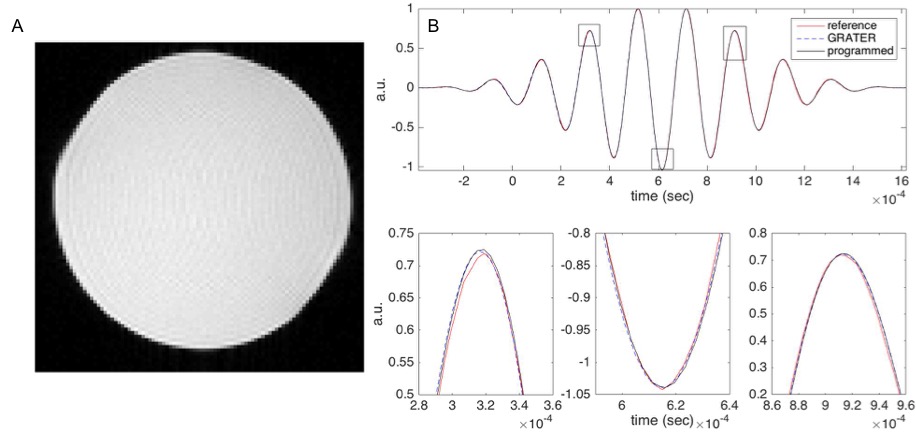
To demonstrate GRATER in near-ideal conditions, measurements were made in a 27 cm diameter uniform sphere with several multi-band pulses. Pulse parameters: 2 msec pulses, 500 points, 2-band with FA=30 or 5-bands with FA=5, and TBW=2,4,6, or 8. Pulses were designed in MATLAB using rf_tools6.
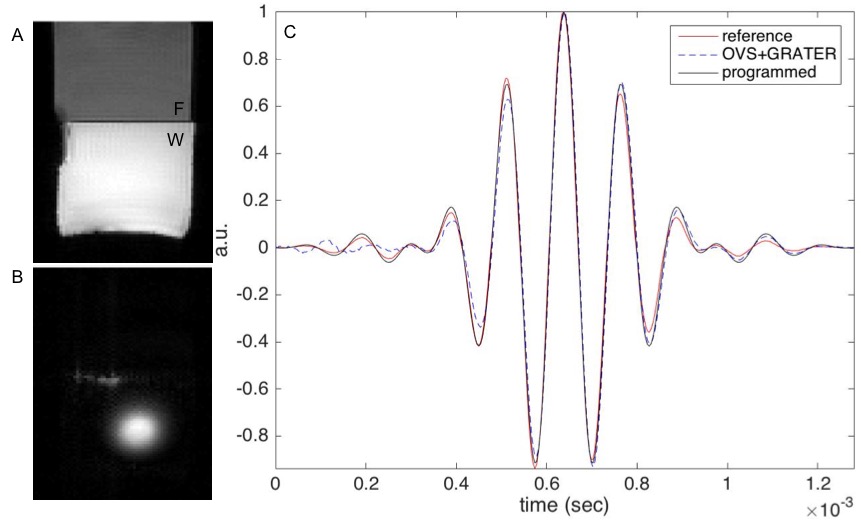
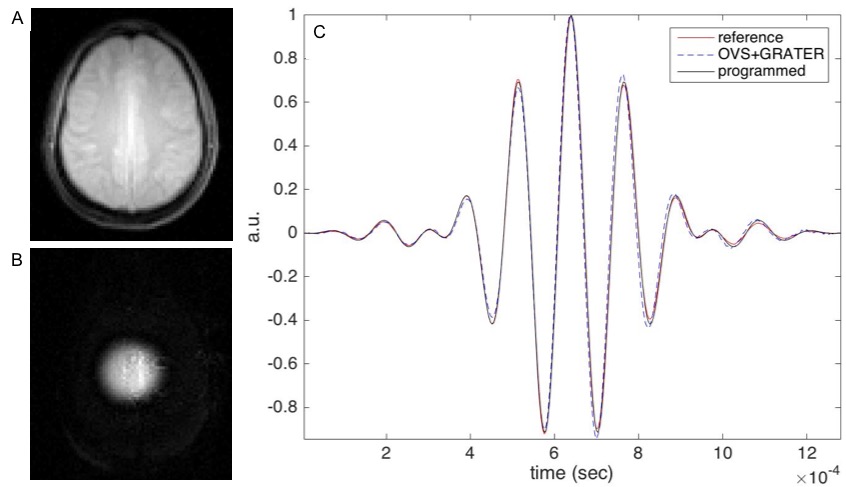
To demonstrate GRATER with and without an OVS pre-pulse5 under non-ideal conditions, measurements were made in a fat-water (FW) phantom and in-vivo using pulse parameters: 1.28 msec, 320 point, 2-band, TBW-4, and FA=15. When using OVS+GRATER, measurements were averaged over 64 trials to compensate for the lower SNR. FW phantom experiments were performed to demonstrate a scenario with significant off-resonance; the OVS pulse was centered on water. In-vivo experiments were performed to demonstrate a scenario with mild off-resonance; an axial brain slice above the ventricles was chosen in 2 volunteers.
Results
In the uniform ball phantom, GRATER measurement, reference (pick-up coil) measurement, and programmed RF waveforms matched closely (NRMSE<4%) in all but one case (2-band, TBW-4, NRMSE=6.1%) over the range of parameters given in the methods. See figure 2 for an example waveform. This indicates the accuracy of GRATER and pick-up coil approaches.
Figure 3 contains results from the FW phantom experiment. Despite the presence of significant off-resonance, measurements using GRATER and GRATER+OVS were similar in shape to the programmed waveform. Figure 4 contains results from in-vivo experiments.
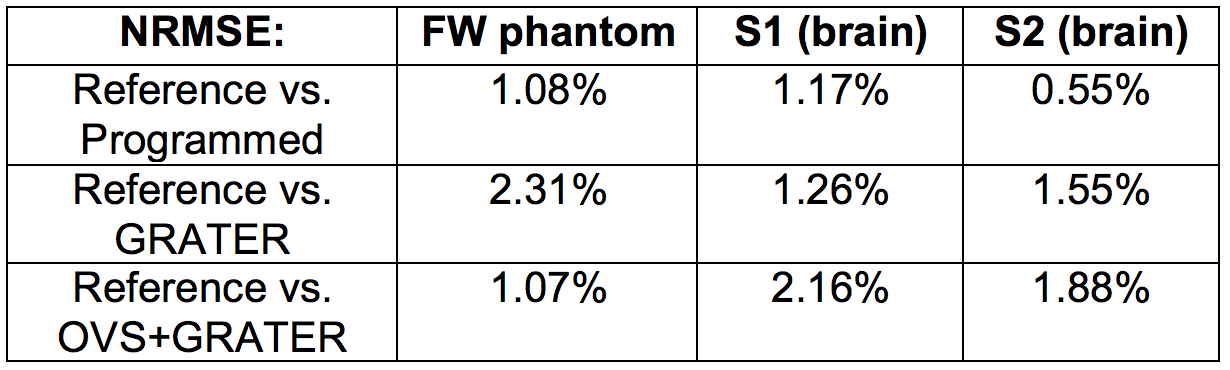
Table 2 summarizes NRMSE values for the phantom and in-vivo experiments. There was ~1% difference in reference vs. programmed measurements. After correcting for off-resonance and T2* effects by shifting and exponentially weighting the measured data, reference vs. GRATER and reference vs. OVS+GRATER measurements differed by <2.5%.
Discussion
GRATER is a new method for measuring the envelope of small-tip RF excitation waveforms, without the need for extra hardware or synchronization. In uniform phantom experiments, we demonstrate the accuracy of GRATER to <3.7% difference for RF pulses with different flip angles, different TBW, and different numbers of excitation bands, with the exception of one unresolved outlier. The FW phantom and in-vivo experiments demonstrate GRATER measurements with <2.5% difference. It is not clear that an OVS pre-pulse improves GRATER measurements. In the future, we plan to use GRATER for measurement and correction of RF amplifier distortion.Acknowledgements
We thank Kangrong Zhu for helpful discussions about RF system imperfections, and thank Dwight Nishimura for inspiring this method through homework question 6.4 in his textbook [4].References
[1] Zhu K et. al., RF Amplifier Nonlinearity Correction for Multiband RF pulses, 23rd ISMRM; p. 3763, 2015
[2] Stang P et. al., RF Sensor Considerations for Input Predistortion Correction of Transmit Arrays, 18th ISMRM; p.44, 2010
[3] Stang P et. al., Vector Iterative Predistortion: An auto-Calibration Method for Transmit Arrays, 17th ISMRM; p.395, 2009
[4] Nishimura D., Principles of Magnetic Resonance Imaging, Lulu Publishing, Ch. 6; p.119-132, 1996
[5] Smith T. and Nayak K., Reduced Field of View MRI with Rapid, B1-Robust Outer Volume Suppression, Magn Res Img., Vol 67(5); p. 1316-1323, 2011
[6] Pauly J. et al, Parameter Relations for the Shinnar Le-Roux Selective Excitation Pulse Design Algorithm (NMR Imaging), IEEE Trans. Med. Img., Vol 10(1); p.53-65, 1991
Figures