0076
Quantitative BOLD With Interleaved Acquisitions for Estimation of Extravascular $$$R_2’$$$ and Intravascular $$$R_2$$$ With Phase-Sensitive CSF Suppression1Radiology, University of Pennsylvania, Philadelphia, PA, United States
Synopsis
In the qBOLD technique, the accuracy of local deoxygenated blood volume and hemoglobin oxygen saturation (Yv) maps is potentially degraded due to high coupling of the two parameters in the model. As an alternative, the QUIXOTIC method measures local Yv by selectively capturing venular spins via T2-prepared velocity-selective-spin-labeling. However, CSF signals, if not suppressed, may impair accuracy of venular blood T2 estimation. In this work, extravascular R2’ and intravascular R2 mapping methods are interleaved to reduce estimation uncertainty in the qBOLD model while the accuracy of preliminary venular T2 estimates from the latter is further enhanced via phase-sensitive CSF suppression.
Background & Purpose
Local estimation of deoxygenated blood volume (DBV) and hemoglobin oxygen saturation (Yv) can be achieved using the quantitative BOLD (qBOLD) method1, in which a series of gradient echoes acquired on either side of spin echo (SE) formation is fitted to a model for temporal evolution of extravascular signals in the presence of blood vessel networks, valid under the static dephasing regime2, as: $$$S(t)=S_0e^{-R_2t-DBV\cdot f(t/t_c)}$$$(Eq. 1) where $$$t^{-1}_c=\frac{4\pi}{3}\gamma \cdot B_0 \cdot \Delta \chi_0 \cdot Hct \cdot (1-Y_v)$$$ and $$$\Delta \chi_0$$$ is the susceptibility difference between fully oxygenated and deoxygenated red blood cells. The characteristic function, f(x), behaves as quadratic or linear in its argument for x<<1 and x>>1, respectively2. However, the estimation uncertainty in qBOLD remains substantial due to high coupling between DBV and Yv in the model, potentially leading to physiologically implausible parameter estimates3. An alternative approach used here for Yv mapping is to measure intravascular T2 and convert it to Yv via T2-Yv calibration4 as in QUIXOTIC5 . Here, venular blood T2 is measured voxel-by-voxel by selectively capturing post-capillary spins with T2-prepared velocity-selective spin labeling (T2-prep/VSSL). However, cerebrospinal-fluid (CSF) flowing at speeds comparable to venular blood contributes partially to control/label signals, potentially resulting in inaccurate venular T2 estimates. Thus, the purpose of this work was to develop a pulse sequence that enables CSF-suppressed venular T2 estimation while utilizing the corresponding Yv map as prior information in the qBOLD model fitting to reduce estimation uncertainty.Methods
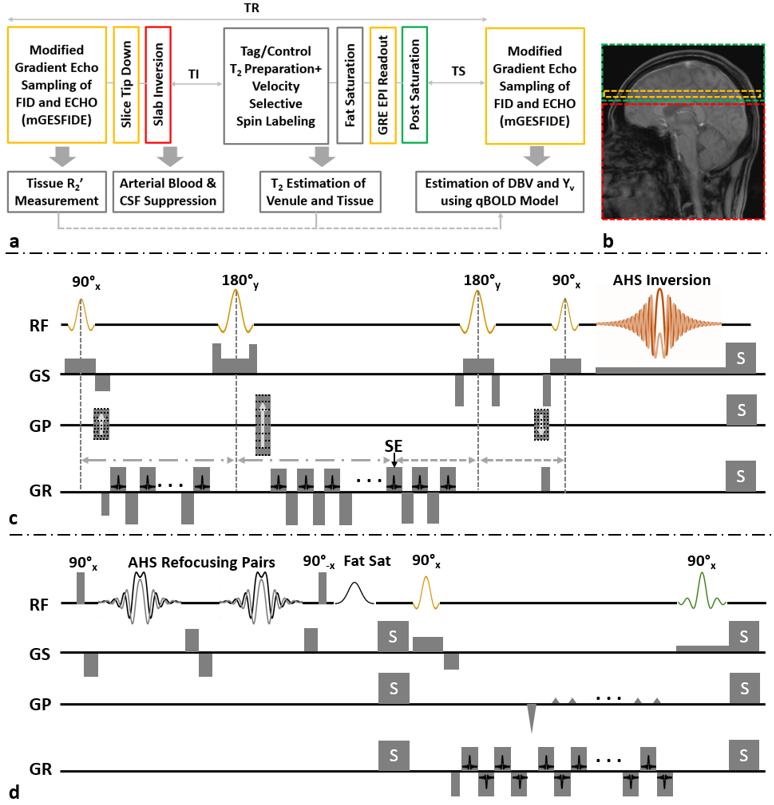
Pulse sequence: The proposed pulse sequence is composed of six consecutive components (Fig. 1): 1) modified gradient-echo-sampling-of-FID-and-ECHO (mGESFIDE)6 for qBOLD-based parameter estimation, 2) slice-selective tip-down with a pair of 180° and 90° RF pulses which restores magnetization along the negative z-axis, 3) slab inversion for nulling arterial spins entering the imaging slice from the neck, 4) T2-prep/VSSL Tag/Control pairs alternating every other TR for isolation of venular singals in difference images, 5) gradient-echo-planar-imaging for rapid readout, and 6) post-saturation of a distal slab including the imaging plane.
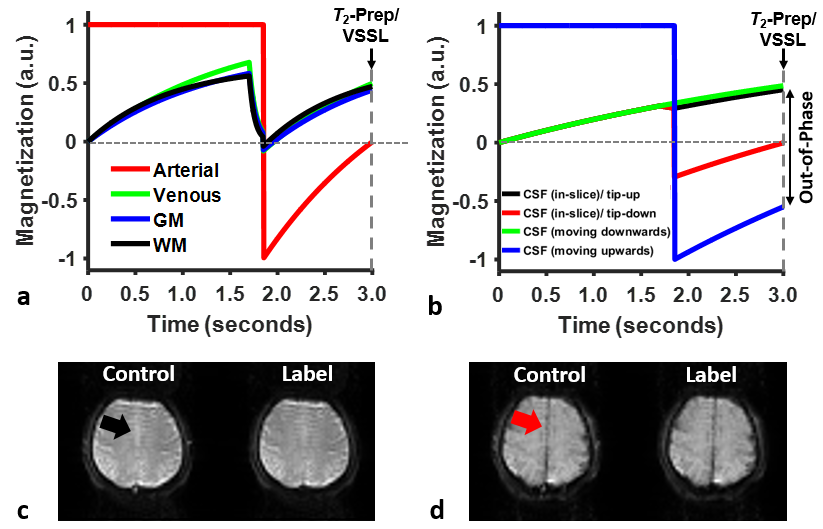
Phase-sensitive CSF suppression in T2-prep/VSSL images: CSF signals are suppressed in T2-prep/VSSL images via combined effects of components 2), 3), and 6). Following the mGESFIDE acquisition, CSF spins still remaining in the imaging slice are aligned anti-parallel to the longitudinal direction by the tip-down module, thereby being nulled along with arterial blood at the time of T2-prep/VSSL application (Figs. 2a,b). Spins moving upwards toward the imaging slice are inverted by the slab-inversion RF pulse while those moving downwards toward the imaging plane are intact, leading to opposite-phase signal cancellations between the two populations (Fig. 2b).
Experiments: The effect of the slice tip-down module on T2-prep/VSSL singals was investigated in comparison to a slice tip-up counterpart. Data was acquired in a healthy volunteer at 3T (Siemens Tim Trio) using the proposed pulse sequence with a 12-channel head coil. Common imaging parameters : TR = 3000ms, slab-inversion time = 1150ms, post-saturation time = 1670ms, FOV = 240mm2, slice thickness = 10mm, matrix size = 642, and imaging time = 10min. Parameters specific to mGESFIDE: TE at SE = 48ms, number of echoes = 32, echo spacing = 1.5ms; parameters specific to T2-prep/VSSL: cutoff velocity = 2cm/s and number of T2 preparations = 4 with preparation times = 30, 60, 90, and 120ms.
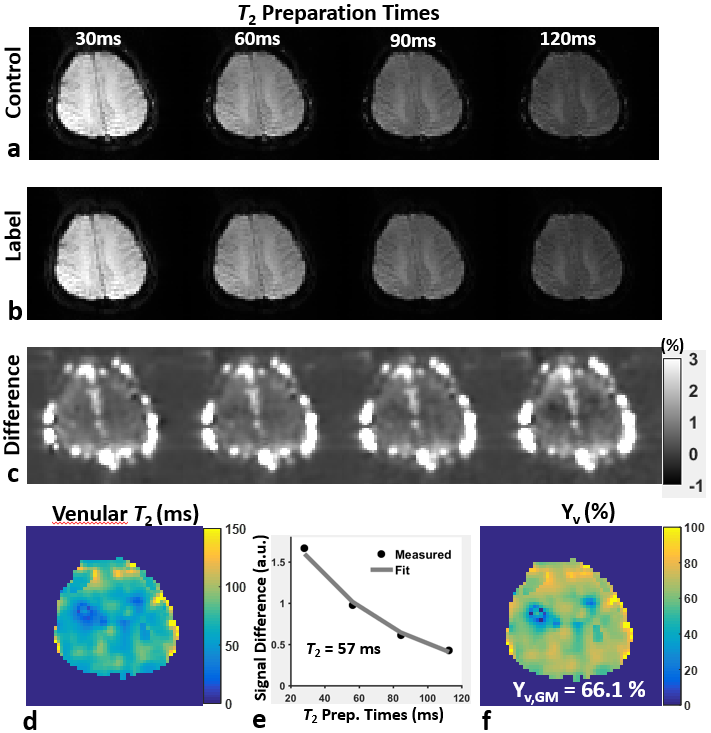
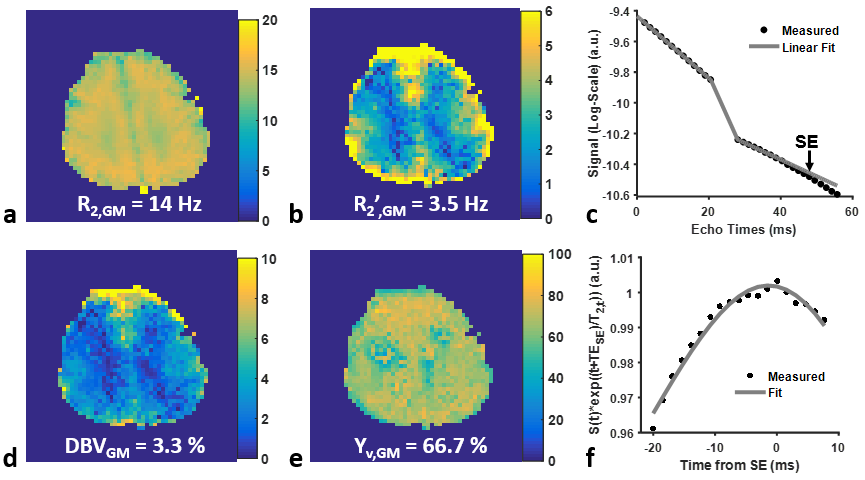
Data processing: For T2-prep/VSSL data, control/label subtraction images were smoothed with a Gaussian kernel of 10 mm FWHM, and subsequently fitted voxel-by-voxel to a mono-exponential decay model. The estimated venular T2 value in each voxel was then converted to a corresponding Yv through the model in Ref. 7. R2 of tissues (R2,t) was also estimated using control/label averages. For mGESFIDE data, the effect of background macroscopic field inhomogeneity was eliminated with an additionally acquired B0 map1. Functional parameters were estimated by fitting signals after the 180° RF pulse to Eq. (1) while the Yv and R2,t maps derived via T2-prep/VSSL were employed as prior information, yielding extravascular R2’, DBV, and refined Yv maps.
Results
Figures 2c,d show a pair of control/label images in T2-prep/VSSL following slice tip-up (Fig. 2c) and tip-down (Fig. 2d) modules. CSF signals are effectively suppressed with the tip-down pulses. Figure 3 shows four sets of images in T2-prep/VSSL and fitting results. Figure 4 represents final maps of R2,t, R2’,t, DBV, and Yv, along with fitted curves in a representative voxel.Conclusion
The proposed method combines extravascular R2’ and intravascular R2 mapping methods to reduce estimation uncertainty in the qBOLD model while the accuracy of preliminary venular T2 estimates from the latter is further improved via phase-sensitive CSF suppression. The results, while plausible, require more extensive validation.Acknowledgements
NIH grant RO1-HL122754 and RO1-HL109545.References
1. He X, Yablonskiy DA. Quantitative BOLD: mapping of human cerebral deoxygenated blood volume and oxygen extraction fraction: default state. Magn Reson Med. 2007;57:115-126.
2. Yablonskiy DA, Haacke EM. Theory of NMR signal behavior in magnetically inhomogeneous tissues: the static dephasing regime. Magn Reson Med. 1994;32:749-763.
3. Christen T, Pannetier NA, Ni WW, Qiu D, Moseley ME, Schuff N, Zaharchuk G. MR vascular fingerprinting: a new approach to compute cerebral blood volume, mean vessel radius, and oxygenation maps in the human brain. NeuroImage. 2014;89:262-270.
4. Wright GA, Hu BS, Macovski A. Estimating oxygen saturation of blood in vivo with MR imaging at 1.5 T. J Magn Reson Imaging. 1991;1:275-283.
5. Bolar DS, Rosen BR, Sorensen AG, Adalsteinsson E. Quantitative imaging of extraction of oxygen and tissue consumption (QUIXOTIC) using venular-targeted velocity-selective spin labeling. Magn Reson Med. 2011;66:1550-1562.
6. Ma J, Wehrli FW. Method for image-based measurement of the reversible and irreversible contribution to the transverse-relaxation rate. J Magn Reson B. 1996;111:61-69.
7. Lu H, Xu F, Grgac K, Liu P, Qin Q, van Zijl P. Calibration and Validation of TRUST MRI for the Estimation of Cerebral Blood Oxygenation. Magn Reson Med. 2012;67:42-49
Figures