0075
Clinically viable FAST-T2 based whole brain myelin water content mapping: T1 validation and initial MS lesion study1Radiology, Weill Cornell Medical College, New York, NY, United States, 2Neurology, Weill Cornell Medical College, New York, NY, United States
Synopsis
The objectives of this study were to validate the accuracy of FAST-T1 mapping required for myelin water content (MWC) mapping, and to demonstrate the feasibility of fast MWC mapping in MS patients. FAST-T1 provides whole brain T1 map in 3 min, which was in excellent agreement with that obtained with the reference IR-FSE method. MWC mapping in 20 MS patients showed a consistent increase in water content in MS lesions (10.7% on average), accompanied by 62.8% increase in T1 and 44.6% decrease in MWC when compared to the contralateral NAWM.
Purpose
Myelin water fraction (MWF), defined as the ratio of the myelin water to the total water within a voxel, is a quantitative biomarker of demyelination which highly correlates with the myelin loss measured by histopathology in MS (1-3). Recently, an efficient pulse sequence called Fast Acquisition with Spiral Trajectory and adiabatic T2prep (FAST-T2) has been developed to provide reliable whole brain MWF mapping in only 4 min (4). Being a relative measurement, however, MWF can be confounded by pathological changes in the voxel water (5). Absolute myelin water content (MWC, measured in ml of water per ml of tissue) can be obtained from MWF by referencing the water signal from a voxel to that of CSF (pure water) after correcting for differences in T1 relaxation time, coil sensitivity, and excitation flip angle (6). FAST-T2 can be modified to allow rapid mapping of these parameters (7). The objectives of this study were to 1) validate the accuracy of FAST-T1 mapping required for MWC mapping, and 2) demonstrate the feasibility of MWC mapping in MS.Methods
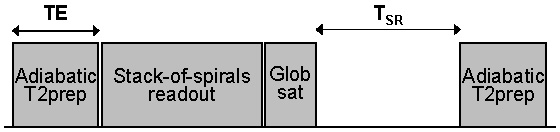
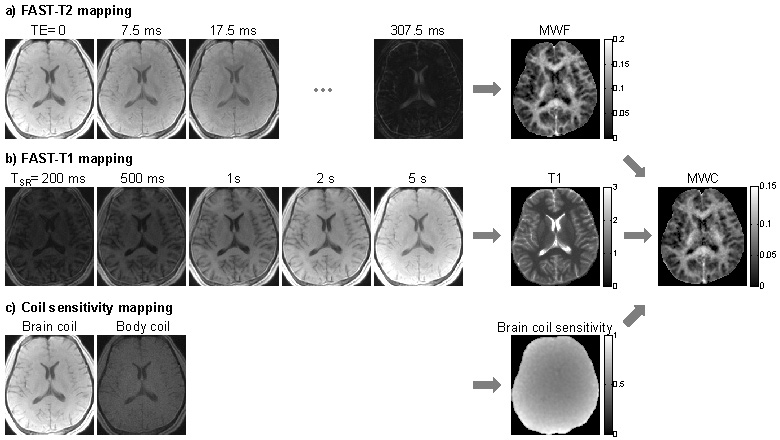
FAST-T2 based MWC mapping. The accuracy of T2 quantification using FAST-T2 has been validated7. For rapid T1 mapping, the modular FAST-T2 sequence (Fig.1) is modified by turning off T2prep and varying the saturation recovery time (FAST-T1). Figure 2 shows the main steps involved in brain MWC mapping using this approach. At 3T, correction for RF flip angle inhomogeneity is also necessary. Accordingly, FAST-T1 was modified to perform rapid Look-Locker imaging and the effective flip angle a was computed using the equation: 1/T1LL = 1/T1 - ln(cos(a))/TR, where T1LL is the time constant of the saturation recovery signal.
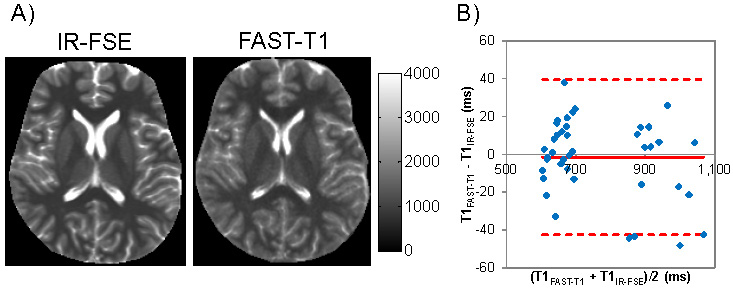
FAST-T1 validation experiment. The accuracy of 3D spiral FAST-T1 mapping was evaluated by comparing with the gold standard 2D inversion recovery fast spin echo (IR-FSE) method in 5 healthy brains. Five saturation times (0.2, 0.5, 1, 2 and 5 sec) and five inversion times (0.05, 0.2, 0.5, 1.1, 2.3 and 10 sec) were used for FAST-T1 and IR-FSE, respectively. T1 maps were computed using mono-exponential fitting and regional T1 values were obtained in five major WM and three major GM structures for comparison.
Lesion MWC study in MS patients. The developed fast whole brain MWC mapping (10 min) was evaluated in 20 consecutive MS patients (6 men, 14 women, mean age 45.7±12.4 years, disease duration 9.7±6.6 years) who underwent routine brain MRI at 3T (Siemens Skyra). MWF maps were extracted using a spatially constrained non-linear least squares algorithm (4). Brain WC and MWC maps were then computed by referencing the FAST-T2 signal at TE=0 to that of CSF after correcting for T1, coil sensitivity and flip angle differences (Fig.2). WC and MWC values were obtained for lesions and the normal appearing WM (NAWM) on the contralateral mirror site.
Results
Figure 3 shows examples of T1 maps and the Bland-Altman plot of regional brain T1 values obtained with FAST-T1 and IR-FSE, demonstrating similar visual quality and excellent T1 agreement (±40 ms limits of agreement with negligible bias). Note that IR-FSE acquires single slice in 17 min, while FAST-T2 provides whole brain coverage (28 slices) in only 3 min.
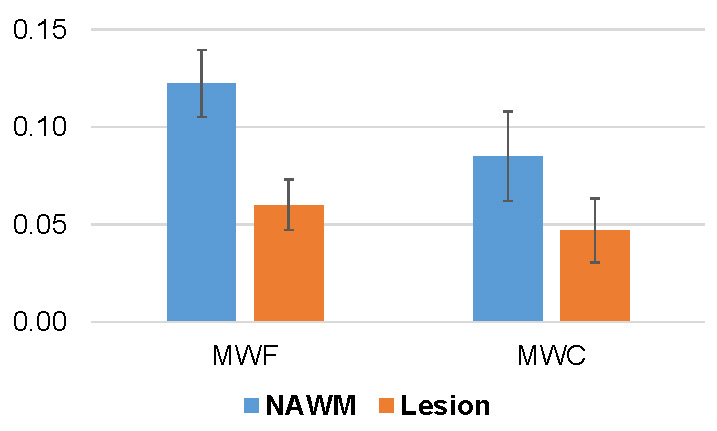
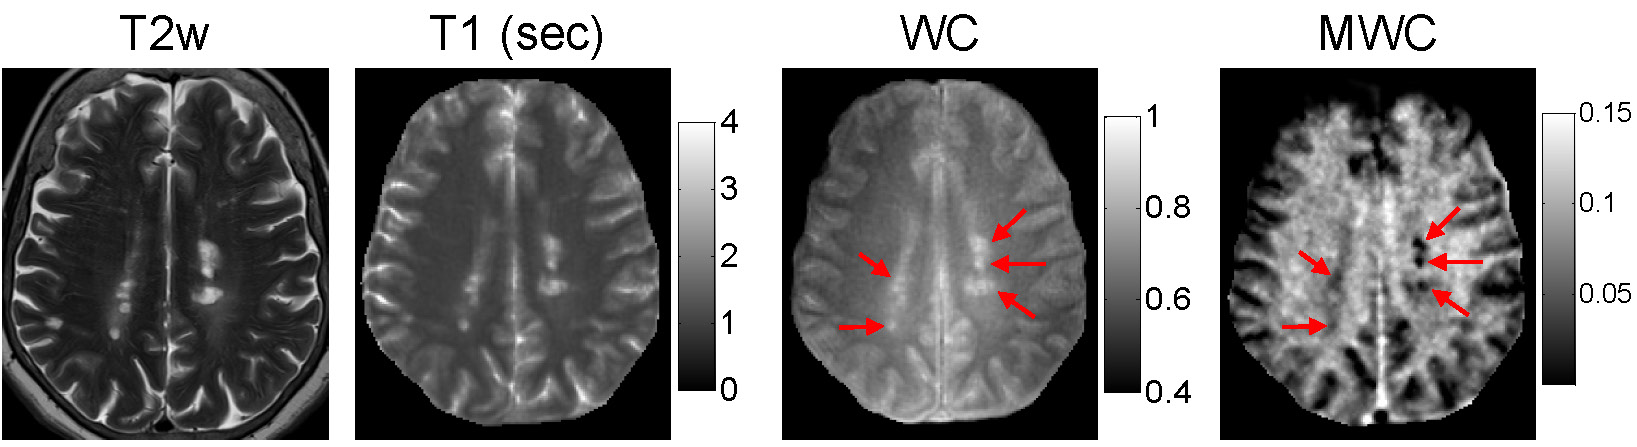
A total of 29 T2 hyperintense and T1 non-enhancing lesions were identified. There was a consistent increase in WC in all lesions compared to that in contralateral NAWM (from 0.71±0.04 to 0.78±0.06, or 10.7% in relative term), accompanied by a 62.8% increase in tissue T1 (from 1055±71 ms to 1716±270 ms). Lesion MWF was found to decrease by 50.7% on average compared to NAWM, while lesion MWC decreased by 44.6% (Fig.4). This discrepancy between MWF and MWC reduction could be attributed to the increased voxel water in lesions. Figure 5 shows an example of T2w anatomical image as well as T1, WC and MWC maps in one subject, demonstrating good visual quality.
Discussion
Our data have demonstrated that FAST-T1 can provide fast and accurate T1 mapping of brain tissues, which is enabled by SNR efficient 3D spiral data sampling. Our initial experience with fast whole brain MWC mapping in the clinical setting has been promising, demonstrating the feasibility of FAST-T2 based approach for lesion myelin quantification. Unlike MWF, MWC provides an absolute measure of tissue myelin water, therefore is arguably more robust against the dilution effect in edematous lesions. Future work will be focused on applying FAST-T2 based MWC mapping to acute lesions and validate MWC measurements in ex vivo MS brains.Conclusion
FAST-T2 based MWC mapping is feasible clinically in 10 min and potentially provides more robust measures of myelin content.Acknowledgements
No acknowledgement found.References
1. MacKay A, Whittall K, Adler J, Li D, Paty D, Graeb D. In vivo visualization of myelin water in brain by magnetic resonance. Magn Reson Med 1994;31(6):673-77.
2. Laule C, Kozlowski P, Leung E, Li DK, Mackay AL, Moore GR. Myelin water imaging of multiple sclerosis at 7 T: correlations with histopathology. Neuroimage 2008;40(4):1575-80.
3. Kolind SH, Madler B, Fischer S, Li DK, MacKay AL. Myelin water imaging: Implementation and development at 3.0T and comparison to 1.5T measurements. Magn Reson Med 2009;62(1):106-115.
4. Laule C, Vavasour IM, Moore GR, Oger J, Li DK, Paty DW, MacKay AL. Water content and myelin water fraction in multiple sclerosis. A T2 relaxation study. J Neurol 2004;251(3):284-93.
5. Nguyen TD, Deh K, Monohan E, et al. Feasibility and reproducibility of whole brain myelin water mapping in 4 minutes using Fast Acquisition with Spiral Trajectory and adiabatic T2prep (FAST-T2) at 3 Tesla. Magn Reson Med 2016;76(2):456-65.
6. Neeb H, Ermer V, Stocker T, Shah NJ. Fast quantitative mapping of absolute water content with full brain coverage. Neuroimage 2008;42(3):1094-109.
7. Nguyen TD, Pandya S, Spincemaille P, et al. Fast absolute myelin water mapping without an external water standard. Proc ISMRM 2015;10. Nguyen TD, Wisnieff C, Cooper MA, Kumar D, Raj A, Spincemaille P, Wang Y, Vartanian T, Gauthier SA. T2 prep three-dimensional spiral imaging with efficient whole brain coverage for myelin water quantification at 1.5 tesla. Magn Reson Med 2012;67(3):614-21.
Figures