0074
Mitigating the Effect of Magnetization Transfer in Magnetic Resonance Fingerprinting1Advanced Clinical Imaging Technology, Siemens Healthcare AG, Lausanne, Switzerland, 2Department of Radiology, University Hospital (CHUV), Lausanne, Switzerland, 3LTS5, École Polytechnique Fédérale de Lausanne, Lausanne, Switzerland, 4Siemens Medical Solution USA, Pittsburgh, PA, United States, 5New York University School of Medicine, Bernard and Irene Schwartz Center for Biomedical Imaging, Department of Radiology, New York, NY, United States, 6Center for Advanced Imaging Innovation and Research (CAI2R), Department of Radiology, New York University School of Medicine, New York, NY, United States, 7Siemens Medical Solutions USA, Inc., Boston, MA, United States
Synopsis
Magnetic Resonance Fingerprinting (MRF) is a powerful technique for the quantification of relaxation parameters, and ideally provides correct estimates independent from the sequence used. In this work, we show that the quantification can be influenced by the pulse duration or, equivalently, the pulse bandwidth. This behavior, which we hypothesize to be related to magnetization transfer (MT) effects, is shown for the PnP-MRF sequence. We propose a first approach to encode MT effects in the MRF sequence and to model MT effects in the reconstruction, showing that this mitigates the bias in the resulting relaxation estimates.
Purpose
In this work, we demonstrate that the quantification of T1 and T2 values in magnetic resonance fingerprinting (MRF)1,2,3 measurements can be influenced by magnetization transfer (MT) effects. These effects can, however, be incorporated into the MRF model. We therefore suggest here a generalized signal model taking MT effects into account as well as corresponding improvements for the MRF sequence design.Methods
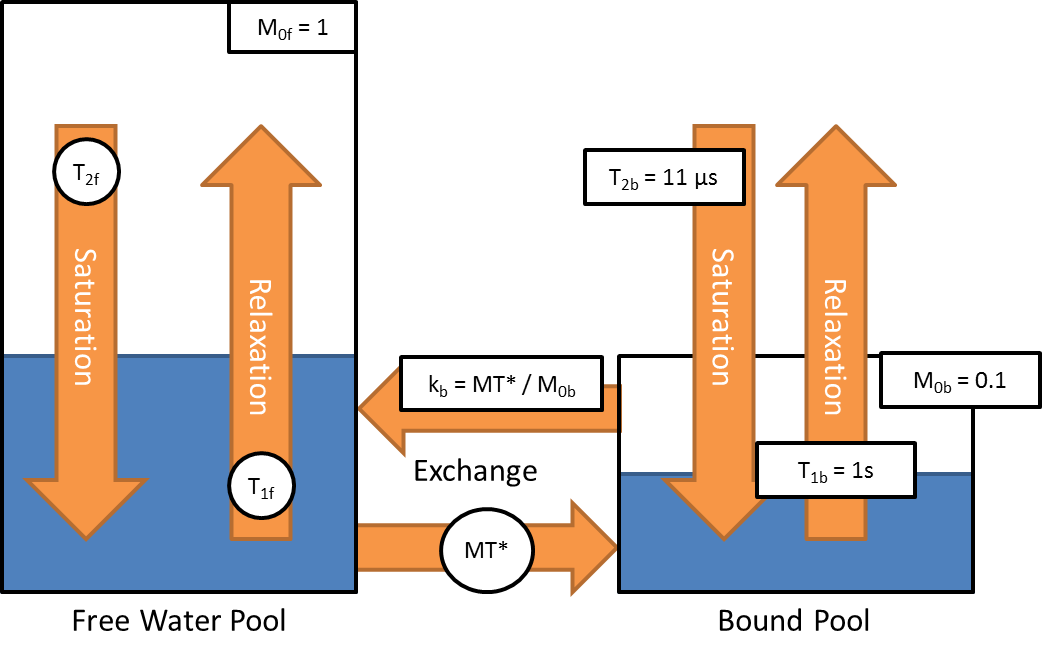
MT is a combination of dipolar effects and chemical exchange between free water and water protons bound to macromolecules. Therefore, it is usually modeled using two pools of spins4. Typically, the resonance frequencies of the bound-pool are distributed over a much broader bandwidth than the radio-frequency (RF) pulse. Therefore, increasing the pulse bandwidth, e.g. by shortening the pulse duration, will result in a stronger MT effect even if only resonant RF pulses are used.
We scanned one healthy volunteer using two different prototype implementations of the radial PnP-MRF sequence to demonstrate the impact of MT effects on the quantitative measurements. The first two datasets were obtained with a standard PnP-MRF sequence (fixed pulse duration 2ms or 4ms). These two datasets were reconstructed using a single spin-pool dictionary, derived using the extended phase graph formalism to simulate signals corresponding to different T1, T2, and B1+ values with consideration of the slice profile.
Additionally, two PnP-MRF datasets were acquired where the pulse duration was changed during the acquisition (from 2ms to 4ms, and 1.5ms to 3ms) to better differentiate MT from T2 effects. Furthermore, to reconstruct these datasets, the model for the dictionary was extended to incorporate a two-pool model with MT between the pools. To reduce the number of unknown parameters in the model, we assumed a fixed size and relaxation time for the bound-pool compartments. The final dictionary now contains T1, T2, B1+, and MT*, where MT* is a factor that represents the compound effects of relative pool size and exchange rates. A detailed illustration of the model is shown in Figure 1.
All experiments were performed on a Magnetom Skyra using the standard 20-channel head/neck coil (Siemens, Erlangen, Germany). The study was approved by our institutional review board.
Results & Discussion
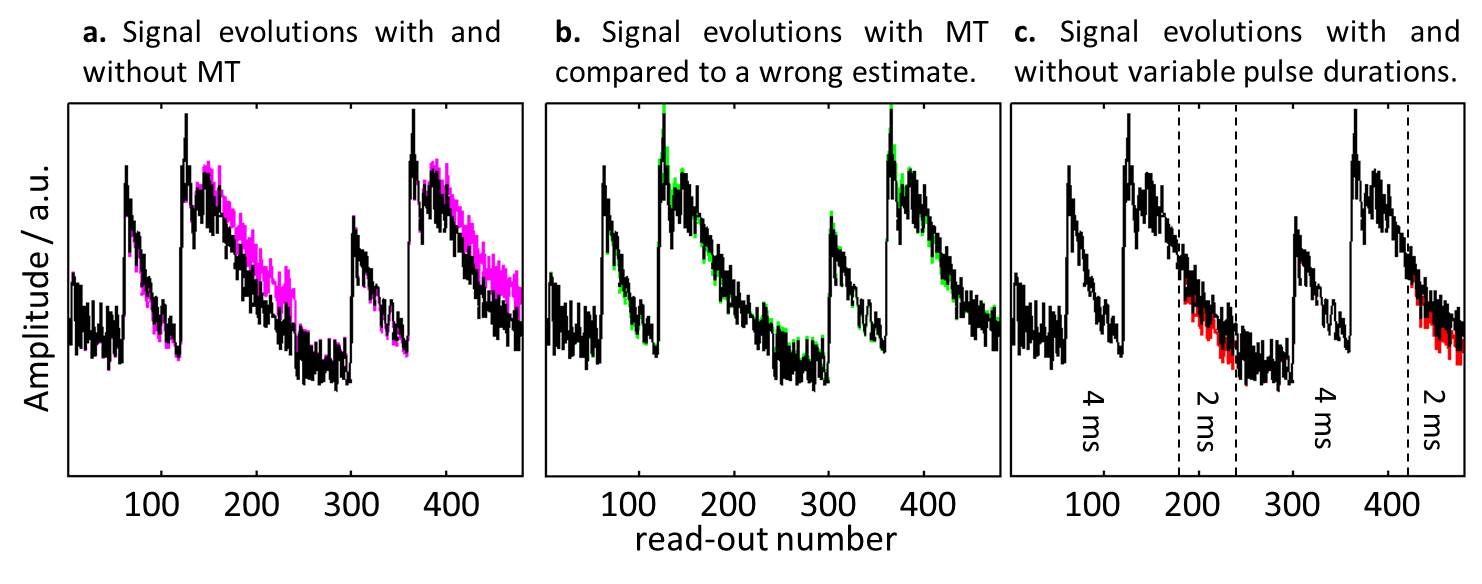
Simulated fingerprints obtained from the dictionaries trained with and without MT effect are compared in Figure 2. It can be seen that the MT effect renders the fingerprints ambiguous with respect to different dictionary entries with short T2. This ambiguity can be mitigated by varying the pulse duration during acquisition.
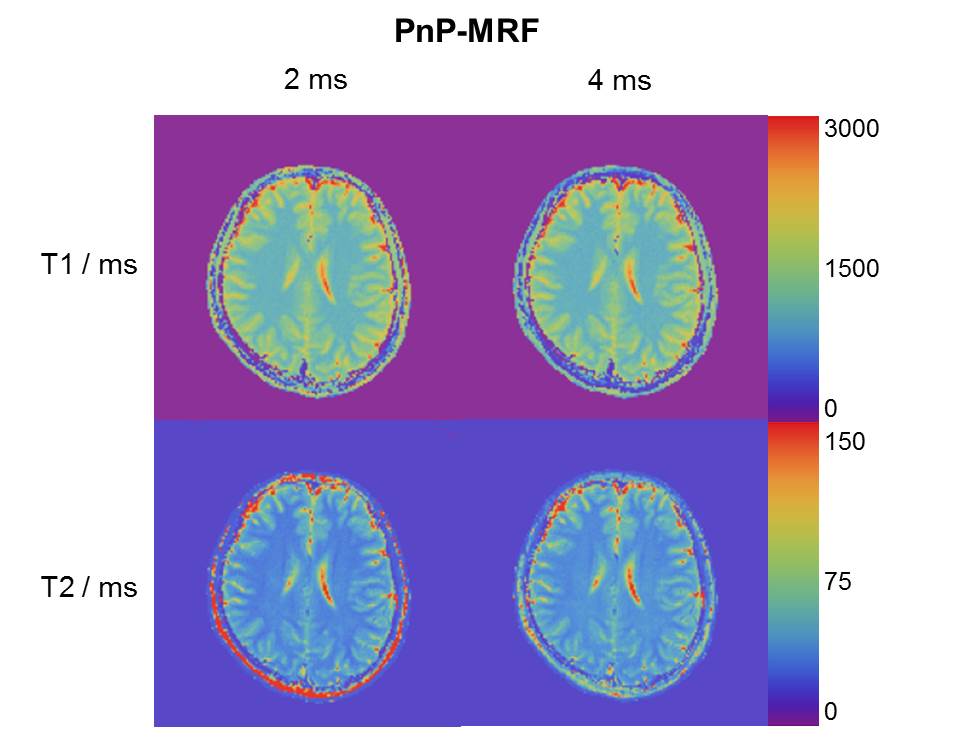
Figure 3 shows the T1 and T2 maps obtained from the first two datasets, demonstrating that the T2 measurement in the MRF implementation without MT encoding clearly depends on the RF pulse duration. Moreover, all reconstructions underestimate T2 values in white matter in comparison to values reported in the literature5 (T2~60ms).
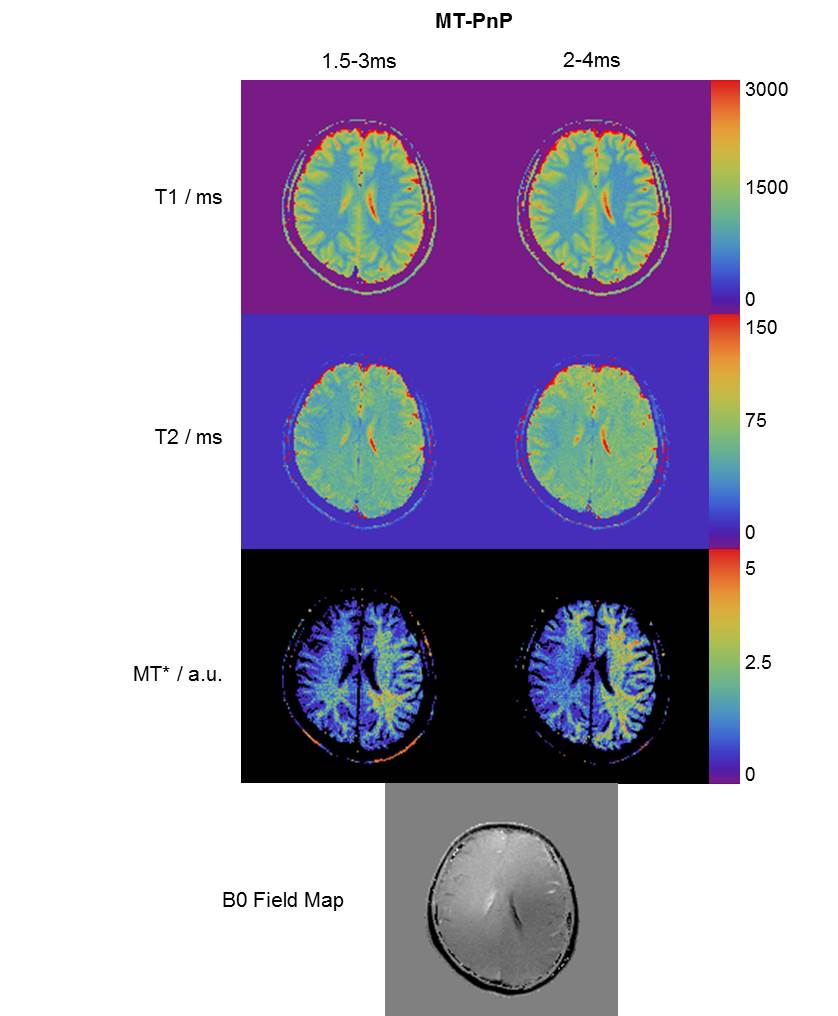
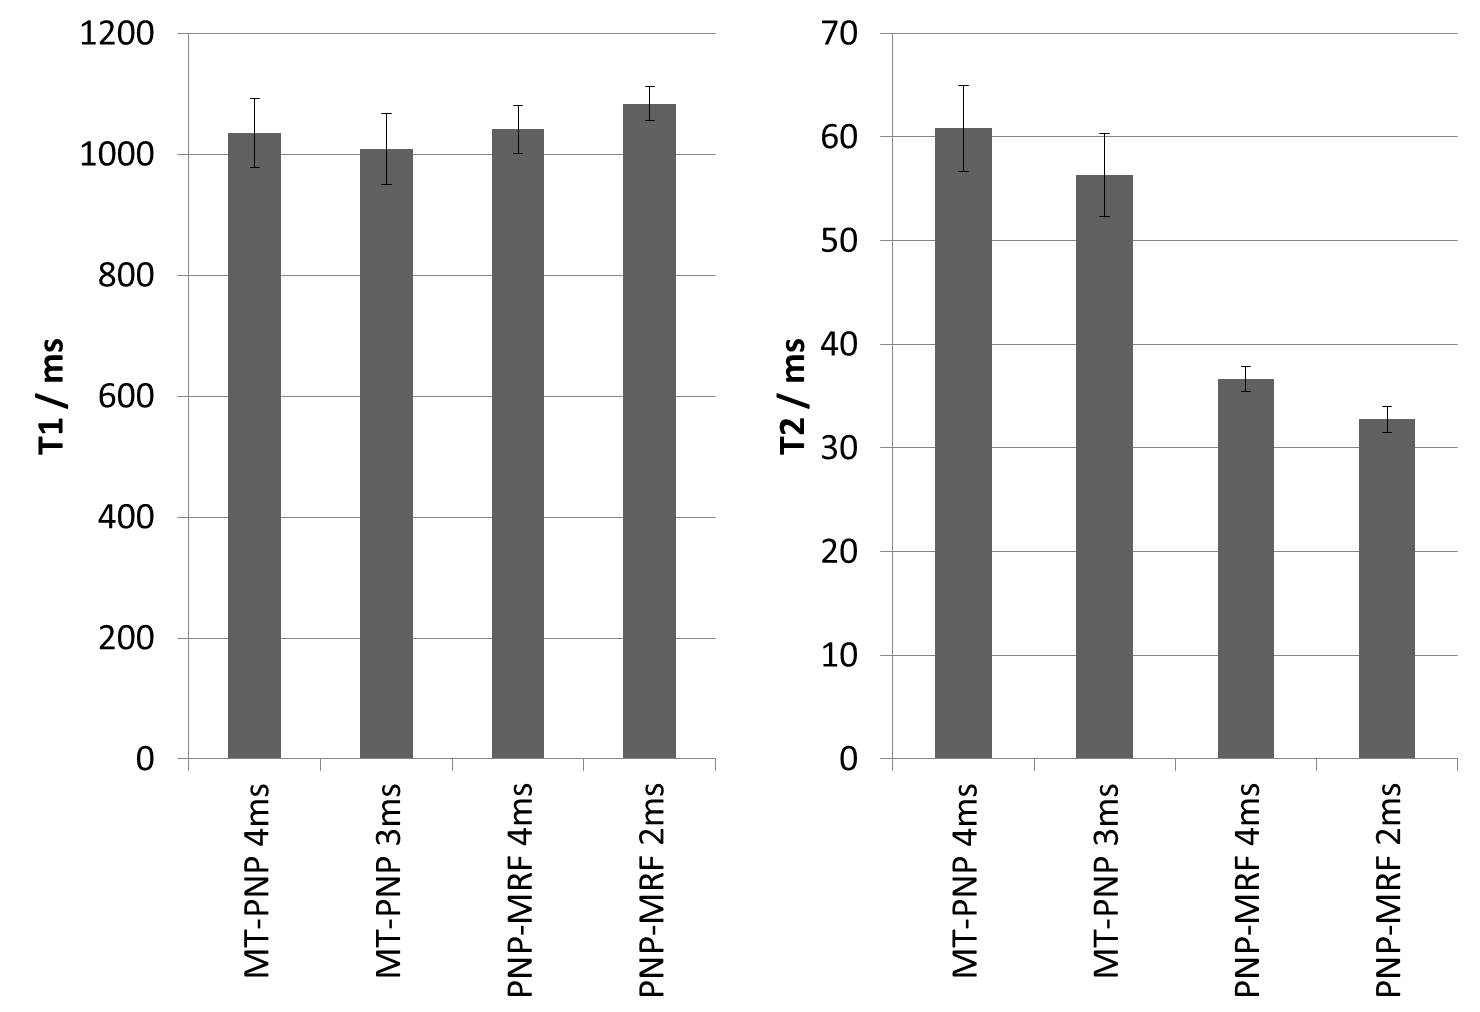
Figure 4 shows the reconstructed T1, T2, and MT* maps for the datasets where the pulse duration was varied during acquisition. The MT* maps show a strong bias in white matter, a small bias in gray matter, and no MT effects in cerebrospinal fluid, which correlates with the myelination in the healthy brain. However, the MT* maps have low SNR because the sequence encodes MT only rather poorly. Furthermore, the MT* maps show a strong spatial bias that is presumably linked to B0 inhomogeneities violating the assumption of perfectly resonant pulses in the MT model. This hypothesis is corroborated by the bias present in the B0 field map (Figure 4 bottom). Nevertheless, both variations (1.5/3.0ms and 2.0/4.0ms combinations of RF pulse durations) result in very similar T1 and T2 values that both match known literature values. This illustrates that MT bias effects can be mitigated by incorporating them in the MRF model, even in a simplified form as described above, yielding more sequence-independent T1/T2 estimates. Figure 5 shows a comparison of the quantitative values obtained using the different sequence designs in a region-of-interest (located in the white matter of the frontal lobe).
Conclusion
Here we have demonstrated that MT effects can influence the MRF T1 and T2 estimation depending on the employed RF pulse duration (i.e. RF bandwidth). We have shown that it is possible to estimate the bias caused by MT and extract more accurate T1 and T2 values by incorporating a simplified two-pool MT model into the dictionary together with variable pulse durations during the acquisition. In the current implementation, the separation of MT and T2 effects is still modest. More work is needed to render these signal evolutions more distinct. These observations suggest that the influence of MT effects should be explored also for other MRF implementations.Acknowledgements
No acknowledgement found.References
1. Ma, D., Gulani, V., Seiberlich, N., Liu, K., Sunshine, J. L., Duerk, J. L., & Griswold, M. A. (2013). Magnetic resonance fingerprinting. Nature, 495(7440), 187-192.
2. Jiang, Y., Ma, D., Seiberlich, N., Gulani, V., & Griswold, M. A. (2015). MR fingerprinting using fast imaging with steady state precession (FISP) with spiral readout. Magn Reson Med, 74(6), 1621-1631.
3. Cloos, M. A., Knoll, F., Zhao, T., Block, K. T., Bruno, M., Wiggins, G. C., & Sodickson, D. K. (2016). Multiparametric imaging with heterogeneous radiofrequency fields. Nature Communications, 7.
4. Henkelman, R. M., Stanisz, G. J., & Graham, S. J. (2001). Magnetization transfer in MRI: a review. NMR in Biomedicine, 14(2), 57-64.
5. Bojorquez, J. Z., Bricq, S., Acquitter, C., Brunotte, F., Walker, P. M., & Lalande, A. (2017). What are normal relaxation times of tissues at 3 T? Magnetic Resonance Imaging, 35, 69-80.
Figures