0071
Ultrafast compartmental relaxation time mapping with linear algebraic modeling1Division of MR Research, Department of Radiology, Johns Hopkins University, Baltimore, MD, United States, 2Department of Electrical and Computer Engineering, Baltimore, MD, United States, 3F. M. Kirby Research Center for Functional Brain Imaging, Kennedy Krieger Institute, Baltimore, MD, United States
Synopsis
Image contrast afforded by tissue longitudinal (T1) and transverse (T2) relaxation times is central to the success of modern MRI. Here, a recently-proposed ‘spectroscopy with linear algebraic modeling’ (SLAM) method is adapted to dramatically accelerate relaxation time imaging at 3 Tesla in phantoms, the abdomens of six volunteers and in six brain tumor patients. SLAM is validated by omitting up to 15/16ths (94%) of the data acquired retroactively from inversion recovery and multi-echo spin-echo sequences, and proactively applied to accelerate abdominal and brain tumor T1 and T2 measurements by up to 16-fold in humans.
Purpose
Image contrast afforded by tissue longitudinal (T1) and transverse (T2) relaxation times1, 2 is central to the success of modern MRI. The ‘gold standard’ for measuring MRI relaxation parameters is to acquire a series of pixel maps of the MRI signal as a function of the appropriate relaxation-dependent timing parameter, although other more efficient methods exist3-13. All of these protocols are limited by the spatial resolution of the image and the scan time. Often, there is inadequate time to acquire a high-resolution map of a relaxation time due to the limited scan time available for clinical studies. However, in numerous applications, regional average measurements can suffice, such as for T2-based monitoring of treatment response in various pathologies14, or for measuring the arterial blood T1 for quantifying cerebral blood flow15. Such applications are underscored by the ubiquitous use of region-of-interest (ROI)-based analyses in MRI16-18. Here, we adapt the recently-proposed ‘spectroscopy with linear algebraic modeling’ (SLAM)19-22 method to MRI, for ultrafast compartmental T1 and T2 mapping in phantom, abdominal and brain tumor studies.Methods
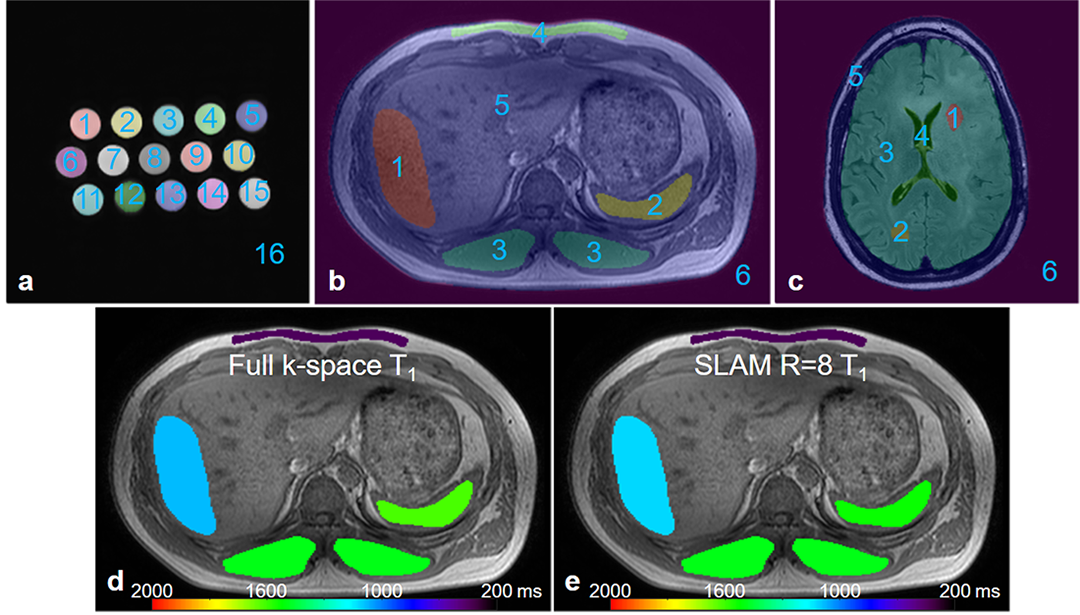
The central idea of SLAM is to group voxels defined by scout MRI into compartments, and reduce the number of phase-encoding (PE) gradient steps to a small subset of the original PE set. The compartmental segmentation (as shown in Figure 1) information is built into an auxiliary matrix, b, and incorporated into the standard Fourier Transform model19 or the sensitivity encoding23 reconstruction model20, 22. A huge reduction in PE steps is possible because the number of unknowns is reduced from the number of image-space voxels (e.g., 2562), to the number of compartments (e.g., 6-16).
Relaxation times were imaged on a 3 Tesla Philips Achieva MRI scanner in phantoms, the abdomens of 6 volunteers and in 6 brain tumor patients. For validation, we used standard inversion recovery (IR) and multi-echo spin-echo (MESE) sequences with multiple inversion times (50-4000ms) and multiple echo times (7-240ms), respectively. Reference relaxation time mapping data sets were acquired with full k-space (R=1). Proactive SLAM relaxation scans used identical imaging parameters to the reference data sets except that only a subset of PE steps from central k-space were acquired with R=8 and R=16, respectively.
The fully-sampled compartment-average T1 and T2 values were taken as reference standards for comparing the retro- and pro-actively accelerated measurements. Pearson’s correlation coefficient, and paired t-tests or Wilcoxon signed rank tests were used to compare differences between standard and accelerated measurements. For display, compartmental average relaxation times were assigned to all pixels in each compartment and overlaid on the co-registered anatomical image.
Results
Figure 1 shows compartmental segmentation used for SLAM reconstruction. Moreover, there is little difference in the color-coded abdominal compartmental T1 maps obtained with the full k-space data (Fig. 1d) and SLAM (R=8, Fig. 1e). Negligible difference in compartmental T1 and T2 maps was seen in all three sets of studies (data not shown).
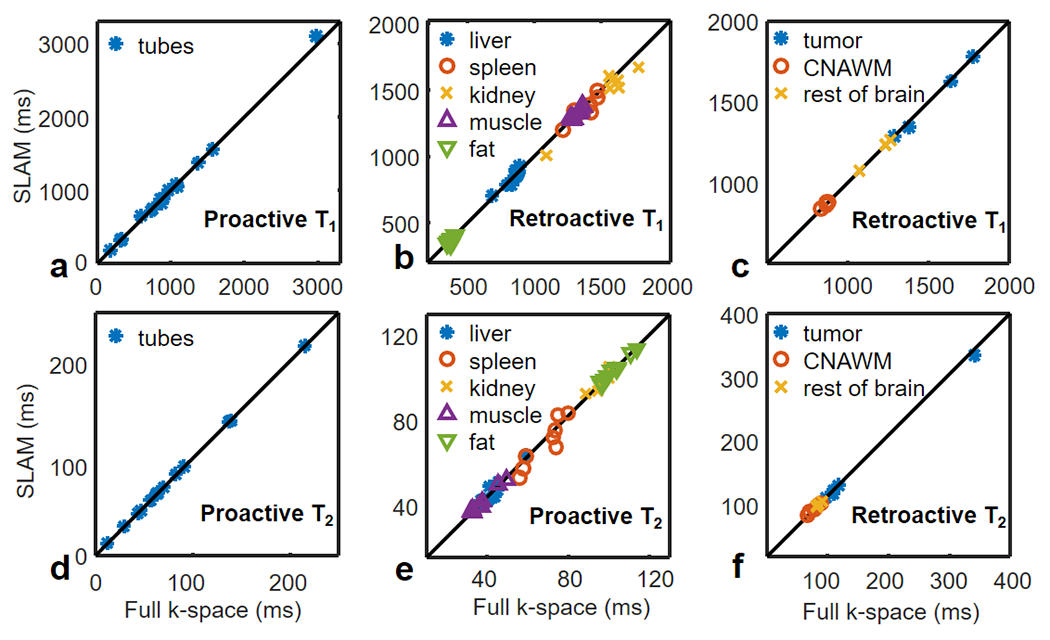
Figure 2 plots retroactive and proactive SLAM T1 and T2 values from 8-fold accelerated SLAM in phantoms (a, d), the abdomen (b, e) and the brain (c, f), vs. the standard fully-sampled T1 and T2 values. In phantoms, SLAM measurements did not differ significantly from standard measurements (p>0.6 throughout). The mean percentage difference between SLAM and full k-space values was ≤0.2% (correlation coefficients, r≥0.999). The standard deviation (SD) of the mean difference was ≤0.5% for retroactive and ≤3.5% for proactive implementations.
In human studies with R=8, abdominal SLAM T1 and T2 values also did not differ from full k-space acquisitions (p≥0.18; r≥0.94). The percentage differences (mean±SD) between SLAM and full k-space measurements were ≤0.9%±3.6% and ≤1.0%±14.0% for retroactive and proactive implementations, respectively. SLAM brain T1 and T2 values were the same as full k-space measurements (p-value≥0.49; r≥0.999): the percentage differences were ≤0.3%±2.3% and ≤1.6%±6.0% for retroactive and proactive implementations, respectively.
Increasing acceleration to R=16 generated higher percentage differences of 0.0%±0.7%, 1.4%±3.4%, and 0.5%±2.9%, for phantom, abdominal, and brain T1 measurements, respectively, well below 5%. The corresponding differences for T2 were 0.2%±1.9%, 0.9%±7.9%, and 0.4%±5.8%.
Discussion
SLAM is a general localization method that can be applied to obtain any compartment-average MR parameter many-fold faster than conventional MRI, as illustrated here with T1 and T2. Although IR and MESE methods were used here for validation, SLAM can easily be applied to recent more-efficient relaxometry methods to provide even greater acceleration. We conclude that if compartment-average relaxation time measurements suffice, SLAM can provide accurate, highly-accelerated measurements of relaxation times that quantitatively agree with standard values and may not otherwise be possible due to study-time constraints.Acknowledgements
Funding Support: NIH R01 EB007829, CA166171, EB009731, K99EB022625.References
1. Bottomley PA, Foster TH, Argersinger RE, Pfeifer LM. A review of normal tissue hydrogen NMR relaxation times and relaxation mechanisms from 1–100 MHz: dependence on tissue type, NMR frequency, temperature, species, excision, and age. Med Phys. 1984;11:425.
2. Bottomley P, Hardy C, Argersinger R, Allen-Moore G. A review of 1H nuclear magnetic resonance relaxation in pathology: Are T1 and T2 diagnostic? Med Phys. 1987;14(1):1-37.
3. Brix G, Schad LR, Deimling M, Lorenz WJ. Fast and precise T1 imaging using a TOMROP sequence. Magn Reson Imaging. 1990;8(4):351-6.
4. Chow K, Flewitt JA, Green JD, Pagano JJ, Friedrich MG, Thompson RB. Saturation recovery single-shot acquisition (SASHA) for myocardial T1 mapping. Magn Reson Med. 2014;71(6):2082-95.
5. Messroghli DR, Radjenovic A, Kozerke S, Higgins DM, Sivananthan MU, Ridgway JP. Modified Look-Locker Inversion recovery (MOLLI) for high-resolution T1 mapping of the heart. Magn Reson Med. 2004;52(1):141-6.
6. Ma D, Gulani V, Seiberlich N, Liu K, Sunshine JL, Duerk JL, Griswold MA. Magnetic resonance fingerprinting. Nature. 2013;495(7440):187-92.
7. Wang G, El-Sharkawy A-MM, Bottomley PA. Minimum acquisition methods for simultaneously imaging T1, T2, and proton density with B1 correction and no spin-echoes. J Magn Reson. 2014;242:243-55.
8. Wang G, El-Sharkawy A, Edelstein W, Schär M, Bottomley P. Measuring T2 and T1, and imaging T2 without spin echoes. J Magn Reson. 2012;214:273-80.
9. Haase A. Snapshot FLASH MRI. Applications to T1, T2, and Chemical-Shift Imaging. Magn Reson Med. 1990;13(1):77-89.
10. Henderson E, McKinnon G, Lee T-Y, Rutt BK. A fast 3D Look-Locker method for volumetric T 1 mapping. Magn Reson Imaging. 1999;17(8):1163-71.
11. Schmitt P, Griswold MA, Jakob PM, Kotas M, Gulani V, Flentje M, Haase A. Inversion recovery TrueFISP: quantification of T1, T2, and spin density. Magn Reson Med. 2004;51(4):661-7.
12. Deoni SC, Rutt BK, Peters TM. Rapid combined T1 and T2 mapping using gradient recalled acquisition in the steady state. Magn Reson Med. 2003;49(3):515-26.
13. Look DC, Locker DR. Time saving in measurement of NMR and EPR relaxation times. Rev Sci Instrum. 1970;41(2):250-1.
14. Hattingen E, Jurcoane A, Daneshvar K, Pilatus U, Mittelbronn M, Steinbach JP, Bahr O. Quantitative T2 mapping of recurrent glioblastoma under bevacizumab improves monitoring for non-enhancing tumor progression and predicts overall survival. Neuro Oncol. 2013;15(10):1395-404.
15. Li W, Liu P, Lu H, Strouse JJ, Zijl P, Qin Q. Fast measurement of blood T1 in the human carotid artery at 3T: Accuracy, precision, and reproducibility. Magn Reson Med. 2016. doi: 10.1002/mrm.26325.
16. Heo HY, Zhang Y, Jiang S, Lee DH, Zhou J. Quantitative assessment of amide proton transfer (APT) and nuclear overhauser enhancement (NOE) imaging with extrapolated semisolid magnetization transfer reference (EMR) signals: II. Comparison of three EMR models and application to human brain glioma at 3 Tesla. Magn Reson Med. 2015. doi: 10.1002/mrm.25795.
17. Heo HY, Zhang Y, Lee DH, Hong X, Zhou J. Quantitative assessment of amide proton transfer (APT) and nuclear overhauser enhancement (NOE) imaging with extrapolated semi-solid magnetization transfer reference (EMR) signals: Application to a rat glioma model at 4.7 tesla. Magn Reson Med. 2016;75(1):137-49. doi: 10.1002/mrm.25581.
18. Zhou J, Zhu H, Lim M, Blair L, Quinones-Hinojosa A, Messina SA, Eberhart CG, Pomper MG, Laterra J, Barker PB. Three-dimensional amide proton transfer MR imaging of gliomas: Initial experience and comparison with gadolinium enhancement. J Magn Reson Imaging. 2013;38(5):1119-28.
19. Zhang Y, Gabr RE, Schar M, Weiss RG, Bottomley PA. Magnetic resonance Spectroscopy with Linear Algebraic Modeling (SLAM) for higher speed and sensitivity. J Magn Reson. 2012;218:66-76.
20. Zhang Y, Gabr RE, Zhou J, Weiss RG, Bottomley PA. Highly-accelerated quantitative 2D and 3D localized spectroscopy with linear algebraic modeling (SLAM) and sensitivity encoding. J Magn Reson. 2013;237:125-38.
21. Bottomley PA, Zhang Y. Accelerated Spatially Encoded Spectroscopy of Arbitrarily Shaped Compartments Using Prior Knowledge and Linear Algebraic Modeling. eMagRes. 2015;4:89-104. doi: 10.1002/9780470034590.emrstm1438.
22. Zhang Y, Heo HY, Jiang S, Lee DH, Bottomley PA, Zhou J. Highly accelerated chemical exchange saturation transfer (CEST) measurements with linear algebraic modeling. Magn Reson Med. 2015. doi: 10.1002/mrm.25873. PubMed PMID: 26302147; PubMed Central PMCID: PMC4548835.
23. Pruessmann KP, Weiger M, Scheidegger MB, Boesiger P. SENSE: sensitivity encoding for fast MRI. Magn Reson Med. 1999;42(5):952-62.
Figures