0063
Impact of acquisition strategies and spherical deconvolution algorithms on brain connectivity mapping in early multiple sclerosis1UCL Institute of Neurology, Queen Square MS Centre, UCL, London, United Kingdom, 2Translational Imaging Group, Centre for Medical Image Computing, Department of Medical Physics and Biomedical Engineering, UCL, London, United Kingdom, 3London School of Hygiene and Tropical Medicine, Medical Statistics Department, University of London, London, United Kingdom, 4Translational Imaging Group, Centre for Medical Image Computing, Department of Medical Physics and Biomedical Engineering, UCL, United Kingdom, 5Department of Radiology and Nuclear Medicine, Neuroscience Campus Amsterdam, VU University Medical Center, Amsterdam, Netherlands, 6UCL GOS Institute of Child Health, UCL, London, United Kingdom, 7Department of Brain and Behavioural Sciences, University of Pavia, Italy, 8Brain MRI 3T Mondino Research Center, C. Mondino National Neurological Institute, Italy
Synopsis
Multi-shell, multi-tissue (MSMT) constrained spherical deconvolution (CSD) allows precise white matter tract reconstructions in healthy brains. However, its implications for connectivity mapping in multiple sclerosis (MS) are unknown. Here we compare MSMT-CSD versus single-shell single-tissue (SSST)-CSD algorithms over different clinically-feasible diffusion-weighted protocols regarding their ability to reconstruct connectivity metrics that distinguish patients with a first inflammatory-demyelinating episode (n=19) from controls (n=12). Methodical analysis of data from time- and directionality-matched protocols showed that a greater angular resolution improves results and is preferable to choosing multi-tissue-CSD algorithms. Given similar angular resolution, all algorithms perform similarly, producing highly reproducible brain connectivity metrics.
Purpose
The multi-shell, multi-tissue (MSMT) constrained spherical deconvolution (CSD) algorithm allows robust voxel-wise estimation of the fibre orientation density function (fODF)1,2 in the presence of partial volume effects at tissue interfaces3. Such approach has high potential for accurate white matter (WM) tract reconstruction in diseases characterised by WM lesions, such as multiple sclerosis (MS)4,5, where conventional algorithms are negatively affected by the distinct diffusion properties of lesional and non-lesional WM. However, to date, an exhaustive characterisation of the benefits of MSMT in the clinical setting for connectivity mapping in MS is lacking.
Here we aimed to investigate to what extent better WM tract reconstruction methods improve the potential of diffusion-derived connectivity measures as possible biomarkers in early MS. Specifically, we compared MSMT-CSD versus single-shell single-tissue (SSST)-CSD over different clinically-feasible DW protocols regarding their ability to reconstruct connectivity metrics that distinguish patients with a first attack of MS (i.e. clinically isolated syndrome [CIS]) from healthy controls (HCs); we also assessed the reproducibility of network metrics obtained through the different DW protocols/algorithms.
Methods
Subjects:
19 patients within 4 weeks of a CIS (9 females, mean age 36 years) and 12 HCs (8F, 34.7 years).
MRI acquisition & pre-processing:
T1-weighted (resolution=1x1x1mm3, TE/TR: 3.2/7.0ms); Axial PDT2-FAST images (resolution=1x1x3mm3; TE1/TE2/TR =15/85/3500ms); multi-shell diffusion-weighted (DW) images (resolution=2.5x2.5x2.5mm3, TE/TR=82ms/12s, 53 directions: b=300s/mm2 (8), b=711s/mm2 (15), b=2000s/mm2 (30)). DW and T1-weighted images underwent conventional pre-processing5 and T2-weighted images were used to manually outline T2-hyperintense WM lesions.
DW protocols/algorithms:
We created the following combinations of DW protocols and analysis algorithms from the original data (see Table 1):
-53dir-Multi-Shell-Multi-Tissue (53dir-MSMT): original protocol, multi-tissue analysis;
-30dir-Single-Shell-Multi-Tissue (30dir-SSMT): one shell, multi-tissue analysis;
-30dir-Single-Shell-Single-Tissue (30dir-SSST): one shell, single-tissue analysis;
-30dir-Multi-Shell-Multi-Tissue (30dir-MSMT): multi-shell (optimal directions extracted with Camino6), time-matched to 30dir-SSMT/30dir-SSST, multi-tissue analysis.
Structural connectome (MRtrix3):
1-Voxel-wise fODF was estimated using the response function (RF) obtained through a multi-tissue7 (53dir-MSMT, 30dir-MSMT, 30dir-SSMT) or a single-tissue algorithm8 (30dir-SSST).
2-Tractography: we used an anatomically-constrained probabilistic algorithm (iFOD2)9 (108 streamlines, afterwards re-weighted with SIFT2 algorithm10) with a dynamic seeding mechanism.
3-Structural connectome construction: network nodes: grey matter regions (Geodesic Information Flows [GIF] segmentation11); network edges: re-weighted number of streamlines.
Network metrics (Matlab Brain Connectivity Toolbox):
We estimated the following standardised network metrics for each subject and protocol: global efficiency (GE), mean shortest path (MeanSP), mean degree (global network properties); mean local efficiency (MeanLE), mean clustering coefficient (MeanCC), and modularity coefficient (ModC) (local aspects of network organisation).
Statistical analyses (Stata14.2):
For each protocol/algorithm and each network metric we obtained the effect size (ES), considering patients with/without lesions in turn. ES assessed metrics’ ability to distinguish patients from controls12 (the higher absolute value, the better). Additionally, for each network metric we obtained the intra-class correlation coefficient (ICC)13 through mixed-effects models allowing for pseudo-repeated (across-algorithm) measures. ICC assessed the proportion of total variability explained by inter-subject differences.
Results
Qualitative assessment:
By visual inspection, MSMT-CSD algorithms reduced fODF spurious peaks compared to the single-shell algorithms, and captured partial volume within WM lesions (Fig.1). This resulted in connectomes that are qualitatively similar but different in re-weighted number of streamlines (Fig.2).
Statistical analyses:
All protocols consistently showed lower GE, mean degree, MeanLE and MeanCC, and higher ModC in patients than HCs (Fig.3A).
MSMT-CSD algorithms provided similar ES to the single-tissue algorithm. For a similar acquisition time (30dir-MSMT vs. 30dir-SSST), the protocol with higher angular resolution (30dir-SSST) performed better (Fig.3A-C).
When HCs were compared to patients with (n=11) and without lesions (n=8) separately, those metrics initially showing high ES values generally maintained their high ES values, regardless of the algorithm used (Fig.3B).
Overall, network metrics were highly reproducible across protocols/algorithms, as suggested by high ICC values, even in patients (Fig.4).
Discussion & Conclusions
We investigated for the first time the performance of different CSD-based algorithms for connectivity mapping in early MS, considering a number of clinically feasible protocols.
We saw that MSMT and SSST algorithms performed similarly, especially if they had the same angular resolution. They all provided network metrics able to differentiate CIS patients from controls independently of the presence of lesions, illustrating the robustness of network metrics as biomarkers in MS.
A higher angular resolution was more relevant than the choice of a multi-shell sampling scheme and a multi-tissue CSD analysis algorithm, for acquisition time-matched protocols. This information may be useful for the design of future diffusion-based structural connectivity studies in MS.
Overall, reproducibility across algorithms was good, providing ground for reliable across-study (i.e. multi- versus single-tissue CSD) comparisons of popular network metrics such as global and local efficiency in early MS.
Acknowledgements
2015 ECTRIMS Postdoctoral Research Fellowships. Horizon2020-EU.3.1 CDS-QUAMRI (ref: 634541). ISRT, WfL & CHNF (INSPIRED). UK MS Society. NIHR BRC UCLH/UCL High Impact Initiative (BW.MN.BRC10269). EPSRC (EP/H046410/1, EP/J020990/1, EP/K005278). MRC (MR/J01107X/1).References
1. Tournier, J. D., Calamante, F., Gadian, D. G., et al. Direct estimation of the fiber orientation density function from diffusion-weighted MRI data using spherical deconvolution. Neuroimage 2004; 23(3):1176-85.
2. Tournier, J. D., Calamante, F., and Connelly, A. Robust determination of the fibre orientation distribution in diffusion MRI: non-negativity constrained super-resolved spherical deconvolution. Neuroimage 2007; 35(4):1459-72.
3. Jeurissen, B., Tournier, J. D., Dhollander, T., et al. Multi-tissue constrained spherical deconvolution for improved analysis of multi-shell diffusion MRI data. Neuroimage 2014; 103:411-26.
4. Compston, A. & Coles, A. Multiple sclerosis. Lancet 2008; 372(9648):1502-17.
5. Andersson, J. L. and Sotiropoulos, S. N. An integrated approach to correction for off-resonance effects and subject movement in diffusion MR imaging. Neuroimage 2016; 125:1063-78
6. Cook, P. A., Bai, Y., Nedjati-Gilani, S., et al. Camino: Open-Source Diffusion-MRI Reconstruction and Processing. Presented at 14th Scientific Meeting of the International Society for Magnetic Resonance in Medicine (Seattle, WA, USA, May 2006), p. 2759.
7. Dhollander, T., Raffelt, D., and Connelly, A. Unsupervised 3-tissue response function estimation from single-shell or multi-shell diffusion MR data without a co-registered T1 image. Presented at ISMRM Workshop on Breaking the Barriers of Diffusion MRI (Lisbon, Portugal, September 2016).
8. Tournier, J. D., Calamante, F. and Connelly, A. Determination of the appropriate b value and number of gradient directions for high-angular-resolution diffusion-weighted imaging. NMR Biomed. 2013; 26(12):1775-86.
9. Smith, R. E., Tournier, J. D., Calamante, F., et al. Anatomically-constrained tractography: improved diffusion MRI streamlines tractography through effective use of anatomical information. Neuroimage 2012; 62(3):1924-38.
10. Smith, R. E., Tournier, J. D., Calamante, F., et al. SIFT2: Enabling dense quantitative assessment of brain white matter connectivity using streamlines tractography. Neuroimage 2015; 119:338-51.
11. Cardoso, M.J., Modat, M., Wolz, R., et al. Geodesic Information Flows: Spatially-Variant Graphs and Their Application to Segmentation and Fusion. IEEE Trans Med Imaging 2015; 34(9):1976-88.
12. Sawilowsky, S. New effect size rules of thumb. Journal of Modern Applied Statistical Methods 2009; 8:467–474.
13. Shrout, P. E. and Fleiss, J.L. Intraclass Correlations: Uses in Assessing Rater Reliability. Psychological Bulletin 1979; 86(2):420-428.
Figures
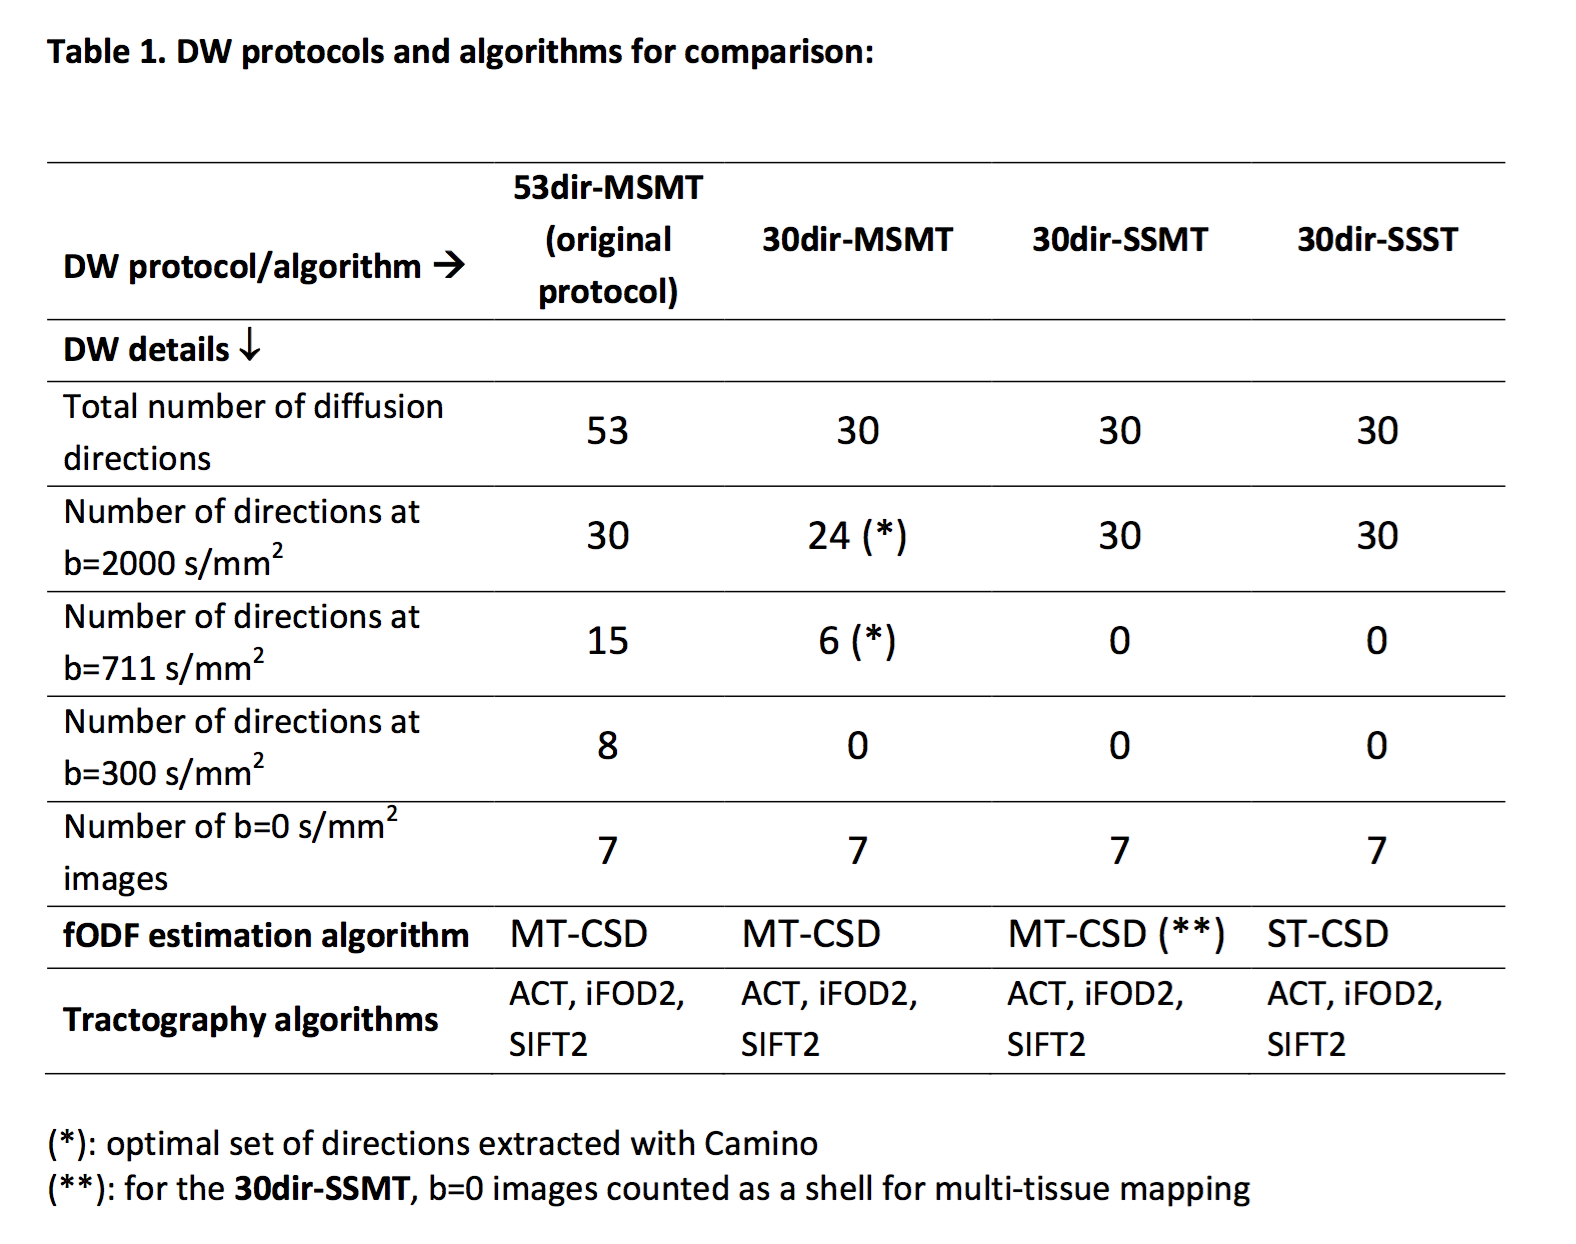
For the 30dir-SSMT algorithm, an optimal set of 24 directions with minimum electrostatic energy was extracted from b=2000s/mm2 and similarly a subset of 6 optimal directions was extracted from b=711s/mm2 (using Camino); for the 30dir-SSMT, the application of a multi-tissue algorithm was possible because the images at b=0s/mm2 counted as a second shell.
Abbreviations: ACT: anatomically constrained tractography; iFOD2: 2nd-order Integration over Fibre Orientation Distributions; DW: diffusion-weighted; fODF: fibre orientation density function; MT-CSD: multi-tissue constrained spherical deconvolution; SIFT2: spherical-deconvolution informed filtering of tractograms (version 2); ST-CSD: single-tissue constrained spherical deconvolution.
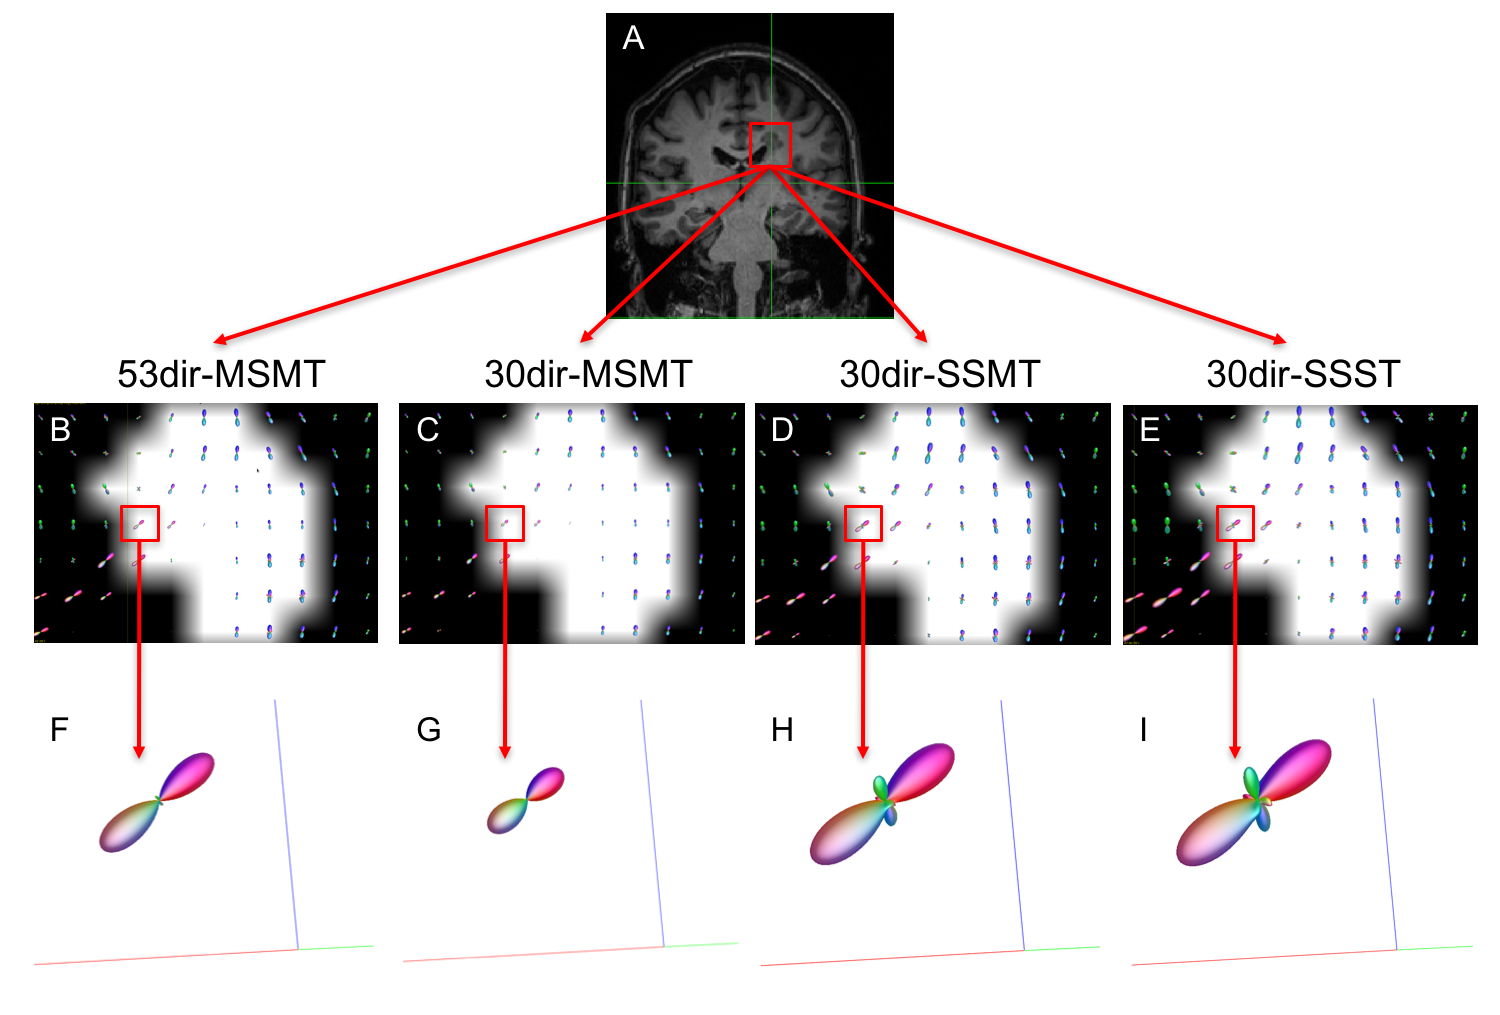
Figure 1. Estimated fODF inside a lesion located in the corpus callosum (single-fibre WM tissue)
A: coronal view, T1-weighted image of a patient with a lesion in the confluence of corpus callosum and corticospinal tract; B-E: voxel-wise fODF mapping inside the lesion (lesion mask overlaid), for each algorithm; F-I: fODF within a lesional voxel belonging to WM tissue with only one fibre population, for each algorithm; whereas F-G show no spurious peaks (MSMT algorithms), these are observed in H-I. The reduced size of the fODF in F-G reflects partial volume effects within the lesion.
Abbreviations: see footnote of Table 1.
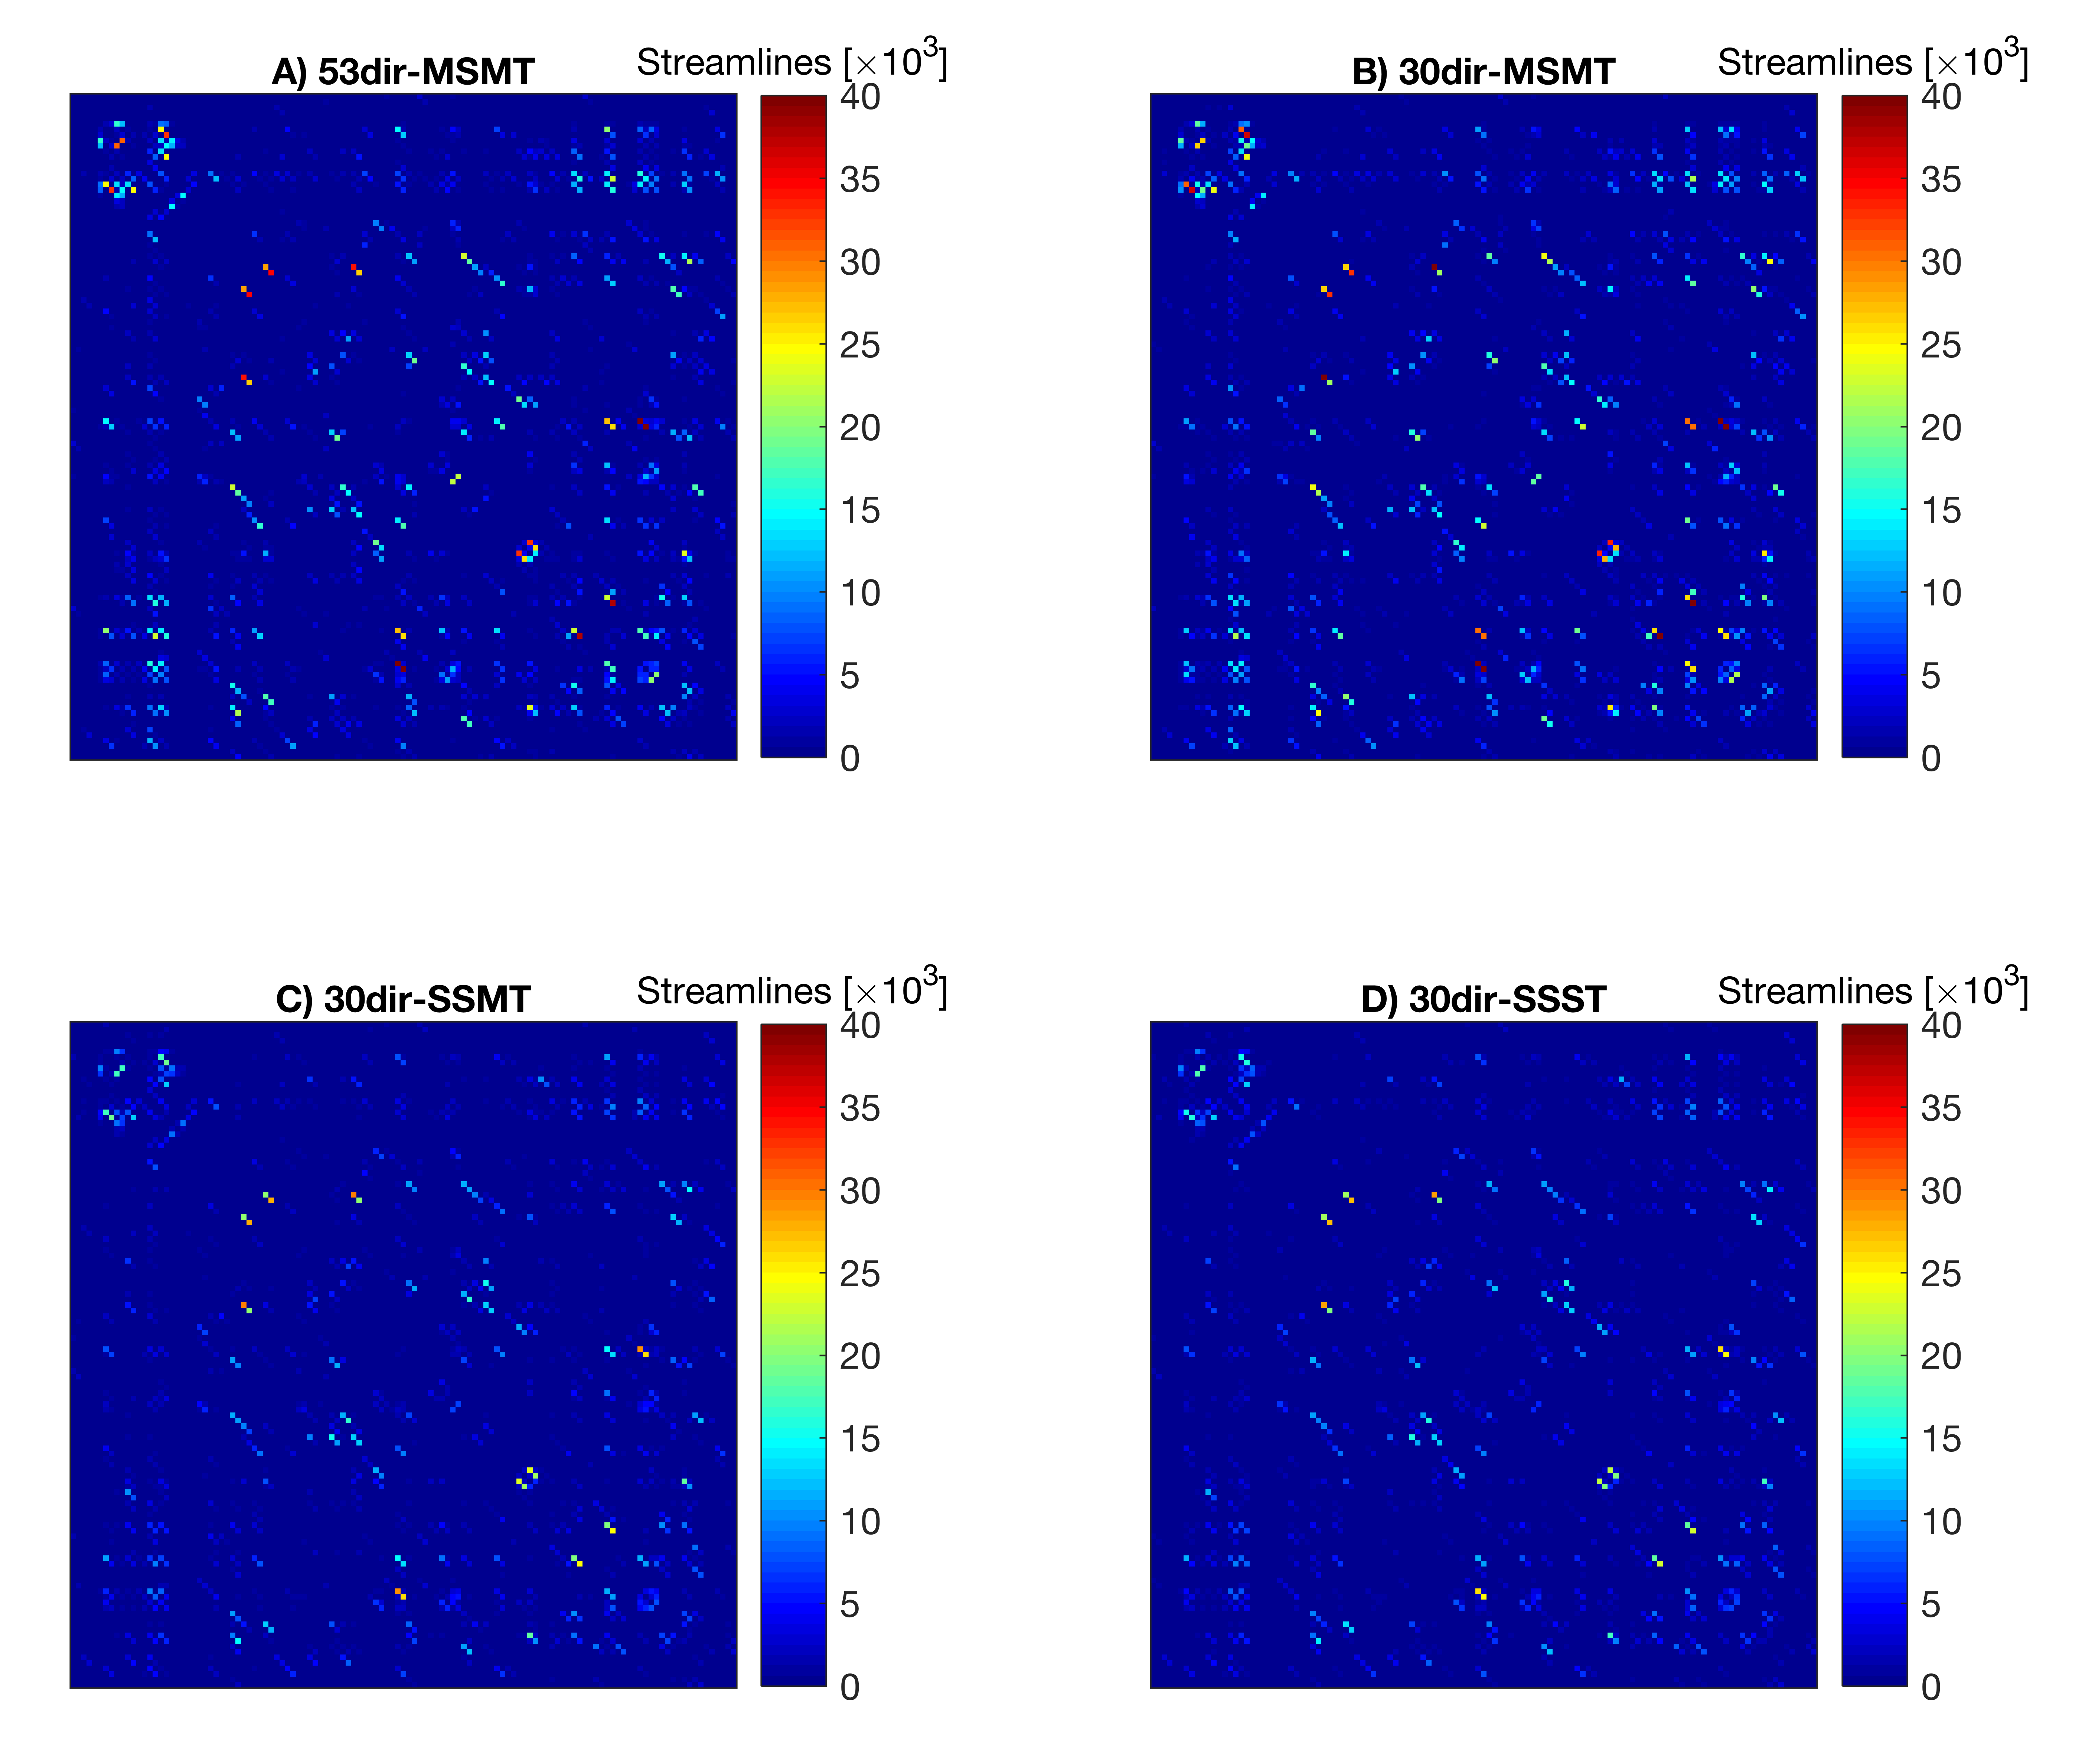
Figure 2. Algorithm-specific connectivity matrices
This figure shows the four connectivity matrices (based on the re-weighted number of streamlines) obtained for each subject, one per each algorithm. In particular, this figure illustrates the example of a CIS patient. Qualitatively, all matrices show a similar pattern. However, the two multi-shell multi-tissue algorithms (A and B) overall show greater connectivity.
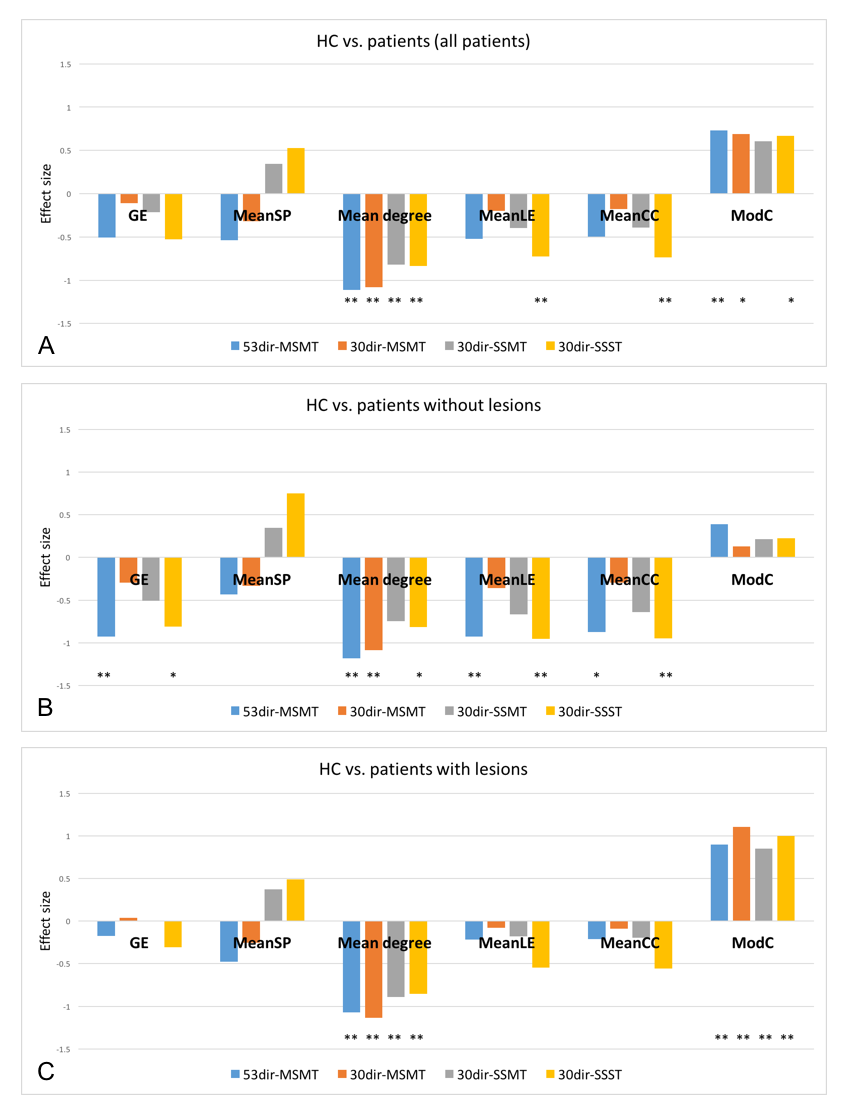
Figure 3. Effect size of network metrics obtained with different protocols/algorithms
Protocols/algorithms compared:
53dir-MSMT: 53 directions, three shells, multi-tissue (MT)-CSD algorithm;
30dir-MSMT: 30 directions, two shells, MT-CSD algorithm;
30dir-SSMT: 30 directions, one shell, MT-CSD algorithm (b=0s/mm2 counts as one shell);
30dir-SSST: 30 directions, one shell, single-tissue (ST)-CSD algorithm;
Negative ES means patients have lower metric values than controls; the higher absolute value of ES, the better its ability to distinguish patients from controls.
Abbreviations: CSD: constrained spherical deconvolution; GE: global efficiency; MeanCC: mean clustering coefficient; MeanLE: mean local efficiency; MeanSP: mean shortest path; ModC: modularity coefficient;
**: p<0.05; *: p<0.10;
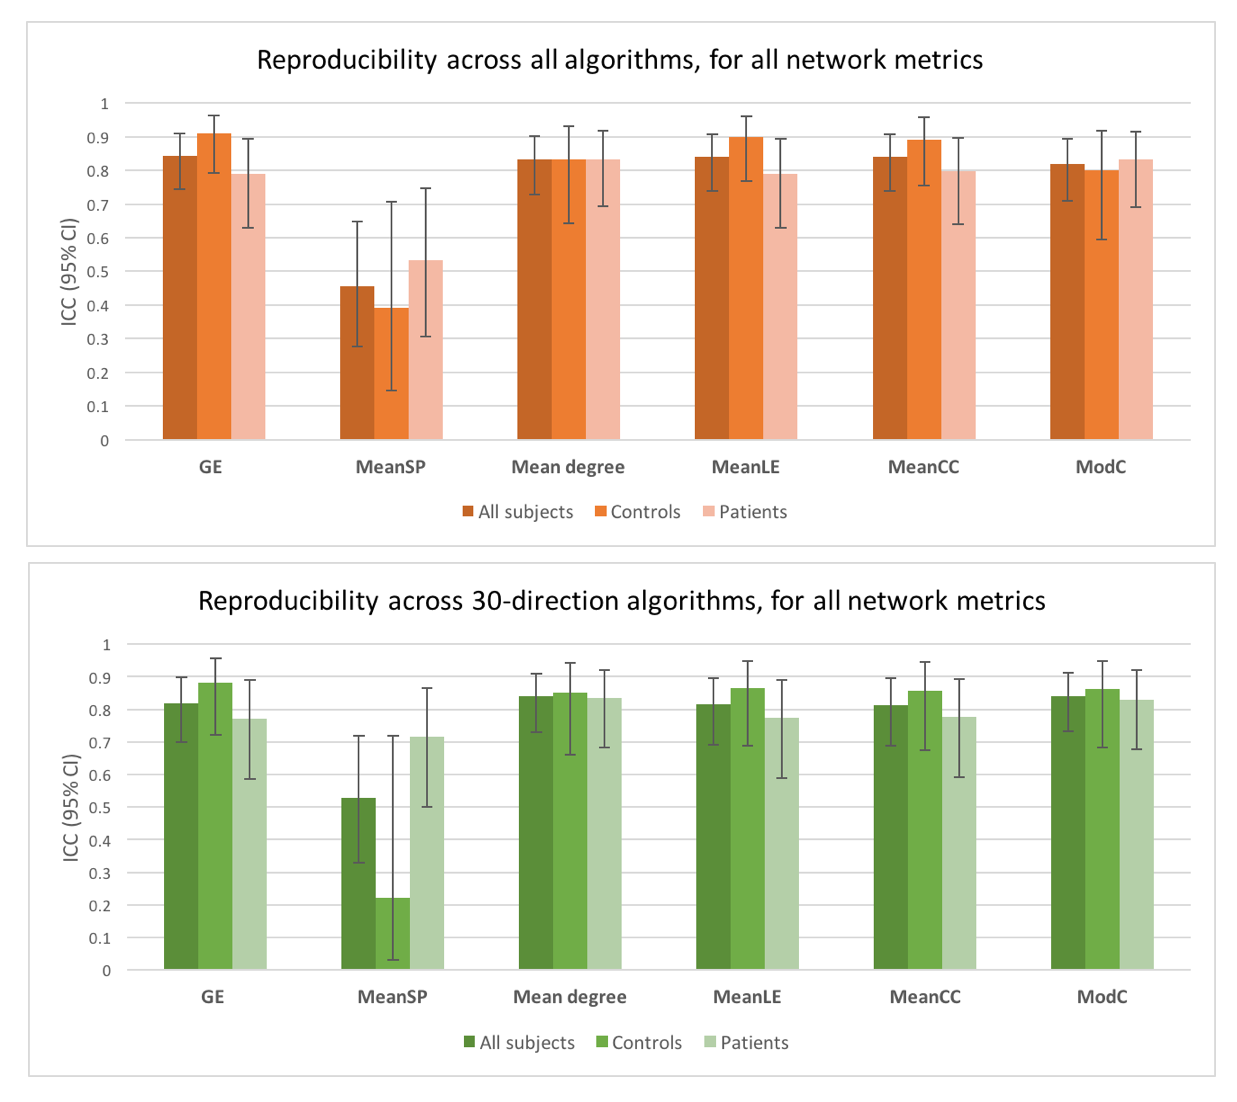
Figure 4. Reproducibility of network metrics across protocols/algorithms
This figure shows the ICC (95% Confidence Interval [CI]) across algorithms for each metric. Reproducibility was excellent for all metrics except for mean shortest path. In general, ICC tended to be slightly lower in patients than in controls, as expected, although 95%CI intervals overlapped, suggesting no significant differences between groups. A similar picture was observed when only 30-direction algorithms were analysed.
Abbreviations: CSD: constrained spherical deconvolution; GE: global efficiency; ICC: Intraclass correlation coefficient; MeanCC: mean clustering coefficient; MeanLE: mean local efficiency; MeanSP: mean shortest path; ModC: modularity coefficient.