0061
Microstructure-Informed Tractography of the Human Optic Radiation In Vivo1Edmond and Lily Safra Center for Brain Sciences, Hebrew University of Jerusalem, Jerusalem, Israel, 2Department of Psychology, Stanford University, CA, United States, 3Department of Ophthalmology, Atsugi City Hospital, Kanagawa, Japan, 4Department of Ophthalmology, The Jikei University School of Medicine, Tokyo, Japan, 5Department of Speech & Hearing Sciences, University of Washington, Seattle, WA, United States
Synopsis
Accurate identification of the Optic Radiations (OR) in vivo has great clinical significance in pre-surgical planning. Yet traditional tractography algorithms based on diffusion MRI often fail to recover the full extent of the OR. Post-mortem histology studies show that the OR has a consistent signature of high myelination compared to adjacent white matter tracts. We therefore propose to use quantitative T1-mapping, which is sensitive to myelin, to eliminate candidate fascicles with highly variable T1 profiles. We introduce a fully automatic novel framework that integrates diffusion MRI with T1-mapping, and use it to reconstruct the OR in 62 healthy subjects.
Introduction
Accurate in vivo identification of the Optic Radiations (OR) has great clinical significance in pre-surgical planning, as damage to the OR could induce visual-field deficits1–3. However, diffusion MRI tractography of the OR is considered challenging4,5, particularly its most anterior portion, Meyer’s loop. These challenges have made the OR the focus of various studies that used it as a model system to test new diffusion-based tractography methods4,6–8. While these studies relied on diffusion data only, we suggest resolving the inherent ambiguity of diffusion MRI data using a novel framework that incorporates additional information from quantitative T1-mapping.
Post-mortem histology studies have shown that the OR is characterized by a consistent signature of high myelination compared to adjacent white matter tracts9,10. Taking advantage of the known correspondence between myelin content and T1 relaxation11, we separate true fascicles from spurious ones according to their T1 profiles. Herein, we provide a fully automated algorithm of in vivo “histology” for reconstructing the OR.
Methods
62 healthy volunteers (aged 8-80 years old) were scanned for high angular resolution diffusion imaging (HARDI; b=2000 s/mm2, 96 directions), and T1-mapping (SPGR; α = 4°, 10°, 20°, 30°; TR = 20 ms; TE = 2.4 ms) corrected for B1 inhomogeneity12. The T1 map was non-linearly warped to the diffusion data using ANTS13. To reconstruct the OR we propose a two-step procedure:
1) Reconstruction of candidate fascicles: Using each subject’s FreeSurfer14 parcellation we automatically define the regions of interest used by the tractography algorithm in each hemisphere: the lateral geniculate nucleus (LGN) and V1. A large set of 100,000 candidate fascicles connecting LGN and V1 is then generated using the ConTrack probabilistic tractography algorithm15.
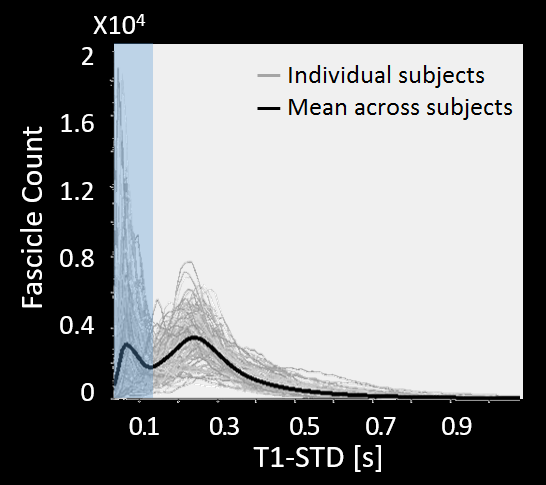
2) Elimination of spurious fascicles: For each candidate fascicle, the T1 values at multiple points along its length are sampled using the AFQ toolbox16. To quantify the variability of T1 values along each fascicle, we calculate the standard deviation of all T1 values along it (T1-STD). To separate true fascicles from spurious ones, we define a threshold for T1-STD based on the distribution of T1-STD values across all subjects (Fig. 1). Fascicles whose T1-STD exceeds this threshold are considered inconsistent in their T1 profile, and are eliminated.
Results
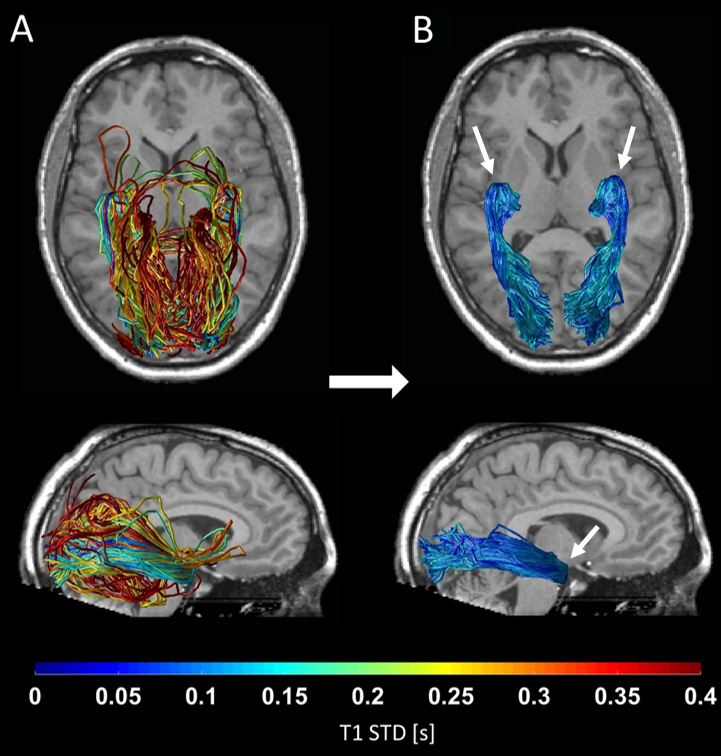
By combining probabilistic tractography with T1 relaxometry, we successfully reconstructed the OR in 62 healthy subjects, including Meyer’s loop. Fig. 1 shows the distribution of T1-STD values across all subjects. The mean histogram across subjects is clearly bimodal, where the peak corresponding to lower values is expected to include the true OR fascicles, according to the histological prediction. The threshold separating low- from high-T1-STD fascicles was set at the trough between the two peaks (0.135s). Fig. 2A shows the candidate OR fascicles in a typical subject, colored by their T1-STD. By eliminating fascicles with T1-STD>0.135s, only a subset of the candidate fascicles is extracted as true OR fascicles (Fig. 2B).Discussion
Our data suggest that the myelin content of white matter fascicles, as reflected by their T1 profile, is relatively constant. In contrast, spurious fascicles produced by the probabilistic tractography algorithm are characterized by a highly variable profile of T1 values. Such variable T1 profiles are expected for fascicles that enter and leave the true pathway of the OR, making the T1 profile along their path a mixture of T1 values from disparate white matter tracts. Our results thus support our post-mortem based assumption that true fascicles of the OR are characterized by a consistent T1 signature9,10.Conclusion
We propose a fully automated pipeline for tractography reconstruction of the OR. Our method is based on a novel in vivo histology framework, integrating T1 relaxometry mapping and diffusion MRI tractography. Therefore, it can be used to corroborate the results of other methods that are based solely on diffusion data.
Our method could be seen as a form of microstructure-informed tractography17, where microstructural properties along the fascicles (a consistent T1 signature) is used to alleviate the occurrence of spurious fascicles, a major limitation in all current tractography algorithms18–20. Importantly, incorporating a fixed threshold for T1-STD allowed us to fully automate the process of eliminating spurious fascicles21, requiring no manual intervention. To our knowledge, this is the first study to provide an integrated framework that combines data from different quantitative MR measures to optimize tractography results.
Acknowledgements
No acknowledgement found.References
1. Lilja Y, Nilsson DT. Strengths and limitations of tractography methods to identify the optic radiation for epilepsy surgery. 2015;5(2):288-299. doi:10.3978/j.issn.2223-4292.2015.01.08.
2. Ebeling U, Reulen HJ. Neurosurgical topography of the optic radiation in the temporal lobe. Acta Neurochir (Wien). 1988;92(1-4):29-36.
3. Powell HWR, Parker GJM, Alexander DC, et al. MR Tractography predicts visual field defects following temporal lobe resection. Neurology. 2005;64:596-599.
4. Kammen A, Law M, Tjan BS, Toga AW, Shi Y. Automated retinofugal visual pathway reconstruction with multi-shell HARDI and FOD-based analysis. Neuroimage. 2016;125:767-779. doi:10.1016/j.neuroimage.2015.11.005.
5. Mandelstam SA. Challenges of the anatomy and diffusion tensor tractography of the Meyer loop. Am J Neuroradiol. 2012;33(7):1204-1210. doi:10.3174/ajnr.A2652.
6. Renauld E, Descoteaux M, Bernier M, Garyfallidis E, Whittingstall K. Semi-Automatic Segmentation of Optic Radiations and LGN, and Their Relationship to EEG Alpha Waves. PLoS One. 2016;11(7):e0156436. doi:10.1371/journal.pone.0156436.
7. Chamberland M, Scherrer B, Prabhu SP, et al. Active delineation of Meyer’s loop using oriented priors through MAGNEtic tractography (MAGNET). Hum Brain Mapp. 2016;0:1-19. doi:10.1002/hbm.23399.
8. Sherbondy AJ, Dougherty RF, Wandell BA. Identifying the human optic radiation using diffusion imaging and fiber tractography. 2008;8(2008):1-11. doi:10.1167/8.10.12.Introduction.
9. Boxma A, Lequin M, Ramenghi L a, Kros M, Govaert P. Sonographic detection of the optic radiation. Acta Paediatr. 2005;94(May 2004):1455-1461. doi:10.1080/08035250510031331.
10. Kitajima M, Korogi Y, Takahashi M, Eto K. MR signal intensity of the optic radiation. Am J Neuroradiol. 1996;17(7):1379-1383.
11. Stüber C, Morawski M, Schäfer A, et al. Myelin and iron concentration in the human brain: a quantitative study of MRI contrast. Neuroimage. 2014;93 Pt 1:95-106. doi:10.1016/j.neuroimage.2014.02.026.
12. Mezer A, Yeatman JD, Stikov N, et al. Quantifying the local tissue volume and composition in individual brains with magnetic resonance imaging. Nat Med. 2013;19(12):1667-1672. doi:10.1038/nm.3390.
13. Avants B, Tustison N, Song G. Advanced normalization tools (ANTS). Insight J. 2009;2:1-35.
14. Fischl B. FreeSurfer. Neuroimage. 2012;62(2):774-781. doi:10.1016/j.neuroimage.2012.01.021.
15. Sherbondy AJ, Dougherty RF, Ben-Shachar M, Napel S, Wandell B a. ConTrack: finding the most likely pathways between brain regions using diffusion tractography. J Vis. 2008;8(2008):15.1-16. doi:10.1167/8.9.15.
16. Yeatman JD, Dougherty RF, Myall NJ, Wandell B a, Feldman HM. Tract profiles of white matter properties: automating fiber-tract quantification. PLoS One. 2012;7(11):e49790. doi:10.1371/journal.pone.0049790.
17. Daducci A, Dal Palú A, Descoteaux M, Thiran J-P. Microstructure Informed Tractography: Pitfalls and Open Challenges. Front Neurosci. 2016;10(June):1-13. doi:10.3389/fnins.2016.00247.
18. Pestilli F, Yeatman JD, Rokem A, Kay KN, Wandell B a. Evaluation and statistical inference for human connectomes. Nat Methods. 2014;11(10). doi:10.1038/nmeth.3098.
19. Daducci A, Dal Palu A, Lemkaddem A, Thiran J-P. COMMIT: Convex Optimization Modeling for Microstructure Informed Tractography. IEEE Trans Med Imaging. 2015;34(1):246-257. doi:10.1109/TMI.2014.2352414.
20. Thomas C, Ye FQ, Irfanoglu MO, et al. Anatomical accuracy of brain connections derived from diffusion MRI tractography is inherently limited. Proc Natl Acad Sci. 2014;111(46):16574-16579. doi:10.1073/pnas.1405672111.
21. Maier-Hein K, Neher P, Houde J-C, et al. Tractography-based connectomes are dominated by false-positive connections. bioRxiv. 2016.
Figures