0060
Characterization of the brainstem connectivity and its microstructure using diffusion MR microscopy at ultra-high field (UHF) with strong gradients1UNIRS, CEA/I2BM/NeuroSpin, Gif-sur-Yvette, France, 2Université Paris-Saclay, Orsay, France, 3FLI / Noeud Paris-Sud, Orsay, France, 4Laboratoire d'Anatomie, Faculté de Médecine/CHRU, Tours, France, 5UNATI, CEA/I2BM/Neurospin, France, 6CEA NeuroSpin / UNATI, Gif-sur-Yvette, France, 7http://cati- neuroimaging.com/, Gif-sur-Yvette, France
Synopsis
The brainstem is a crossroad of the major motor and sensitive pathways but its structure is challenging to image. In this work, we demonstrate that ultra-high field(11.7T) / ultra-high gradients(780mT/m) diffusion-weighted MRI and diffusion MRI microscopy enable to map not only its finer structures, but also its fine connectivity revealed by HARDI-based tractography with the mapping of the structural connectivity of the locus ceruleus. We also assessed the enhanced contrast brought by diffusion multicompartmental models such as NODDI that reveals the microstructure of the brainstem structures, thus allowing to go a step forward in the undertstanding of its anatomo-functional organization.
Purpose
The brainstem, located between the brain, the spinal cord, and the cerebellum, is a crossroad of the major motor and sensitive pathways. It performs various functions from primary ones like breathing to complex ones like gait or pain control, and is therefore implicated in their disorders such as in Parkinson's disease. However, imaging its structure is challenging first due to the wide range of size of its inner gray and white matter structures that can vary from the sub-millimeter to the centimeter resolution, and due to the complex cellular organization of its structures. Moreover, its position yields to many imaging artifacts in MRI such as susceptibility induced distortions. Ultra-high field ex-vivo diffusion MRI using strong gradients was proven to be useful to look deeper into the brainstem connectivity1. In this work, we go further and demonstrate that using 11.7T MRI with strong gradients (780mT/m) enable to characterize its smaller structures while inferring their fine anatomical connectivity, as well as their microstructure using diffusion MR microscopy.Methods
Ex-vivo specimen - A formalin-fixed post-mortem human brainstem was soaked in a phosphate-buffered saline solution for rehydratation during 3 weeks before the acquisitions.
UHF-MRI protocol – A dedicated MRI protocol was tuned including two anatomical scans using spin-echo sequences with the following parameters: anatomical scans: isotropic 185µm/100µm resolution, TE=26.5/20ms, TR=13000/500ms; diffusion-weighted (DW) scans using Pulsed Gradient Spin Echo (PGSE) sequences: isotropic 300µm resolution, b=1000/3000/4500/7500/10000s/mm2, 30/30/400/30/30 directions, TE=21.3/23.3/24.6/40.3/55.3ms, TR=5500/6000/9000/9500/11000ms, δ=4.3ms, Δ=11/13/14.4/30/45ms; T2-mapping scan using MSME sequence: isotropic 300µm resolution, 12echoes, 12averages, TE=6.4ms.
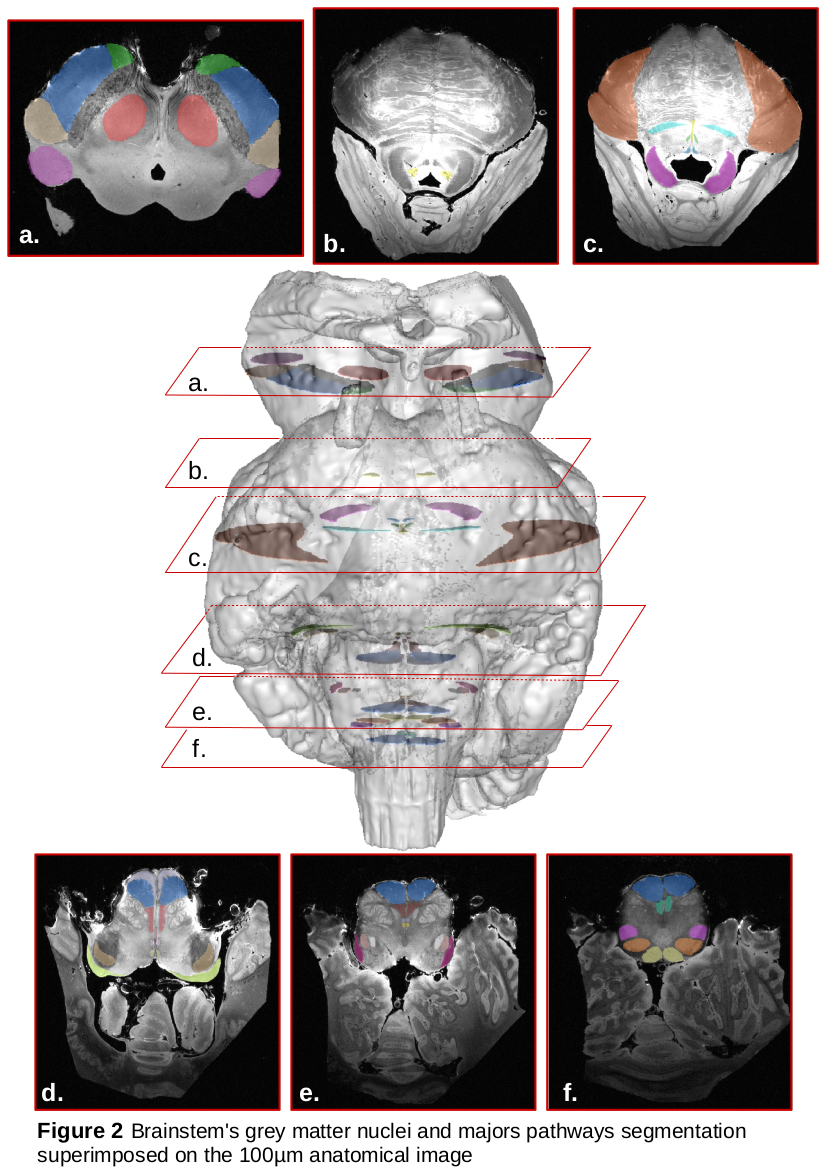
Manual delineation of the structures – Thanks to the enhanced contrast, fine gray structures were segmented like the locus coeruleus (LC). Similarly, to segment white matter (WM) bundles, specific ROIs corresponding to the main passageways of the major fascicles were drawn(2).
Connectivity mapping – a field of HARDI Q-ball model was computed using the acquisition at b=4500s/mm2 using a 8th order decomposition with a regularization factor of 0.006(3) on the entire brainstem mask. A connectogram was then inferred using the probabilistic streamline fiber tracking algorithm(4) of Connectomist(5) with the following parameters: 8 seeds per voxel, forward step of 70µm, regularization factor of 0.14, angular threshold of 30°, yielding 1,64 millions of fibers on the entire brainstem. The former WM regions of interest were used to segment bundles of interest.
Microstructure mapping – The 5-shell DW acquisitions were used to infer the NODDI6 model after preliminarily correcting for their varying echo times using the obtained T2-map obtained. It provided quantitative maps of the neurite density (fintra ), fixing the local principal direction estimated from the jointly estimated DTI model and the diffusivities to d//=5.2.10-10m2/s, diso=2.0.10-9m2/s.
Results and Discussion
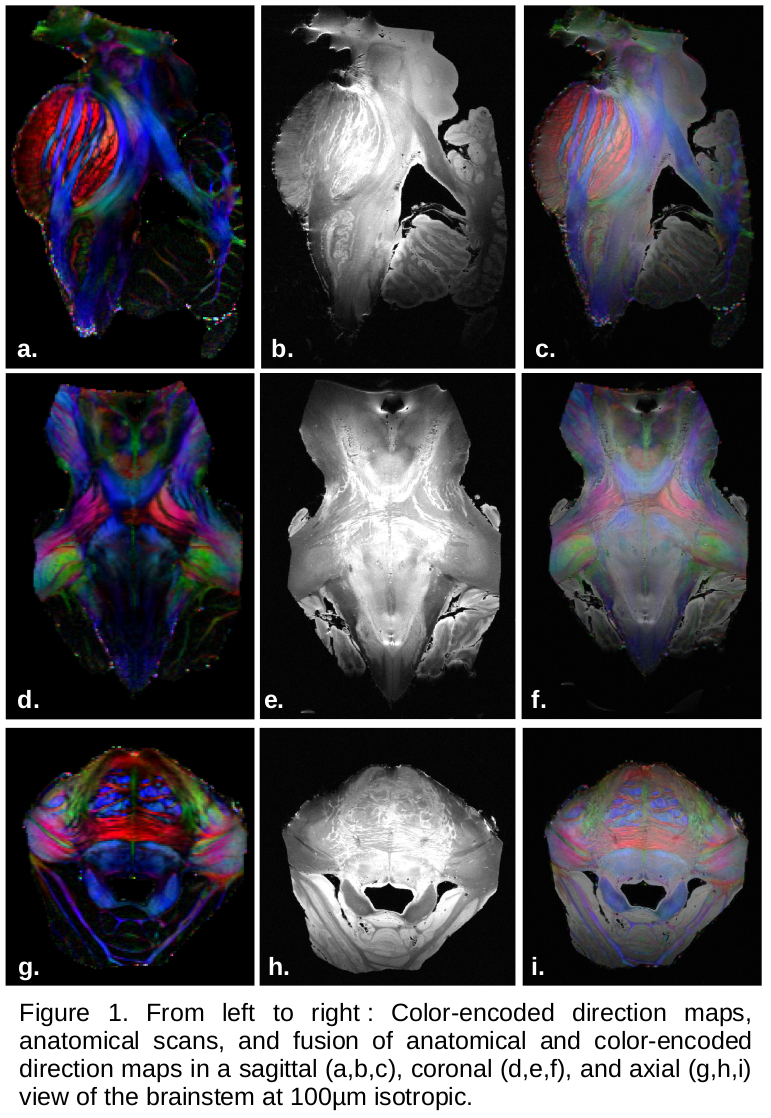
Figure1 depicts the anatomy and the color-encoded direction (CED) map with an ultra-high spacial resolution of 100µm for the anatomy and 300µm for the diffusion. The anatomical scans, presenting a very good contrast at 11.7T, allowed to directly visualize major white matter tracts (cortico-spinal, medial lemniscus, middle cerebellar peduncule,..) and to finely delineate the brainstem's structures like the locus ceruleus (Figure2).
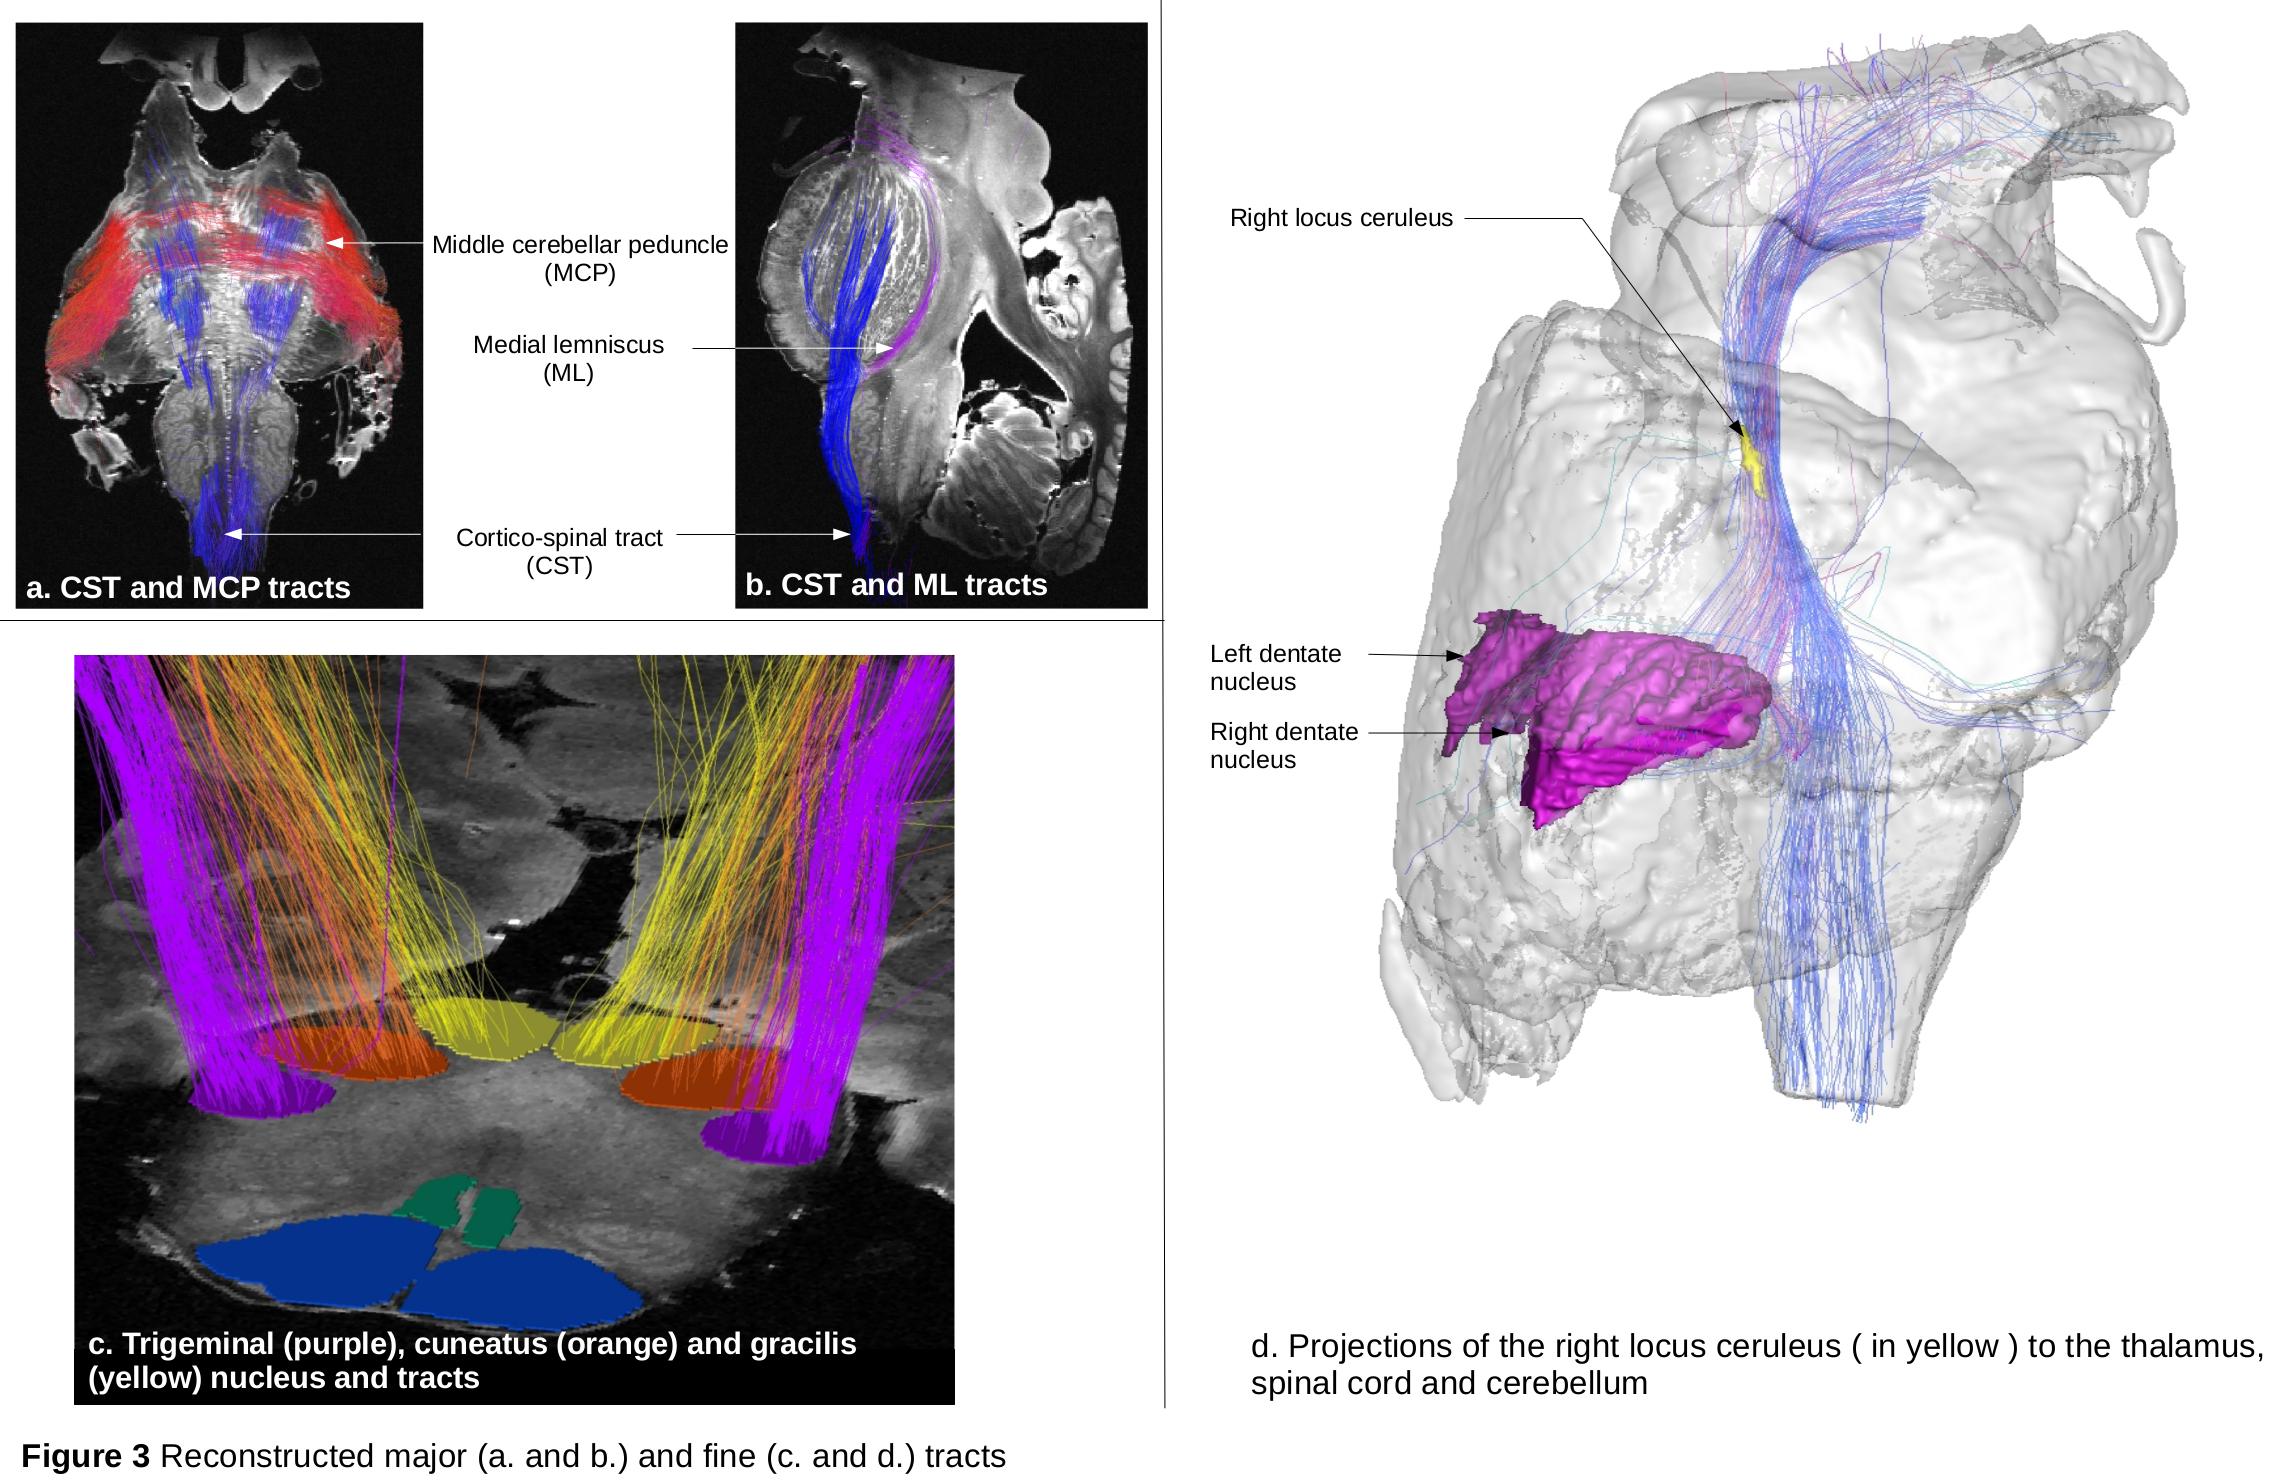
Figure3 represents the major white matter
bundles by selecting their constitutive fibers with intersection
rules established from the former delineated ROIs. Projections of the LC were reconstructed (Fig3.d)
and highlight connections with the cerebellum (via the dentate
nucleus), the thalamus and the spinal cord, as expected7. Being able to map the connectivity of the locus coeruleus is indeed of major
importance to better understand the rapid eye movement sleep
disorders occuring during the development of Parkinson's disease.
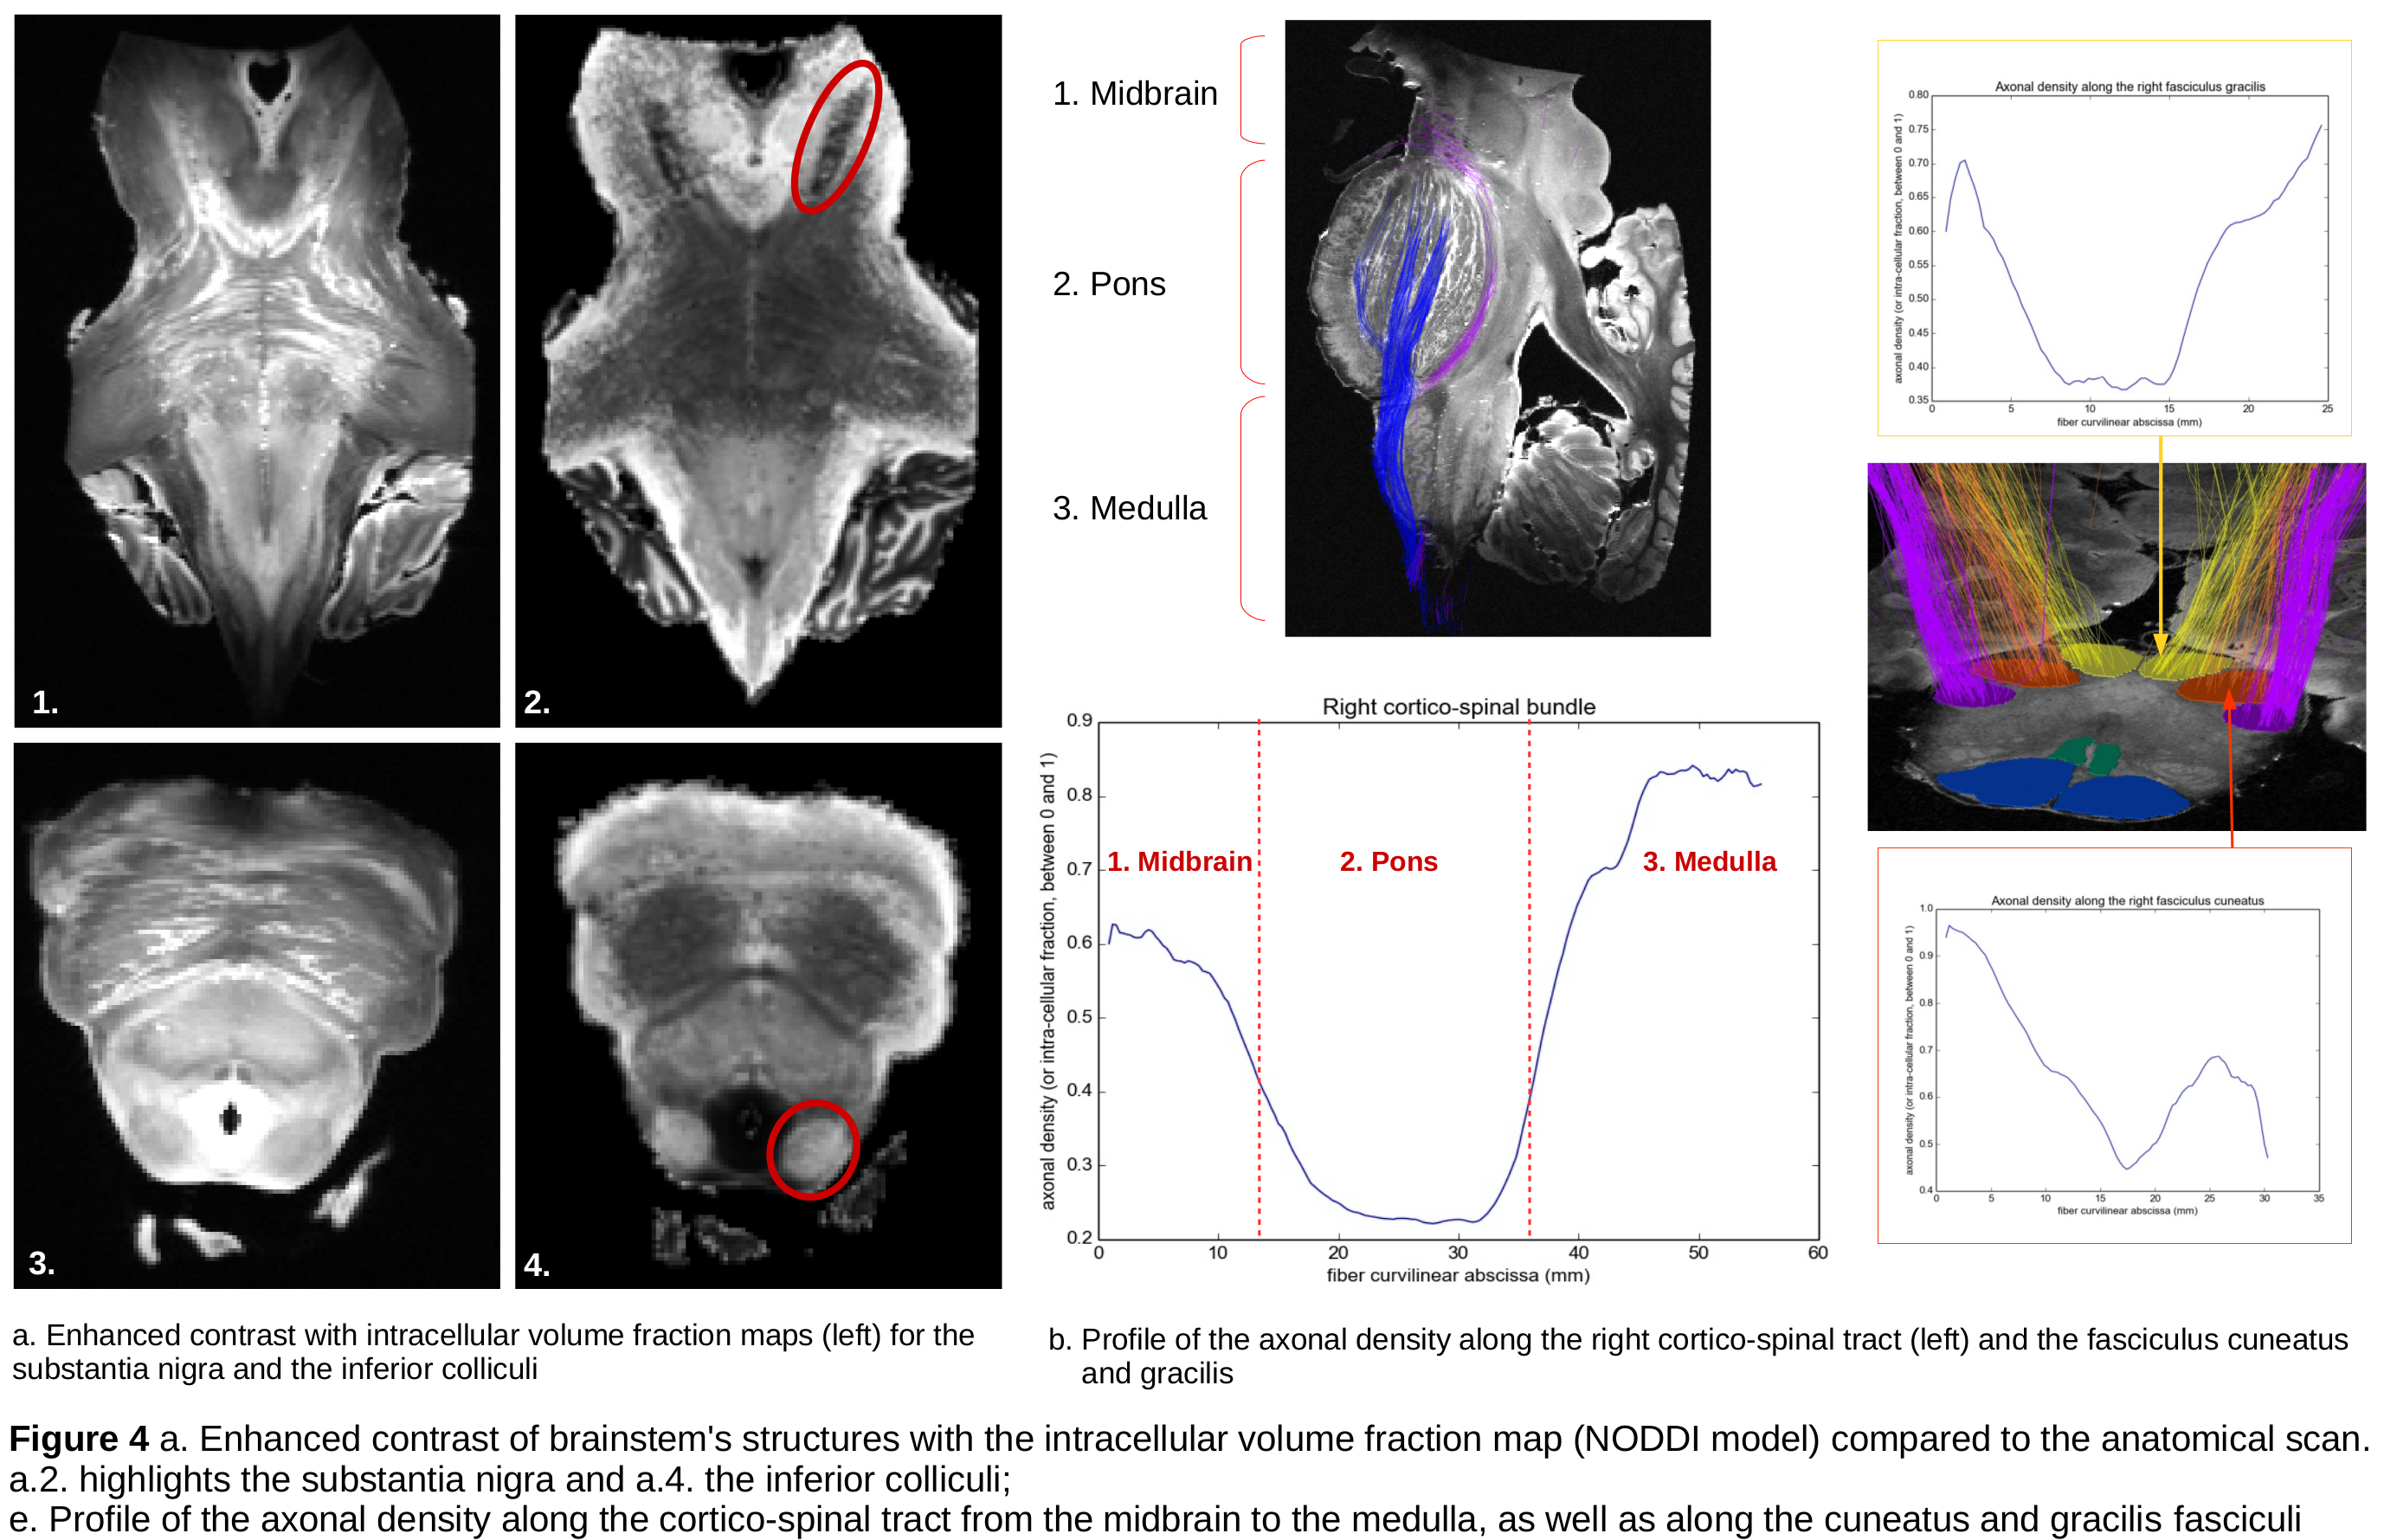
Figure4 shows how the intracellular volume fraction map, obtained from NODDI modeling, enables to accurately delineate brainstem sub-structures, like the substantia nigra or the inferior colliculi, compared to the classical anatomical scan. The axonal density profiles along tracts were computed for several segmented bundles and clearly depict significant variations that need to be further investigated. For instance, the cortico-spinal tract displays a decreasing density in the pons and a very high density in the medulla, when the fibers band together.
Conclusion
In this work, we demonstrated that UHF-MRI and diffusion MR
microscopy is powerful to map not only the inner structures of the
brainstem, but also its fine connectivity revealed by HARDI-based
tractography, as demonstrated by the mapping of the structural connectivity
of the locus coeruleus.The enhanced contrast brought by diffusion
multicompartmental models such as NODDI, that reveals the microstructure
of the brainstem, was assessed, thus allowing to go a step forward in the
undertstanding of its anatomo-functional organization. These
first results encourage to further investigate this unique high
resolution DW dataset to develop a novel atlas of the brainstem
connectivity and its microstructure.Acknowledgements
This work was partially funded by the European FET Flagship ‘Human Brain Project’ (SP2) FP7-ICT-2013-FET-F/604102References
1. Aggarwal, Manisha, et al. "Feasibility of creating a high-resolution 3D diffusion tensor imaging based atlas of the human brainstem: a case study at 11.7 T." Neuroimage 74 (2013): 117-127.
2. Naidich, Thomas P., et al. Internal architecture of the brain stem with key axial section. Springer Vienna, 2009.
3. Descoteaux, Maxime, et al. "Regularized, fast, and robust analytical Q-ball imaging." Magnetic Resonance in Medicine 58.3 (2007): 497-510.
4. Perrin et al. Inf. Proc. Med. Imag. 2005, 19:52-63;
5. Duclap et al. Proc.ESMRMB, Lisbon, Springer
6. Zhang, Hui, et al. "NODDI: practical in vivo neurite orientation dispersion and density imaging of the human brain." Neuroimage 61.4 (2012): 1000-1016.
7. Malenka, R. C., E. J. Nestler, and S. E. Hyman. "Chapter 6: Widely Projecting Systems: Monoamines, Acetylcholine, and Orexin." Sydor A, Brown RY. Molecular Neuropharmacology: A Foundation for Clinical Neuroscience (2nd ed.). New York: McGraw-Hill Medical (2009): 147-148.
Figures