0059
Topography preserving tractography for mapping human brain pathways1Stevens Neuroimaging and Informatics Institute, University of Southern California, Los Angeles, CA, United States
Synopsis
Topographical organization is an integral property of brain’s neural pathways. In this work we propose a novel approach to quantify the topographic preservation of fiber bundles obtained using dMRI based tractography. For that we used the well known organization of the somatosensory pathway. In our study we compared the tractograms obtained using our recently developed tractography algorithm with MRtrix's iFOD1 and iFOD2 probabilistic techniques. We believe topographical organization is critical to take into consideration for tractography research for both validation purposes as well as for developing better performing tractography algorithms.
INTRODUCTION
Topographical organization is fundamental to brain’s neural pathways. Some of the well-known examples include the retinotopic organization of the visual pathway, the somatotopic organization of the somatosensory pathway, and the tonotopic organization of the auditory pathway [1,2]. In this work we propose a novel approach to quantify topographic preservation of fiber bundles obtained using dMRI based tractography. For this purpose, we show results from corticospinal tracts (CST) obtained using our recently developed novel tractography technique that preserves both topographic and geometric regularity of fiber systems [3]. We compared the results both qualitatively and quantitatively with MRtrix's iFOD1 and iFOD2 probabilistic algorithms [4].
METHODS
Topography preservation index (TPI): Topographic alignment implies that tracks initiate from close seed locations project also to close locations on the target. One well known major pathway in brain that has this property is the CST. We propose to use the somatotopic organization, in particular the portion from the internal capsule to precentral gyrus to study topographic preservation of tractograms. By assigning a scalar value to each fiber based on its initialization location on internal capsule, we develop a novel technique to measure how well the organization is preserved on the target ROI. Our technique can be summarized in 6 steps:
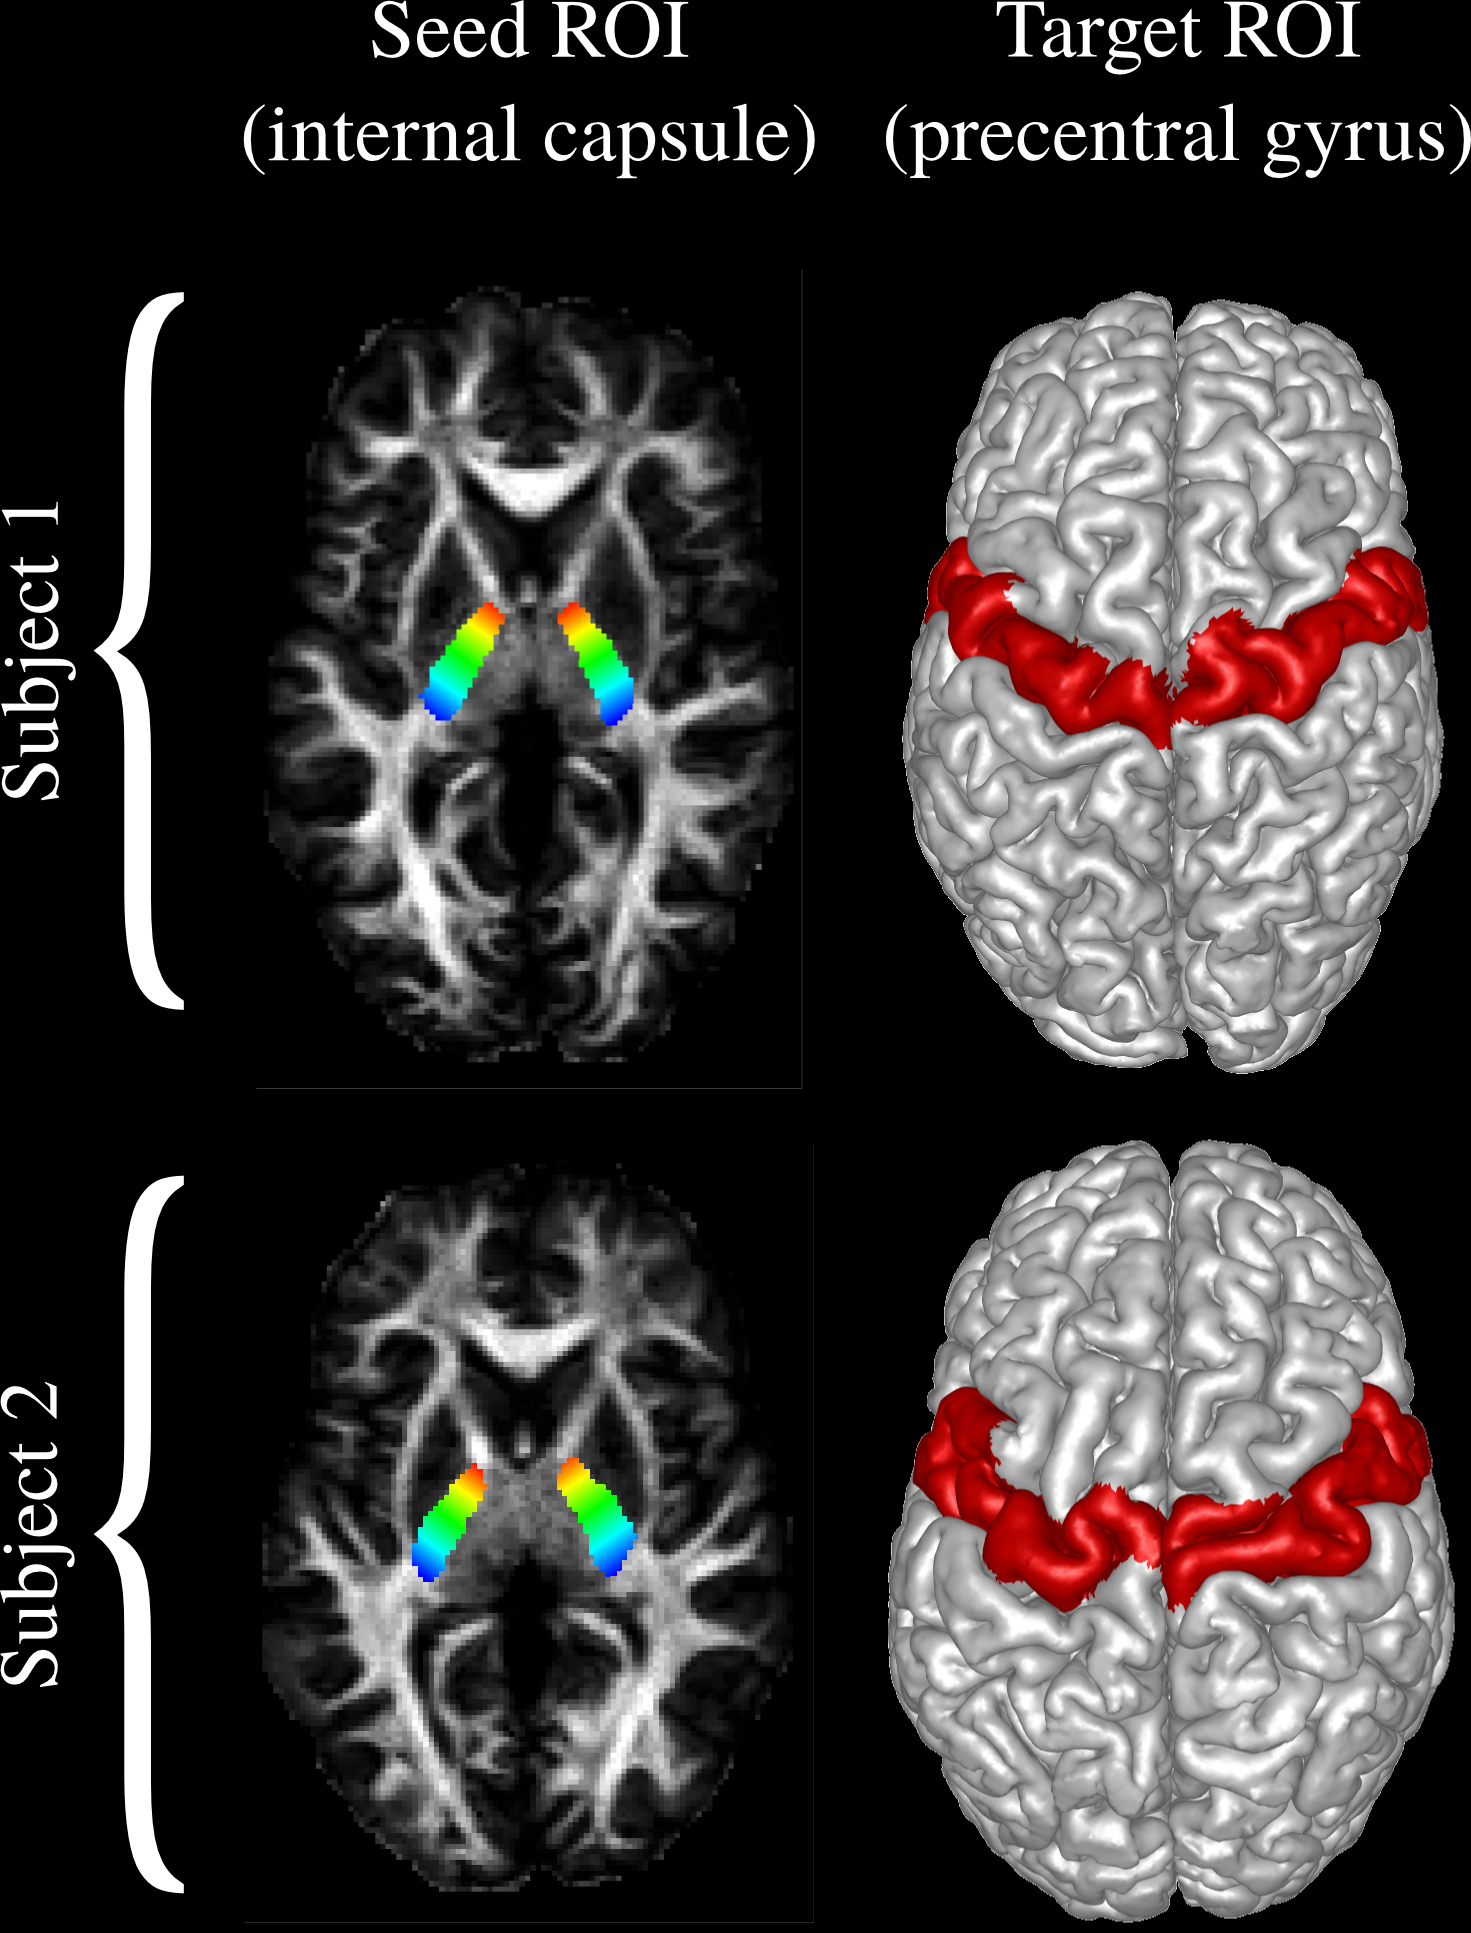
Step 1. Use a single axial slice of internal capsule as seed ROI and generate tracks projecting to the precentral gyrus.
Step 2. For each track, $$$v_i$$$, assign a scalar value, $$$u_i$$$, where $$$i$$$ denotes the index of the fiber and $$$u_i$$$ linearly varies from 0 to 1 along posterior to anterior direction on the internal capsule.
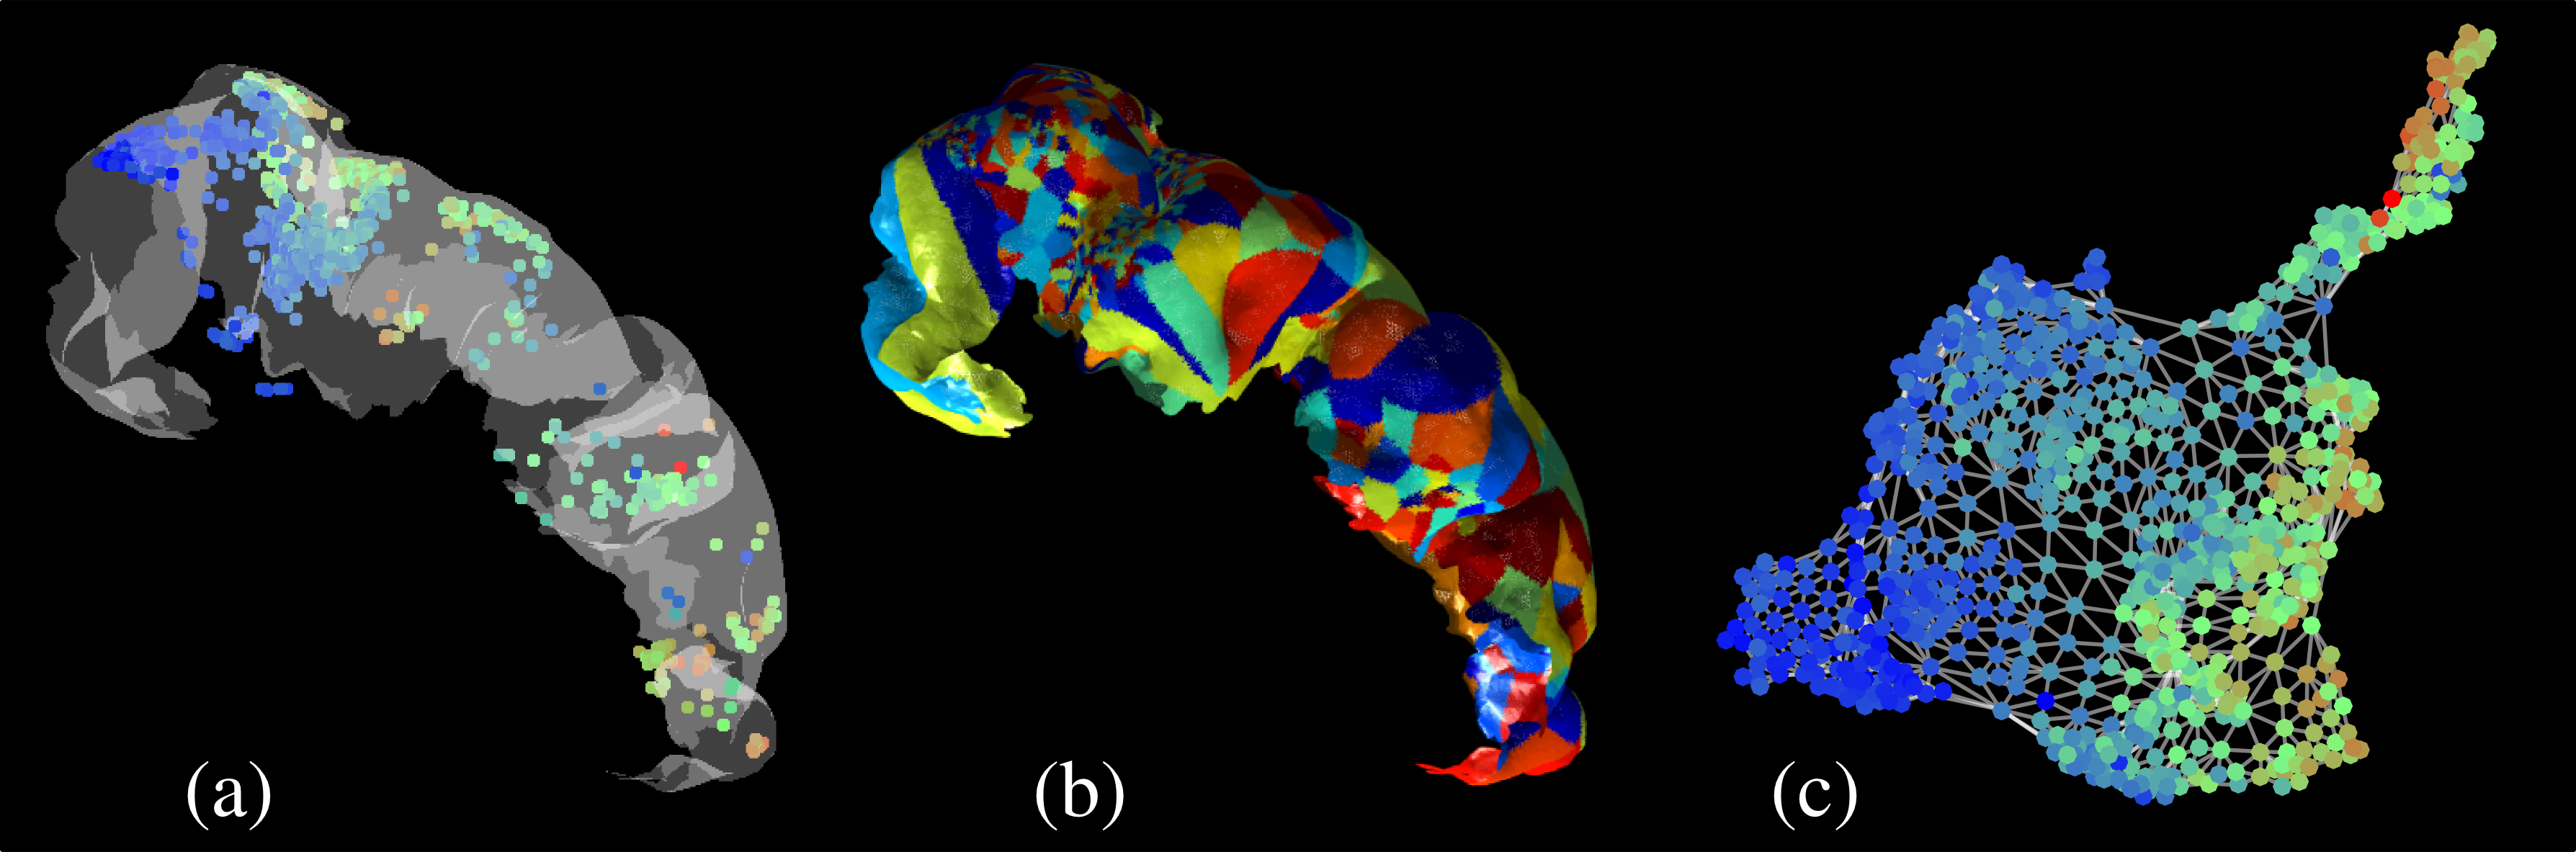
Step 3. For each track, obtain the projected vertex on the precentral gyrus.
Step 4. Compute the graph, $$$G(V,E)$$$ that is the geodesic Delaunay triangulation obtained using the projected vertices.
Step 5. For each edge, $$$E=\{v_i,v_j\}$$$, assign an edge weight of $$$w_k=|u_i-u_j|$$$
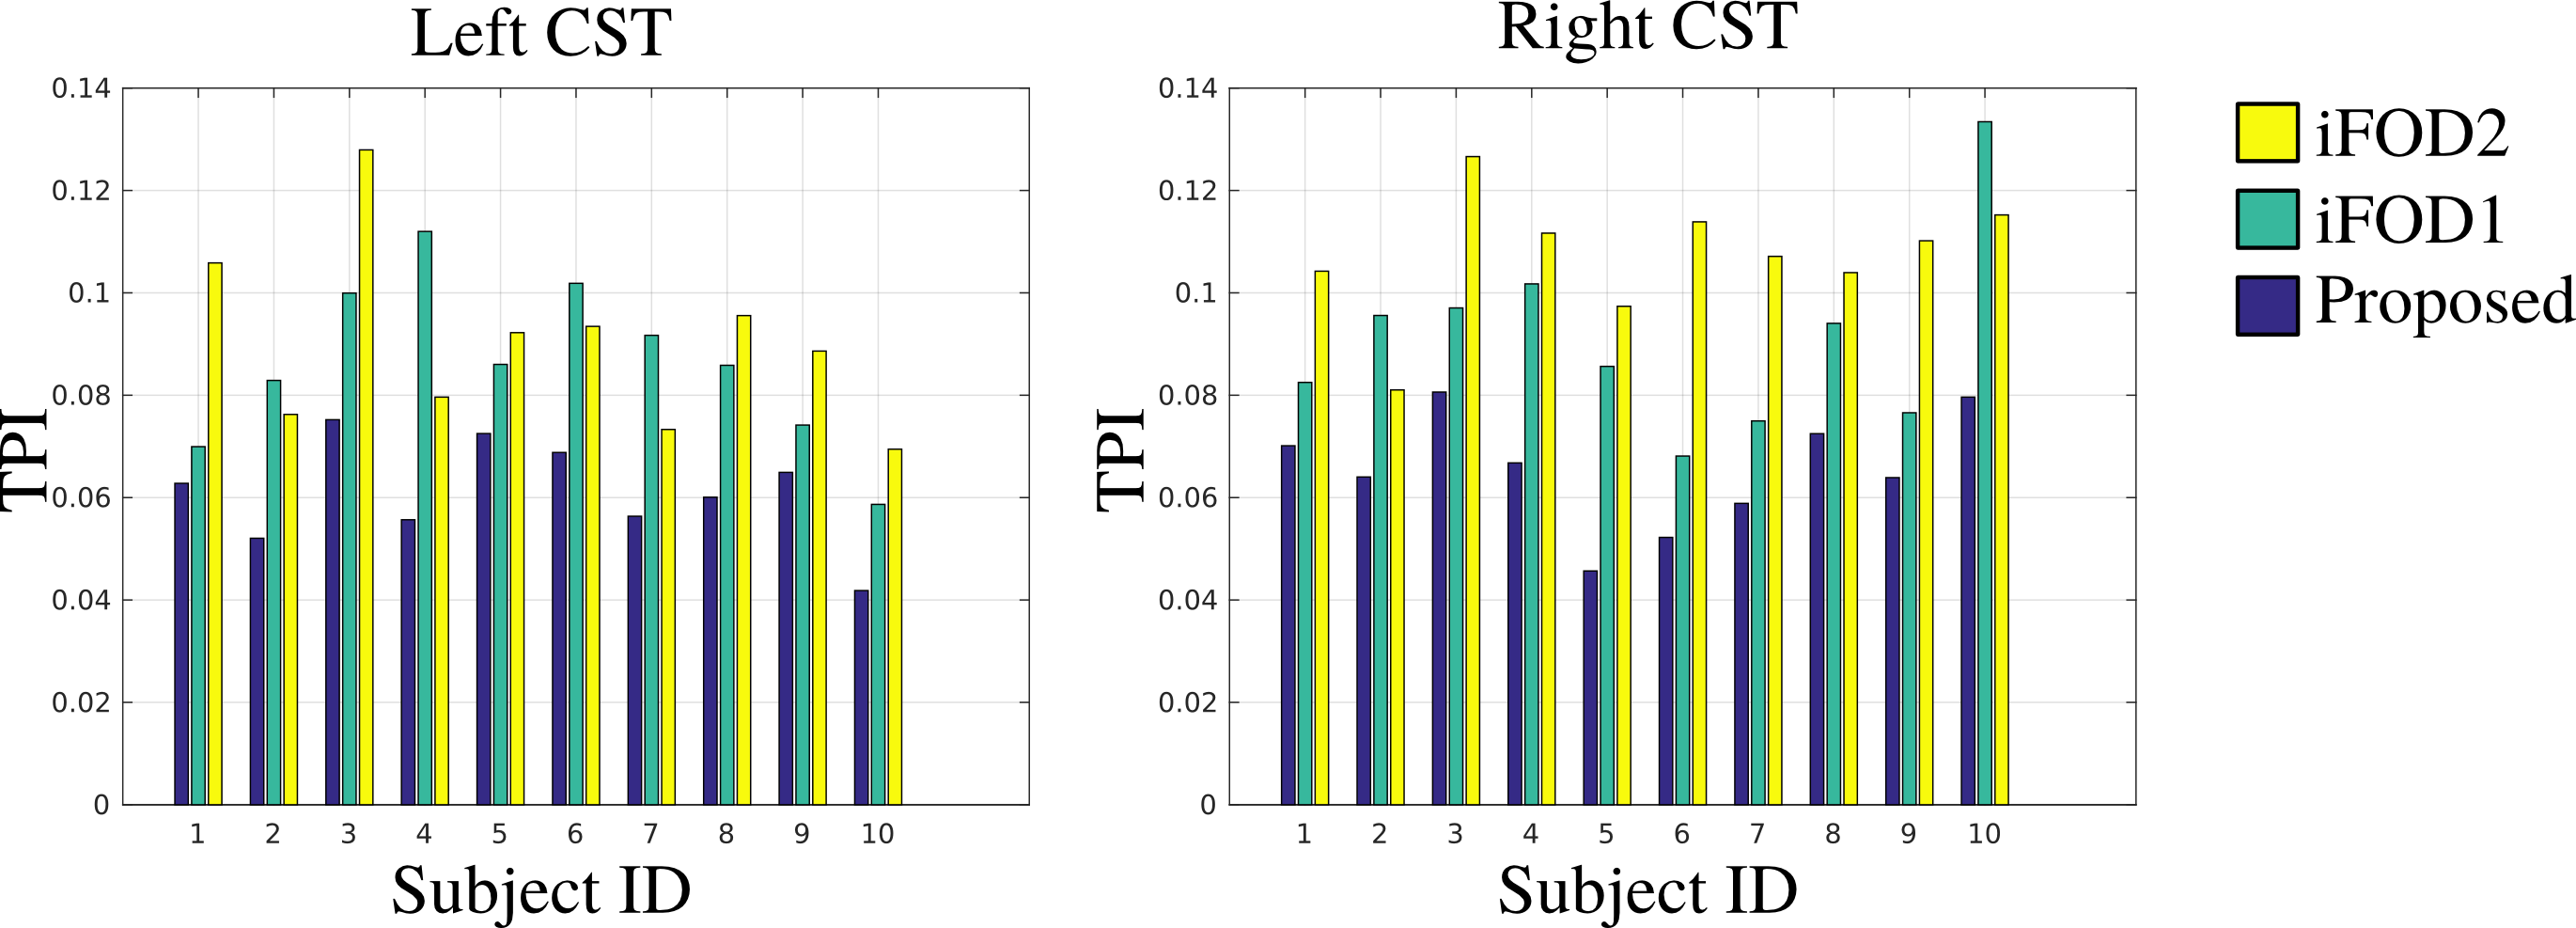
Step 6. Assign the average edge weight as the topography preservation index, $$$\text{TPI}=\sum_{k=1}^{L}w_k/L$$$.
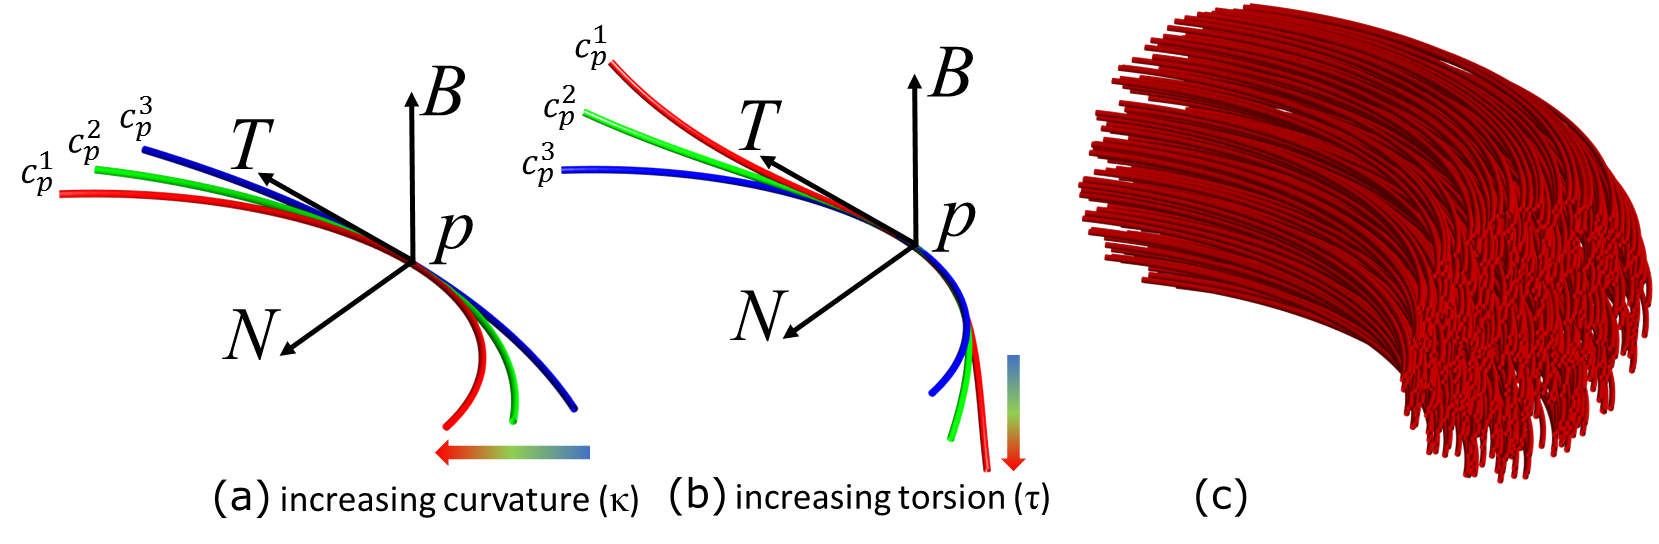
Tractography technique: We model each fiber as an integration of smooth segments,$$$\gamma(s)$$$, that are arc length parameterized,$$$s$$$, using the Frenet-Serret frame shown in Figure 1. Given seed point $$$p=\gamma(s=0)$$$, we create candidate curves, $$$c_p$$$, by randomly generating $$$T(0),N(0),B(0),\kappa$$$ and $$$\tau$$$. For each candidate, we estimate the data support using the following function.$$\mathcal{L}(\mathcal{D} \mid c_p)= \frac{1}{4/3 \pi r^3} \int_{\forall c \parallel c_p} \int_{\mid p-\gamma_c(s) \mid \leq r} \mathcal{D}(\gamma_c(s),T_c(s))dsdc$$where $$$\mathcal{D}$$$ is the fiber orientation distribution (FOD) field and $$$\mathcal{D}(p,T)$$$ is the amplitude of the spherical function at point $$$p$$$ for direction $$$T$$$. $$$c \parallel c_p$$$ denotes a curve parallel to $$$c_p$$$. $$$\gamma_c(s)$$$ and $$$T_c(s)$$$ denote the point and the tangent on $$$c$$$ at arc length $$$s$$$ respectively. $$$r$$$ is the user defined radius for the integration. We make a decision to move to the next curve, using the Bayes' rule and rejection sampling [3].
EXPERIMENTAL SETUP
We used multi-shell images of 10 subjects from the Q1 release of HCP. FODs are computed using our recently proposed algorithm [5]. For all of the tractography techniques, we used the same seed ROIs that were manually marked. The target ROI is obtained using Freesurfer [6]. Figure 2 shows the seed and target ROIs on two of the subjects.RESULTS
Figure 3 shows the validation steps performed on the right hemisphere of subject 1 using our tractography technique. A graph with neighboring vertices with close colors indicates better topographical preservation.
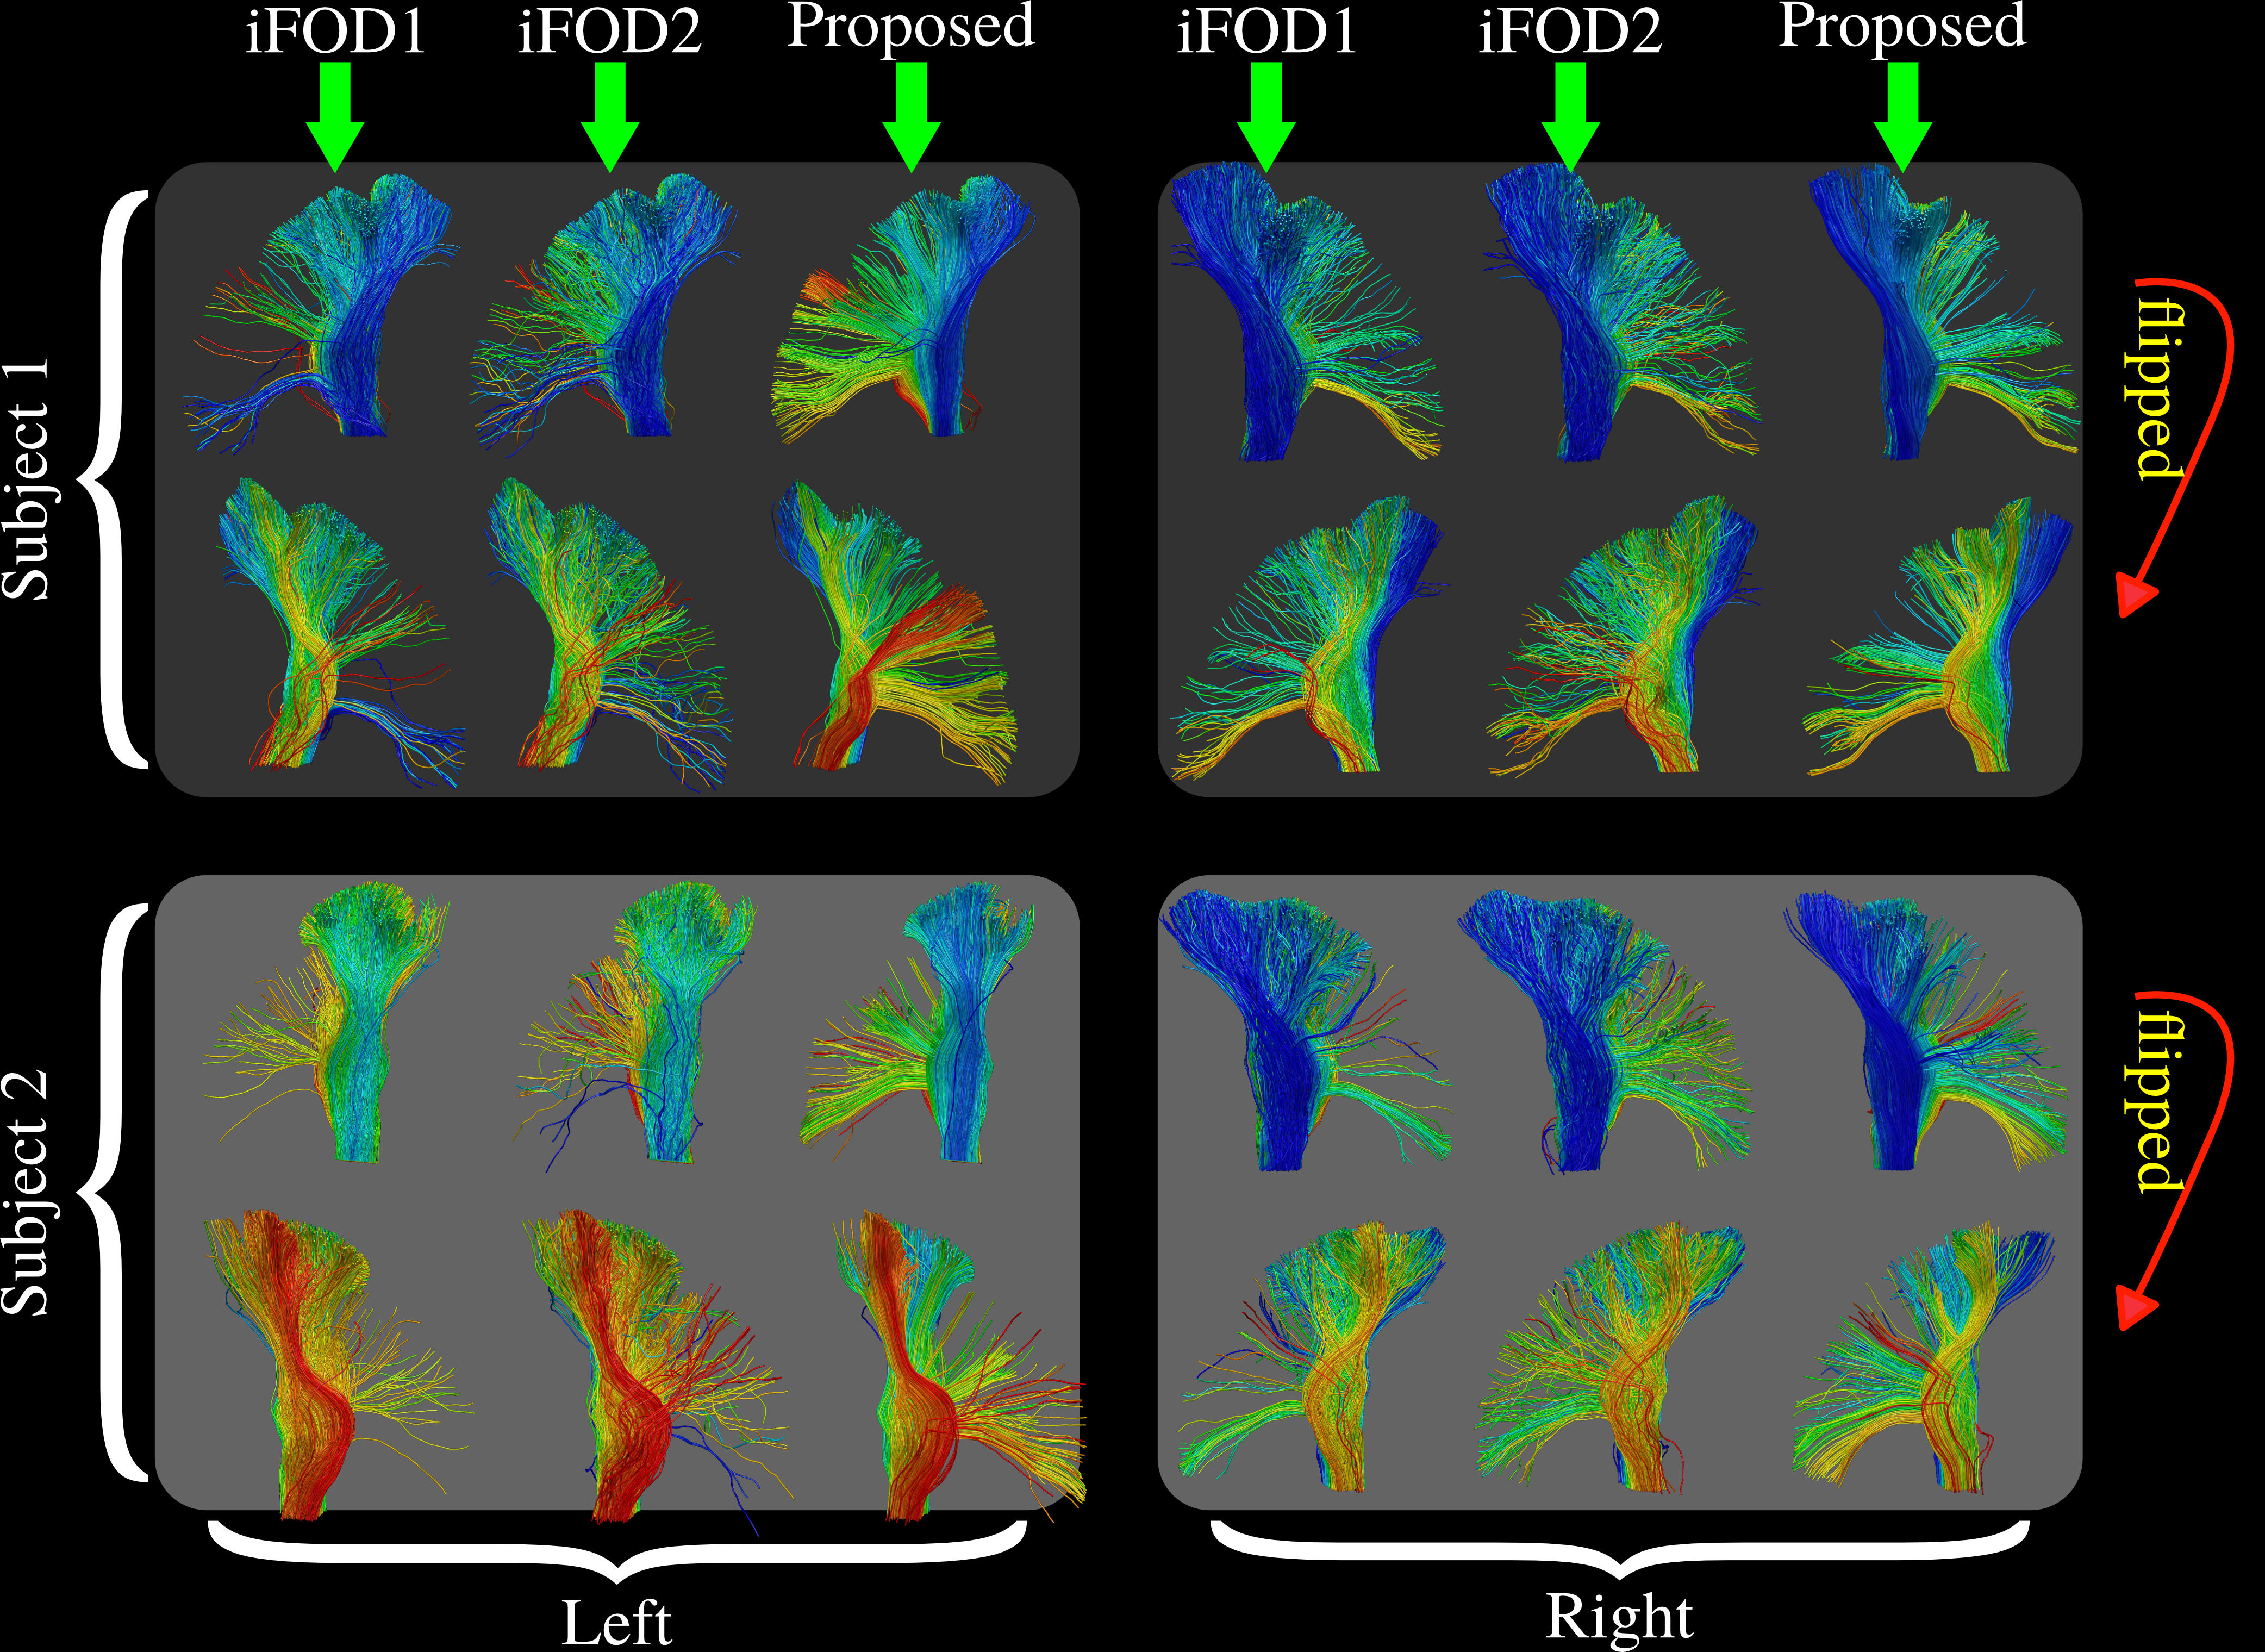
Figure 4 shows side by side visual comparisons of the CST tractograms obtained using iFOD1, iFOD2 and our technique. Colors of the fibers represent the scalar value assigned from the seed ROI shown in Figure 2.
Figure 5 shows the quantitative TPI values obtained for all the subjects.
DISCUSSIONS
Somatotopic organization of motor pathways in the internal capsule is mostly known [7] and in this study, this important anatomical information is used for comparing the performance of our recently developed tractography technique with MRtrix's iFOD1 and iFOD2 algorithms. Both visual and quantitative analysis show that compared to iFOD1 and iFOD2, our approach is superior in preserving topographic alignment of fiber bundles. In our analysis iFOD1 mostly performs better than iFOD2. Both results are consistent with our earlier study where we used the topographical organization of the optical radiation for comparison [3].
CONCLUSIONS
In this work, we proposed a novel technique that can be used for the validation of tractograms. Our approach is based the topographical organization of neural pathways which is an integral property of the brain. We believe this important anatomical information is critical to take into consideration for tractography research for both validation purposes as well as for developing better performing tractography algorithms.Acknowledgements
This work was in part supported by the National Institute of Health (NIH) under Grants R01EB022744, K01EB013633, P41EB015922, P50AG005142, U01EY025864, U01AG051218.
References
[1] Udin S B, Fawcett J W. Formation of Topographic Maps. Annual Review of Neuroscience 1988;11(1):289–327
[2] Patel G H, Kaplan D M, Snyder L H. Topographic Organization in the Brain: Searching for General Principles. Trends in Cognitive Sciences 2014;18(7): 351–63
[3] Aydogan D B, Shi Y. Probabilistic Tractography for Topographically Organized Connectomes. Medical Image Computing and Computer-Assisted Intervention - MICCAI 2016: 19th International Conference, Athens, Greece, October 17-21, 2016, Proceedings, Part I:201-209
[4] Tournier J D , Calamante F, Connelly A. Improved probabilistic streamlines tractography by 2nd order integration over fibre orientation distributions. In: Proceedings of 18th Annual Meeting of the International Society for Magnetic Resonance in Medicine (ISMRM), 2010; 1670
[5] Tran G, Shi Y. Fiber Orientation and Compartment Parameter Estimation From Multi-Shell Diffusion Imaging. IEEE Transactions on Medical Imaging 2015; 34(11):2320–32
[6] Fischl B, Salat D H, Busa E, Albert M, Dieterich M, Haselgrove C, van der Kouwe A, Killiany R, Kennedy D, Klaveness S, Montillo A, Makris N, Rosen B, Dale A M, Automated Labeling of Neuroanatomical Structures in the Human Brain. Neuron 2002; 33:341-355
[7] Duerden E G, Finnis K W, Peters T M, Sadikot A F. Three-Dimensional Somatotopic Organization and Probabilistic Mapping of Motor Responses from the Human Internal Capsule. Journal of Neurosurgery 2011; 114(6): 1706–14
Figures