0054
Combined DTI-derived metrics capture acute structural alterations in sports-related mild TBI (mTBI)1School of Medicine and Dentistry, University of Rochester, Rochester, NY, United States, 2School of Medicine and Dentistry, University of Rochester, 3Radiology, University of Rochester, 4Neurology and Public Health, University of Rochester Medical Center, 5Center for Brain Imaging, University of Rochester
Synopsis
Traumatic brain injury (TBI) is a source of considerable cost to society. Measures have been taken to increase awareness of possible injury, with safety precautions following suit. Despite this vigilance, the possibility of underdiagnosis is a reality. In this abstract, we seek to explain DTI-derived metrics and their application in the clinical setting. Tract based spatial statistics (TBSS), brain segmentation, and network analysis were applied to TBI and healthy cohorts to derive metrics that could aid in the diagnosis of mild TBI (mTBI), and provide a mechanism for quantification of severity and risk stratification.
Purpose
Traumatic brain injury (TBI) is a pervasive cause of injury in the United States, with incidence increasing among all age groups. Despite increased vigilance and improvements in safety, TBI remains a major source of morbidity, contributing to 30% of all injury-related deaths in the United States.1 Recent studies demonstrate the considerable effects of repeated low-impact on neural connectivity and systems integrity, even in the absence of clinically-diagnosed concussion.2 Against this background, we seek an improved understanding of the acute structural alterations following minor TBI (mTBI) among adolescent athletes with clinically-diagnosed concussion using analyses of DTI-derived global, regional and network parameters.Methods
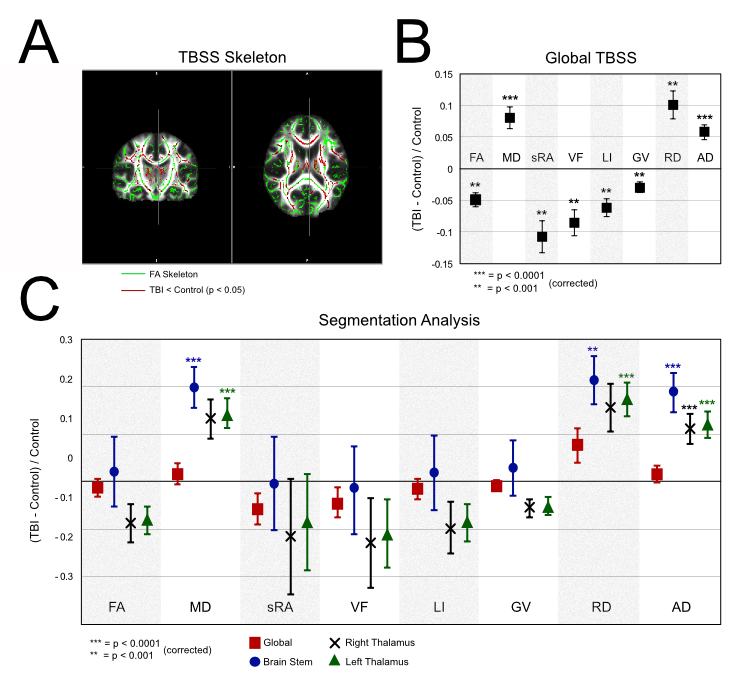
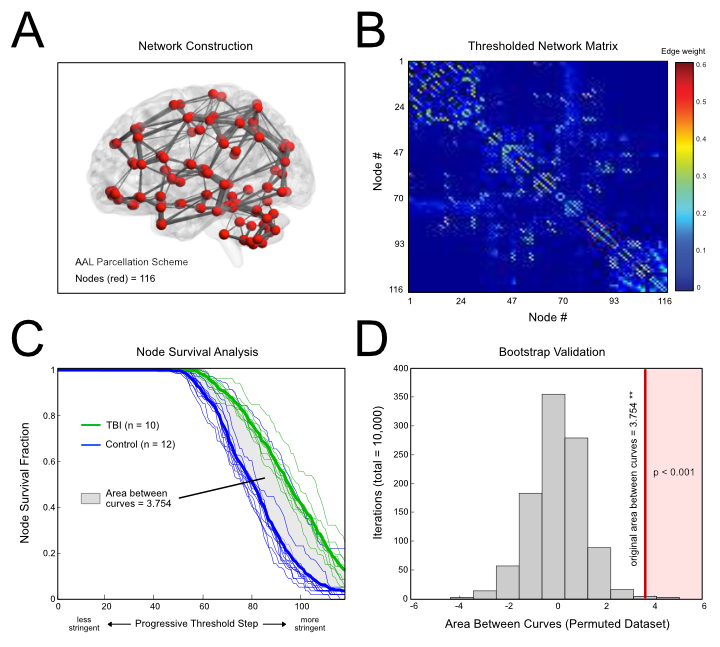
In this ongoing study, ten mTBI patients (mean ± SD age =18.0 ± 3.0 years, range = 15 – 24 years) were evaluated approximately 2 weeks post-diagnosis of sports-related concussion. Twelve age-matched healthy athletes (no concussion history) constituted the control group. High resolution diffusion tensor imaging (DTI) scans (2x2x2 mm^3 and 60 diffusion-weighted directions) were collected alongside T1-weighted images (1x1x1 mm^3) on a 3T Siemens Skyra scanner. DTI scans were processed using FMRIB Software Library,3 and T1-weighted images were used to segment subcortical structures in DTI space. Tract-based spatial statistics (TBSS) were used to compare structural measures between groups (Fractional anisotropy, FA; Mean diffusivity, MD; scaled relative anisotropy, sRA; Volume fraction, VF; Lattice Index, LI; Gamma variate, GV; Radial diffusivity, RD; Axial diffusivity, AD) (Fig. 1A-B). Probabilistic tractography was performed on each individual using the Automated Anatomical Labeling (AAL) atlas4 to seed voxels. Structural networks were derived using AAL seeds (nodes) and probabilistic white matter tractography (edges) (Fig. 2A-B). A progressive edge thresholding procedure was used to characterize network topology (i.e., node survival) (REF). Group comparisons were performed using two-tailed student’s t-test, and Bonferroni-corrected p-values (p) were evaluated using a significance threshold of p < 0.05.Results
TBSS Analysis
TBSS was performed using a generated FA skeleton (Fig 1A, green). Areas of white matter with significant group differences in FA are shown (Fig 1A, red). Global FA and its derived metrics (sRA, VF, LI, GV) were significantly reduced in the mTBI group relative to controls (all p < 0.001) (Fig. 1B). Diffusivity measurements were increased among mTBI patients versus controls (MD, AD p < 0.0001; RD p < 0.001).
Analysis of Subcortical Regions
No significant difference was seen in the global brain measurements in any of the metrics. MD of the brain stem and the left thalamus were significantly higher in the mTBI group (p < 0.0001), with a similar relationship being seen with the RD metric (Brain Stem p < 0.001, Left thalamus p < 0.0001). There was a significant increase in AD across the brain stem and the right and left thalamus (p < 0.0001). Network Analysis A progressive thresholding procedure was applied to individual network matrices to assess node dropout.5 Analysis of survival curves revealed increased node resiliency against thresholding in the mTBI group compared to controls, suggesting altered network topology (Fig 2C). The area between the curves was evaluated using a non-parametric method (i.e., Functional Data Analysis6), yielding a significant group difference (p < 0.0001) (Fig 2D).
Discussion
More sensitive measures of brain alteration are needed in TBI. Global measurements of any kind are not altered in TBI; however, measures utilizing white matter tracts and segmentation were more useful in discriminating between the two groups. Furthermore, the network data suggests that these changes are not primarily destroying tracts, rather there seems to be redistribution that makes certain edges less likely to drop out during thresholding. Further clinical implications are yet to be explored; however, the data suggests that AD is a very sensitive marker for mTBI, as it is increased significantly in all of the subcortical regions (Fig 1C) included in analysis, as well as in global TBSS (Fig 1B). In addition, node survival analysis (Fig 2C) showed a robust separation in the dropout between the two groups that could potentially be used in clinical evaluation of a patient.Conclusion
Clinical metrics sensitive to brain injury could serve to better tailor clinical protocols to individual patients. Our results suggest that the combined use of segmentation, TBSS, and tractography-based network analysis will help better understand the mechanistic nature and clinical aspects of TBI.Acknowledgements
We would like to acknowledge the NIH for the MSTP training grant, as well as the University of Rochester Medical Center.References
1. National Vital Statistics System (NVSS), 2006–2010. Data source is maintained by the CDC National Center for Health Statistics.
2. Bahrami, Naeim, et al. "Subconcussive head impact exposure and white matter tract changes over a single season of youth football." Radiology(2016): 160564.
3. Jenkinson, Mark, et al. "Fsl." Neuroimage 62.2 (2012): 782-790.
4. Tzourio-Mazoyer, Nathalie, et al. "Automated anatomical labeling of activations in SPM using a macroscopic anatomical parcellation of the MNI MRI single-subject brain." Neuroimage 15.1 (2002): 273-289.
5. Cao, Qingjiu, et al. "Probabilistic diffusion tractography and graph theory analysis reveal abnormal white matter structural connectivity networks in drug-naive boys with attention deficit/hyperactivity disorder." The Journal of Neuroscience 33.26 (2013): 10676-10687.
6. Bassett, Danielle S., et al. "Altered resting state complexity in schizophrenia." Neuroimage 59.3 (2012): 2196-2207.
Figures