0049
Diffusion Kurtosis Imaging in mild TBI patients – a Longitudinal Study1GE Global Research, Garching, Germany, 2GE Global Research, Niskayuna, NY, United States, 3Weill Cornell Medical Center, New York City, NY, United States, 4Hospital for Special Surgery, New York City, NY, United States, 5University of California, San Francisco, CA, United States, 6Houston Methodist, Houston, TX, United States
Synopsis
Diffusion Kurtosis Imaging (DKI) allows for studying microscopic changes in human brain tissue. In traumatic brain injury (TBI), this may include axonal stretching, shearing, or swelling. Particularly in mild TBI cases, effects can be subtle and standard imaging modalities fail. We study DKI in 68 mild TBI patients with normal structural imaging in a series of four exams over a 90-day period. Using tract-based spatial statistics (TBSS) we observed increased kurtosis five to ten days post-injury followed by decreased kurtosis three months later. Diffusion tensor metrics such as fractional anisotropy in this study lack the sensitivity to track microstructural changes.
Purpose
Diffusion Kurtosis Imaging (DKI) is employed to study the longitudinal changes of tissue microstructure in mild traumatic brain injury (mTBI) patients. We study relative sensitivity to disease pathology of kurtosis and diffusion tensors.Methods
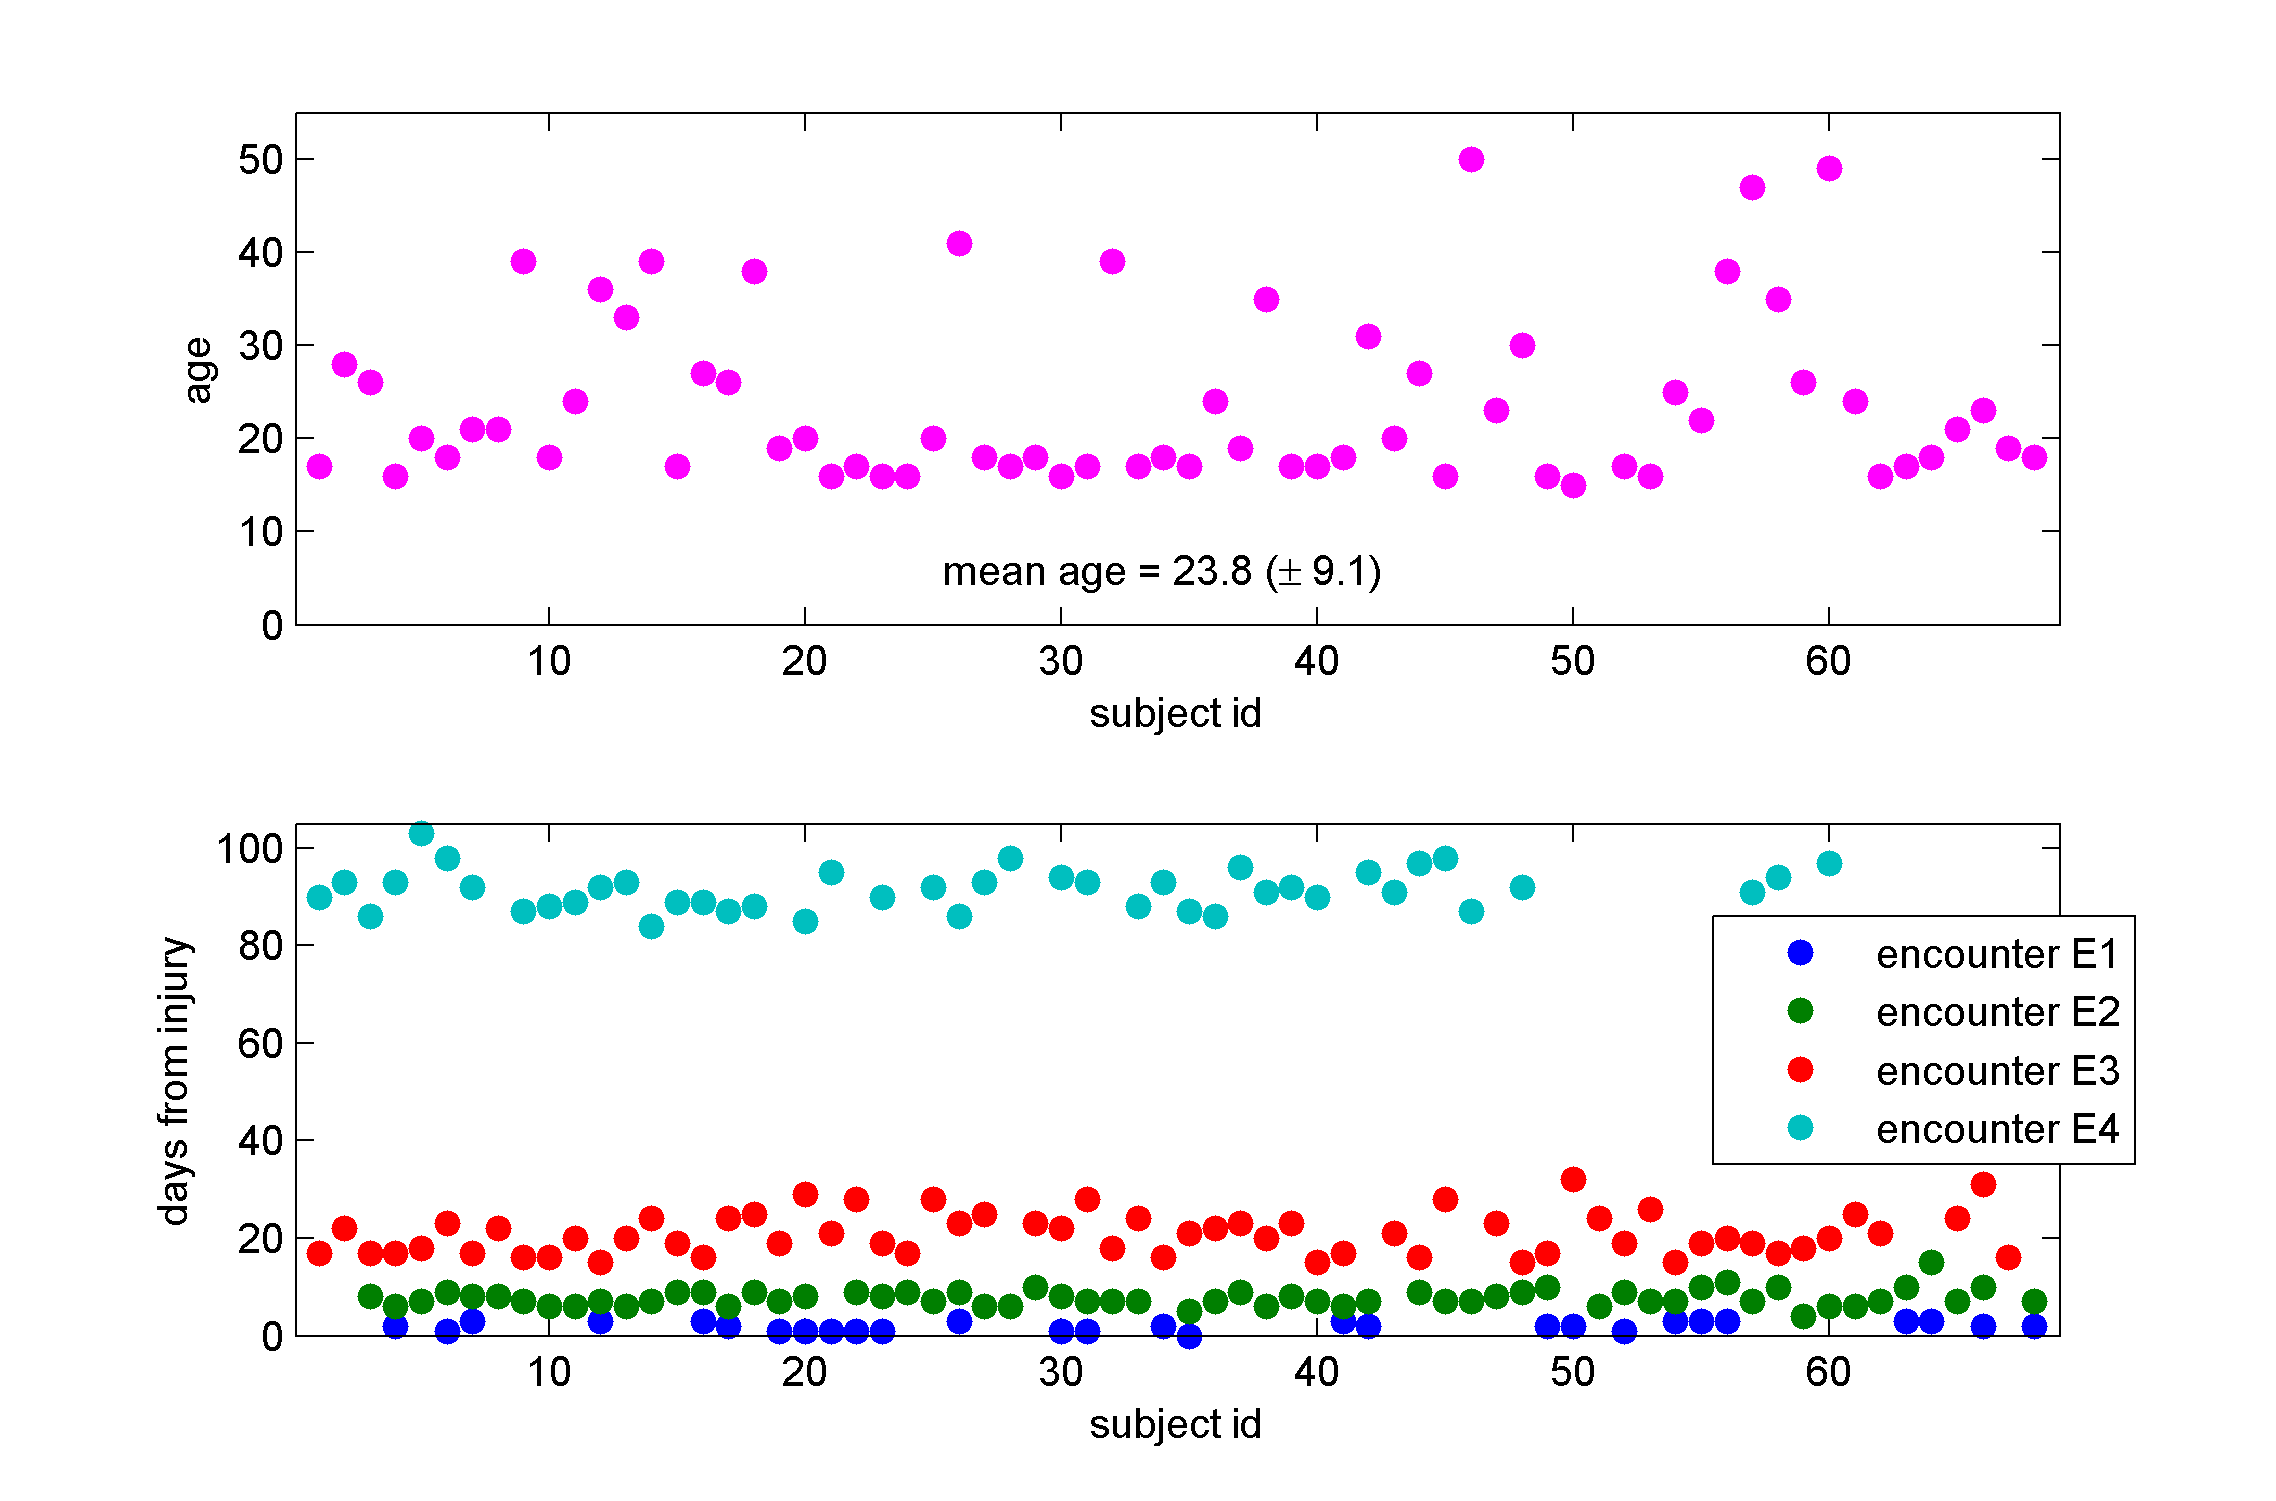
Multi-shell diffusion MR data were acquired in 68 mTBI patients with no significant radiological findings in structural MRI at up to four encounters (E1 to E4 from 3 to 90 days, 195 data sets in total, details see Fig. 1) at three clinical sites using 3T GE MR750 clinical MR scanners (GE Healthcare, Milwaukee, WI) equipped with 32-channel head coils (Nova Medical, Wilmington, MA). 140 diffusion encoding directions1 (25-40-75 directions with b = 700, 1000, 2800 mm2/s, respectively) along with eight b=0-images were acquired. Images were acquired with single shot EPI, single spin echo, multiband factor 3, parallel imaging factor 2 at 2.5 mm isotropic resolution. Motion and eddy current correction was applied using affine registration. Subsequently the data was denoised by projecting it into a space spanned by a generalized spherical deconvolution model (model based denoising technique to improve sensitivity of DKI to underlying microstructure and image quality of the kurtosis maps, for details see abstract #753). The diffusion and kurtosis tensor were fitted to the original as well as the denoised data using a weighted linear-least squares estimator2. Derived scalar metrics were computed including parallel, radial and mean diffusivity (Dpar, Drad, MD) and kurtosis (Kpar, Krad, MK) and fractional anisotropy (FA). Voxel-wise statistical analysis was carried out using TBSS (Tract-Based Spatial Statistics3), part of FSL4. For each encounter pair voxel-wise cross-subject statistics were applied using FSL permutation testing.Results
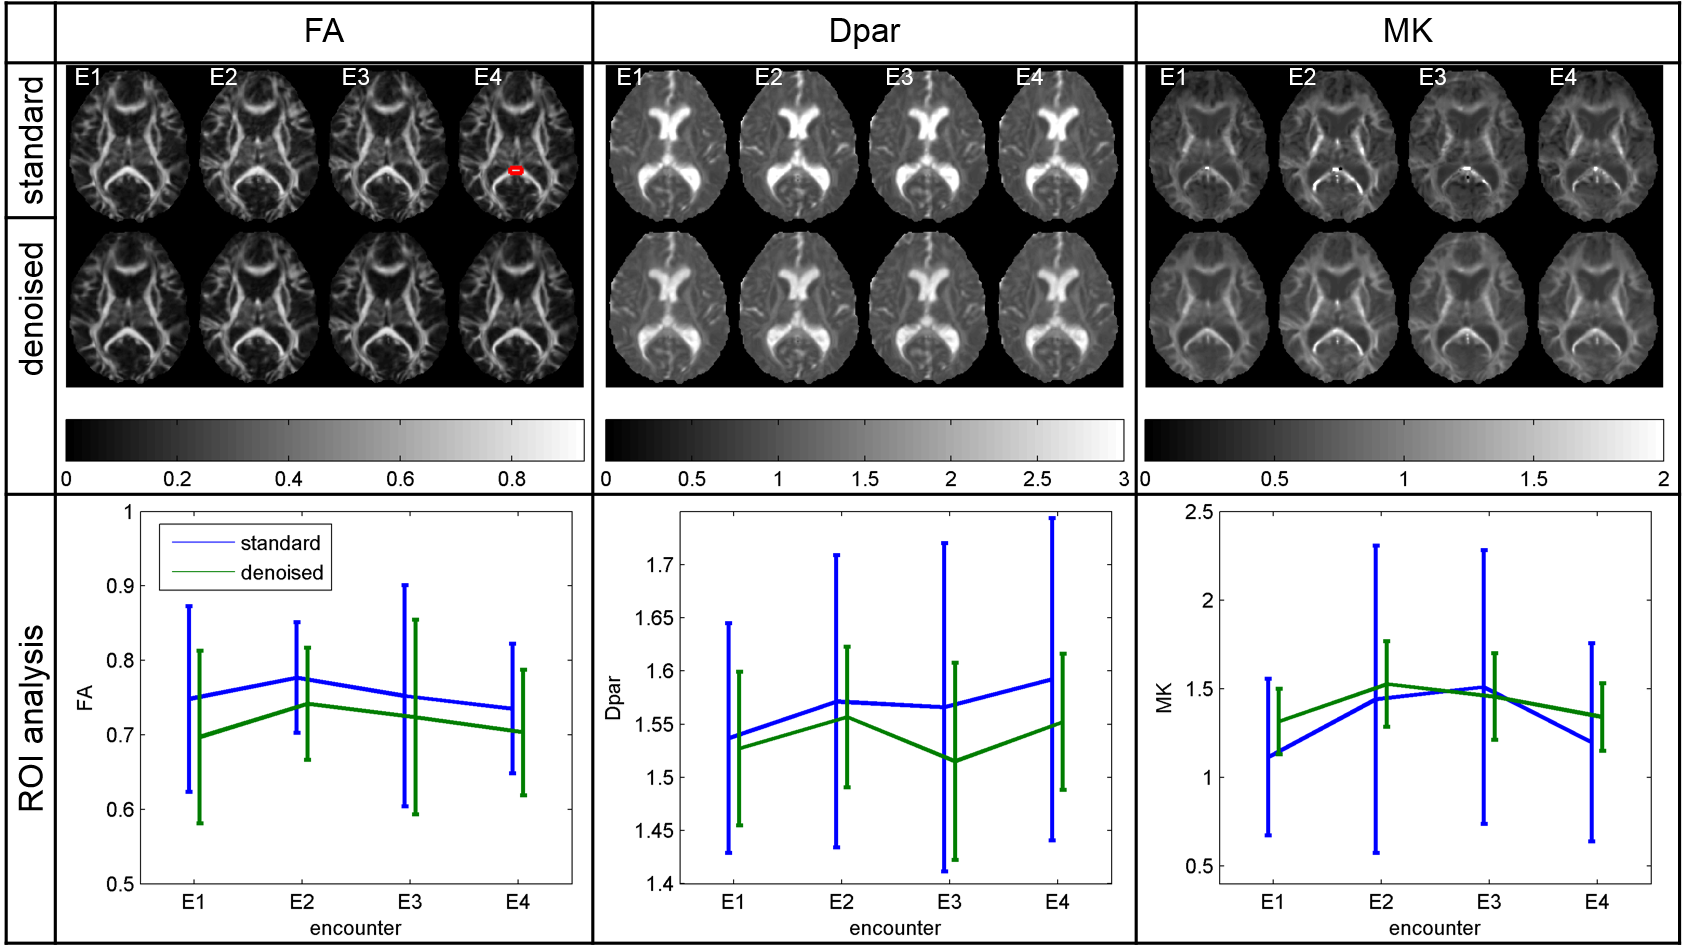
Figure 2 displays exemplary results for one subject across all four encounters. For FA, the denoising causes a small offset and the effect on the standard deviation (SD) is small. For the depicted region of interest (ROI) in the splenium, FA is increased at encounter E2 and decreases again at E4. However, this change is subtle in amplitude ($$$FA(E2)-FA(E1)=0.035$$$ with $$$SD\approx0.1$$$). For Dpar and MK, the denoising significantly reduces the SD in the ROI. Moreover, for MK the image quality is improved due to the reduction of outliers. Thus, the increase of MK around E2 is more pronounced. Here the change $$$MK(E2)–MK(E1)=0.21$$$ with $$$SD\approx0.21$$$.
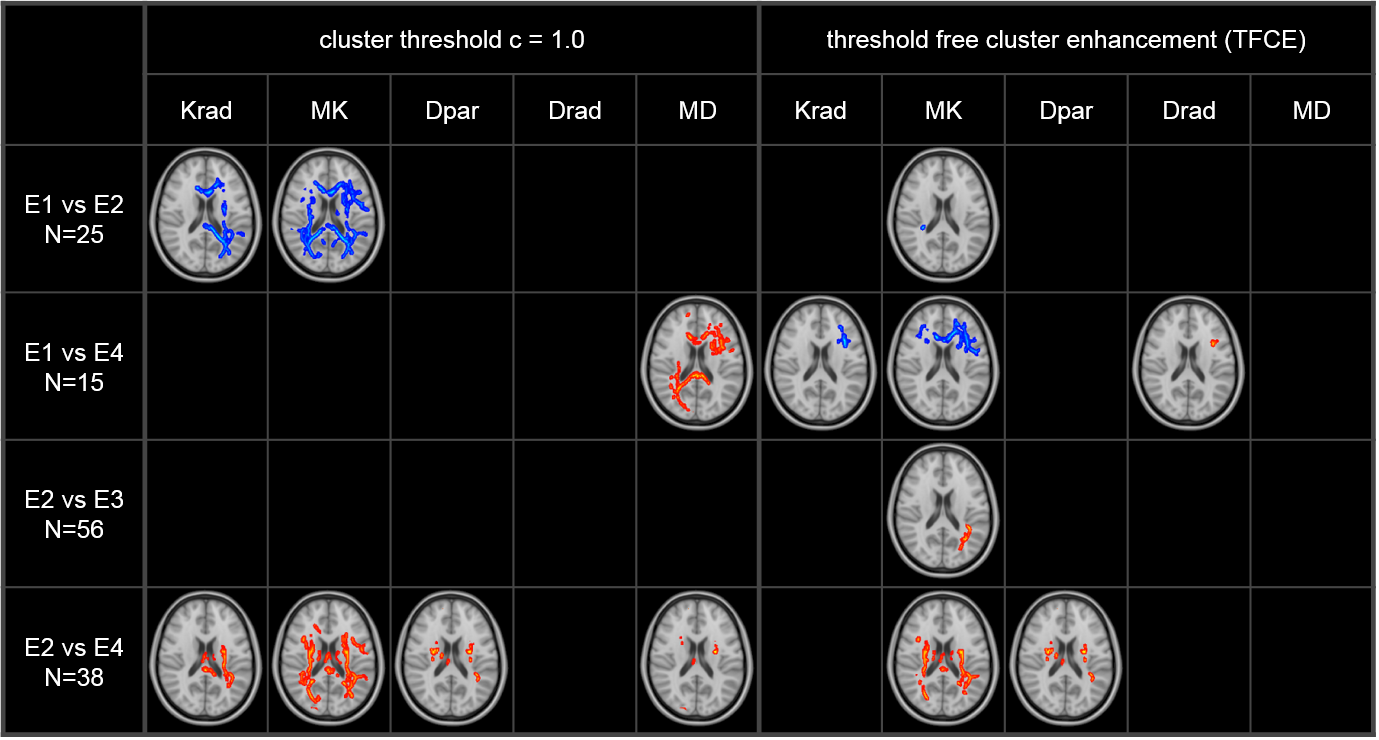
Figure 3 displays the results of TBSS statistical analysis. Results were stable with respect to number of permutations (n=2000) for given statistical level of significance (p=0.05). However, we found strong dependence of the results on the choice of clustering technique. The general picture that emerges is one of a significant increase of kurtosis in the acute phase following trauma, followed by decrease of kurtosis at 90 days. For the diffusion tensor metrics, the results are more variable depending on choice of clustering strategy. For threshold based clustering, we observe a decrease of MD from E1 to E4 and small clusters with decreased MD and Dpar between E2 and E4. Notably, no statistically significant changes are observed for FA between any pair of encounters or choice of cluster thresholding strategy.
Discussion and Conclusion
In this study, we find more widespread longitudinal change in higher-order diffusion metrics (i.e., kurtosis) than in standard diffusion metrics in a mTBI population with normal structural MRI. In our study, we observe significant microstructural changes in mTBI in the acute phase of the disease, as indicated by increased kurtosis 3 to 7 days after trauma. Reduction of kurtosis follows for the entire duration of the study. In a previous study5, Yuh et al reported no longitudinal changes in diffusion tensor imaging metrics in mTBI patients with no structural MRI findings. More recently, Lancaster et al6 studied a cohort of sport-related concussion patients using DKI and also observed an increased kurtosis and decreased MD from 1 to 8 days after injury. We speculate that in a mTBI population with no pathoanatomic abnormalities such as the one in our study a possible description of the disease pathology may be more closely related to reversible inflammatory processes that result in axonal swelling and the ensuing increased restriction of extra-axonal water, than gross shear axonal injury. Such a disease mechanism would be consistent with the observed changes in kurtosis, a sensitive measure of diffusion compartment restriction.
While the proposed mechanism of injury is plausible and the microstructural diffusion changes have been observed in other studies, the dependence of the TBSS results on choice of clustering approach requires careful post-hoc region-of-interest (ROI) analysis to confirm the precise extent of white-matter involvement and avoid false positive (or false negative) results. This ROI-based analysis is ongoing.
Acknowledgements
No acknowledgement found.References
1. D. H. Poot, A. J. den Dekker, E. Achten, M. Verhoye und J. Sijbers, „Optimal experimental design for diffusion kurtosis imaging,“ IEEE Trans Med Imaging, 29(3), pp. 819-29, 2010.
2. J. Veraart, J. Sijbers, S. Sunaert, A. Leemans und B. Jeurissen, „Weighted linear least squares estimation of diffusion MRI parameters: strengths, limitations, and pitfalls,“ Neuroimage, 81, pp. 335-46, 2013.
3. S. M. Smith, M. Jenkinson, H. Johansen-Berg, D. Rueckert, T. E. Nichols, C. E. Mackay, K. E. Watkins, O. Ciccarelli, M. Z. Cader, P. M. Matthews, and T. E. J. Behrens, “Tract-based spatial statistics: Voxelwise analysis of multi-subject diffusion data,” NeuroImage, 31, pp. 1487-1505, 2006.
4. S. M. Smith, M. Jenkinson, M. W. Woolrich, C. F. Beckmann, T. E. J. Behrens, H. Johansen-Berg, P. R. Bannister, M. De Luca, I. Drobnjak, D. E. Flitney, R. Niazy, J. Saunders, J. Vickers, Y. Zhang, N. De Stefano, J. M. Brady, and P. M. Matthews, “Advances in functional and structural MR image analysis and implementation as FSL,” NeuroImage, 23(S1), pp 208-219, 2004.
5. E. L. Yuh, S. R. Cooper, P. Mukherjee, J. K. Yue, H. F. Lingsma, W. A. Gordon, A. B. Valadka, D. O. Okonkwo, D. M. Schnyer, M. J. Vassar, A. I. R. Maas and G. T. Manley, "Diffusion tensor imaging for outcome prediction in mild traumatic brain injury: a TRACK-TBI study," Journal of neurotrauma, 31, pp. 1457-77, Sep 2014.
6. M. A. Lancaster, D. V. Olson, M. A. McCrea, L. D. Nelson, A. A. LaRoche, L. T. Muftuler, “Acute white matter changes following sport-related concussion: A serial diffusion tensor and diffusion kurtosis tensor imaging study,” Hum Brain Mapp, 37(11), pp. 3821-3834, Nov 2016
Figures