0048
Connectivity Domain Analysis of Mild Traumatic Brain Injury: A Multi-center Study to Extract Robust Imaging Biomarkers1Department of Biomedical Engineering, Wayne State University, Detroit, MI, United States, 2Diagnostic Radiology and Nuclear Medicine, University of Maryland, 3Department of Psychiatry and Behavioral Neurosciences, Wayne State University, Detroit, MI, United States, 4Henry Ford Health System, 5Department of Radiology, Wayne State University
Synopsis
Identification of biomarkers for mild traumatic brain injury (mTBI) diagnosis and outcome prediction is challenging due to the heterogeneity of mTBI patients. Multi-center studies help to alleviate this, but functional MRI data can be difficult to combine across sites. Here, we applied our recent connectivity domain (CD) framework and
Purpose
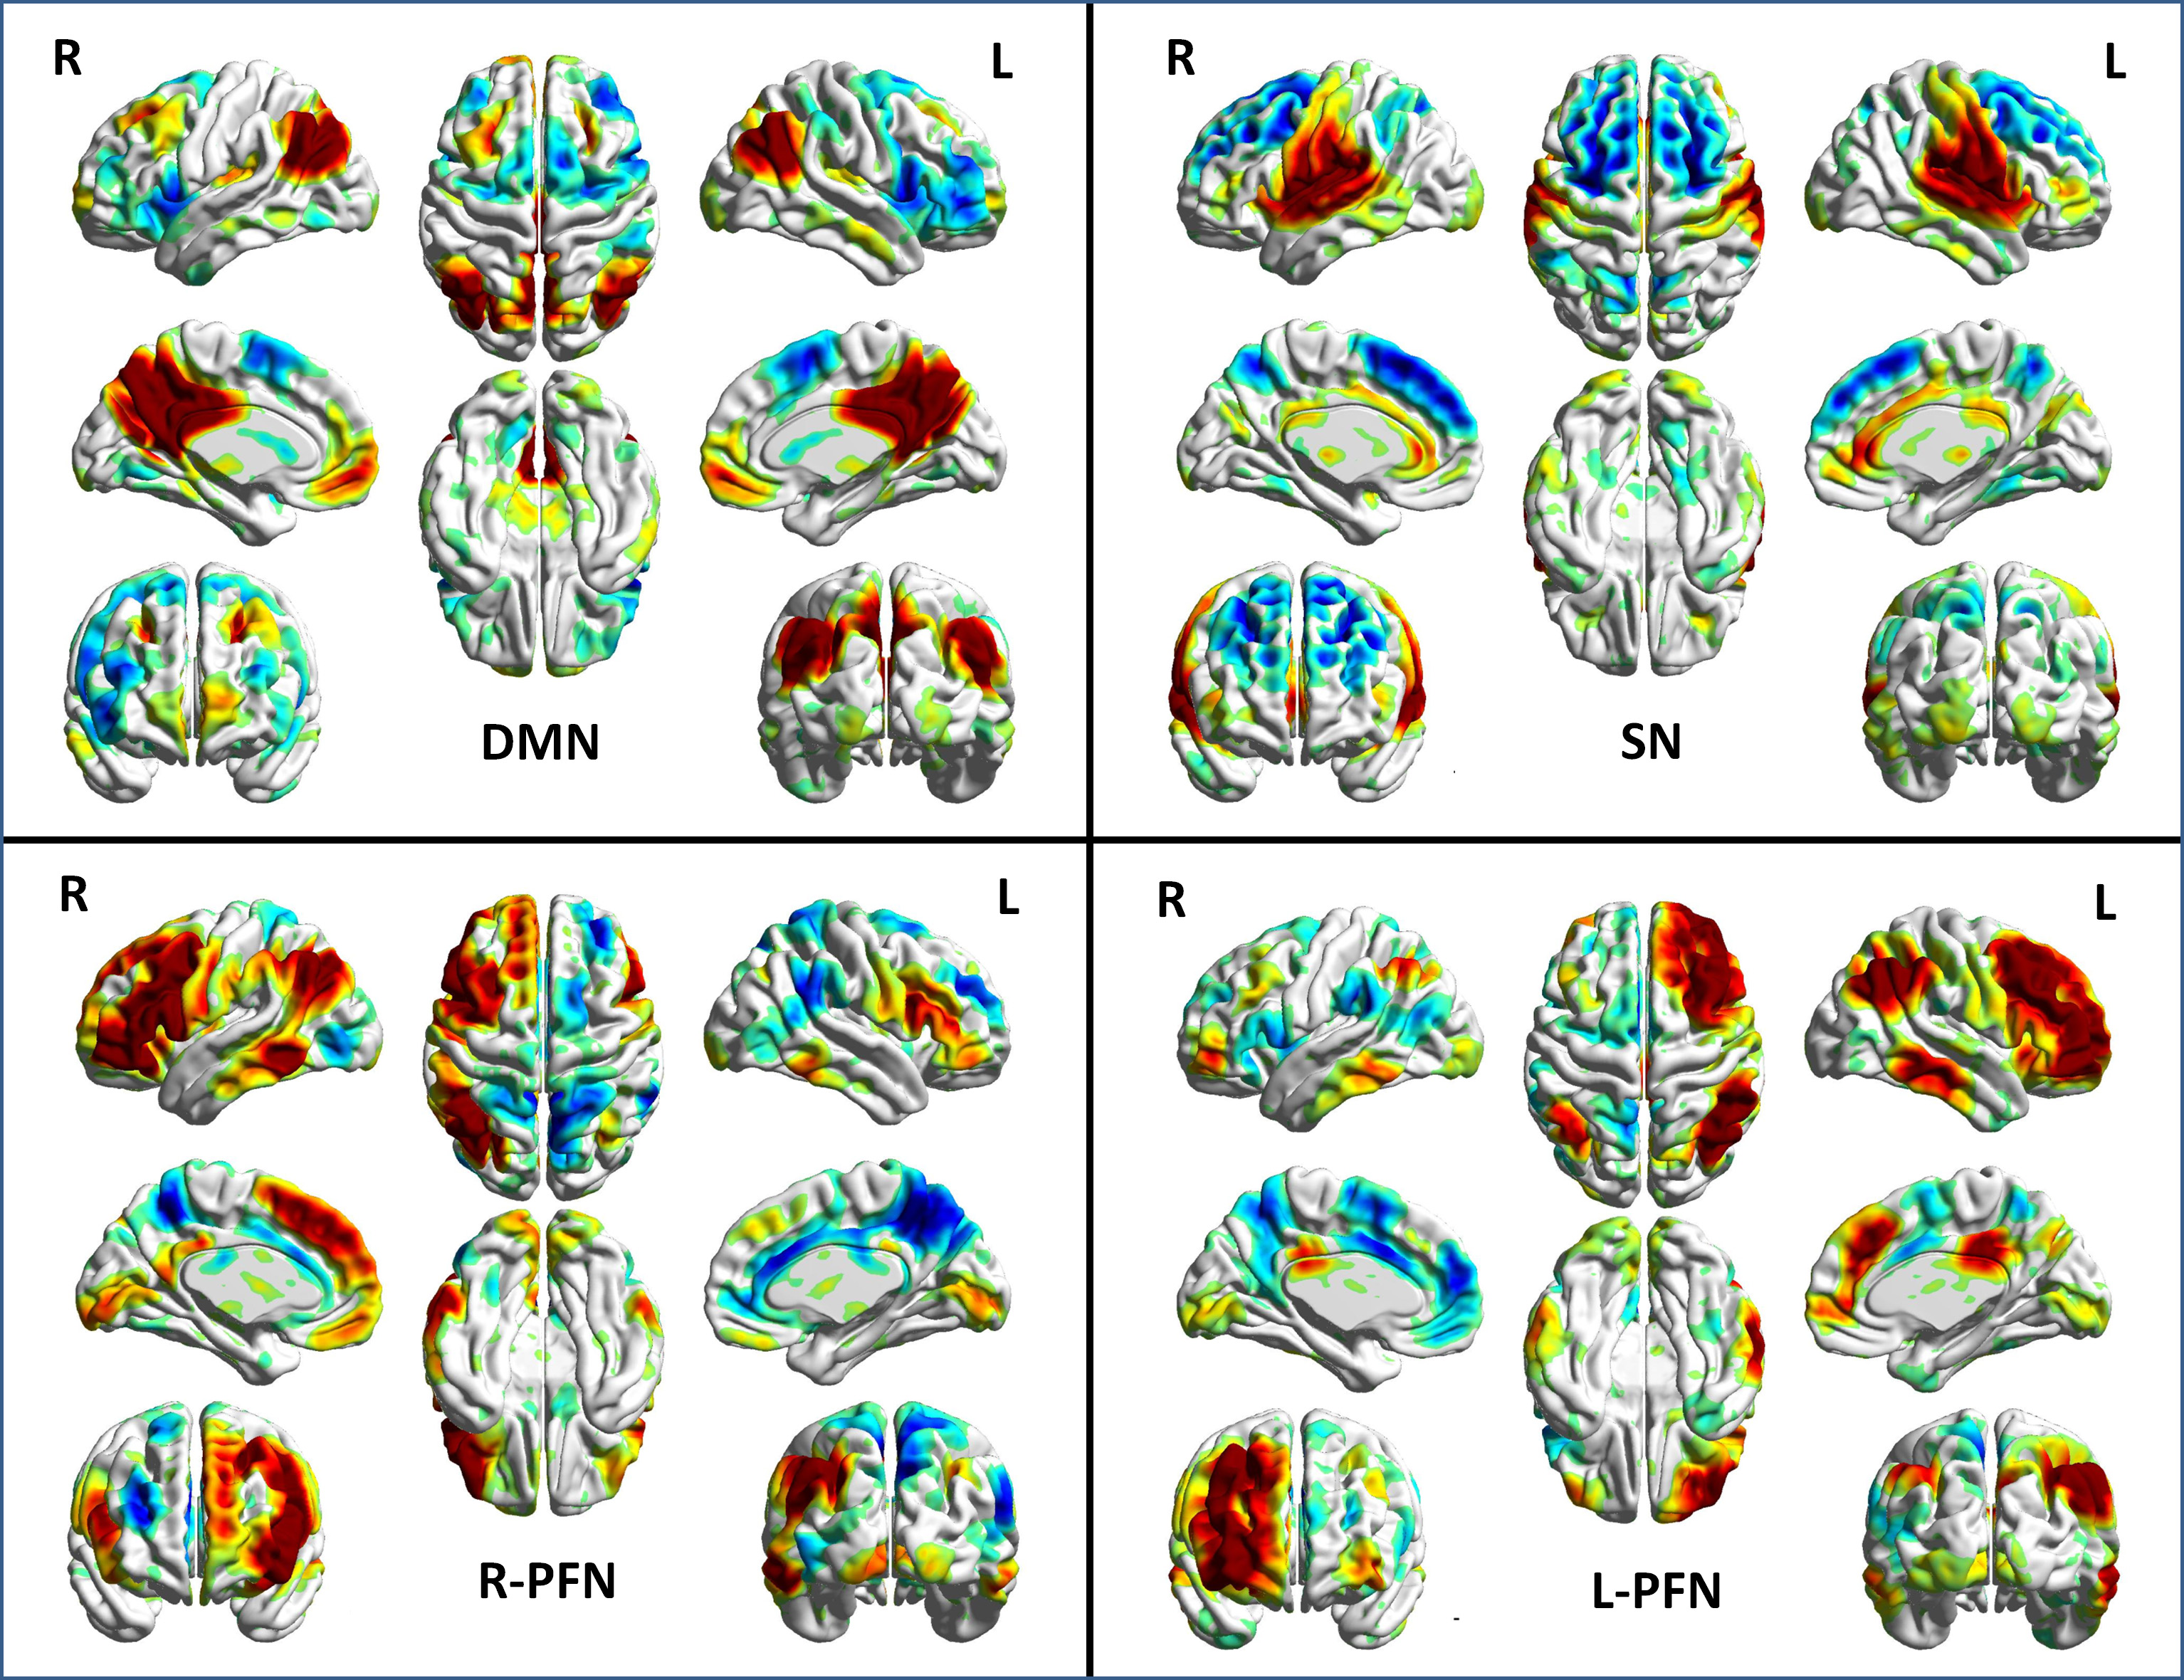
The primary goal of neuroimaging studies on mild traumatic brain injury (mTBI) is to identify sensitive and specific biomarkers to diagnose brain injury and identify disrupted brain connections.1 However, development of such biomarkers is challenging due to the multi-faceted complexity of mTBI. One potential solution to address this complexity is to perform cross-center studies to identify common predictive biomarkers. Here, we applied our recently developed approach, the connectivity domain, which could reduce cross-center heterogeneity to achieve this goal.2 We investigated the functional connectivity of four intrinsic connectivity networks (ICNs) including the default mode network (DMN), the salience network (SN), and the frontoparietal networks (FPNs), which are all expected to be disrupted after brain injury (Figure 1).Methods
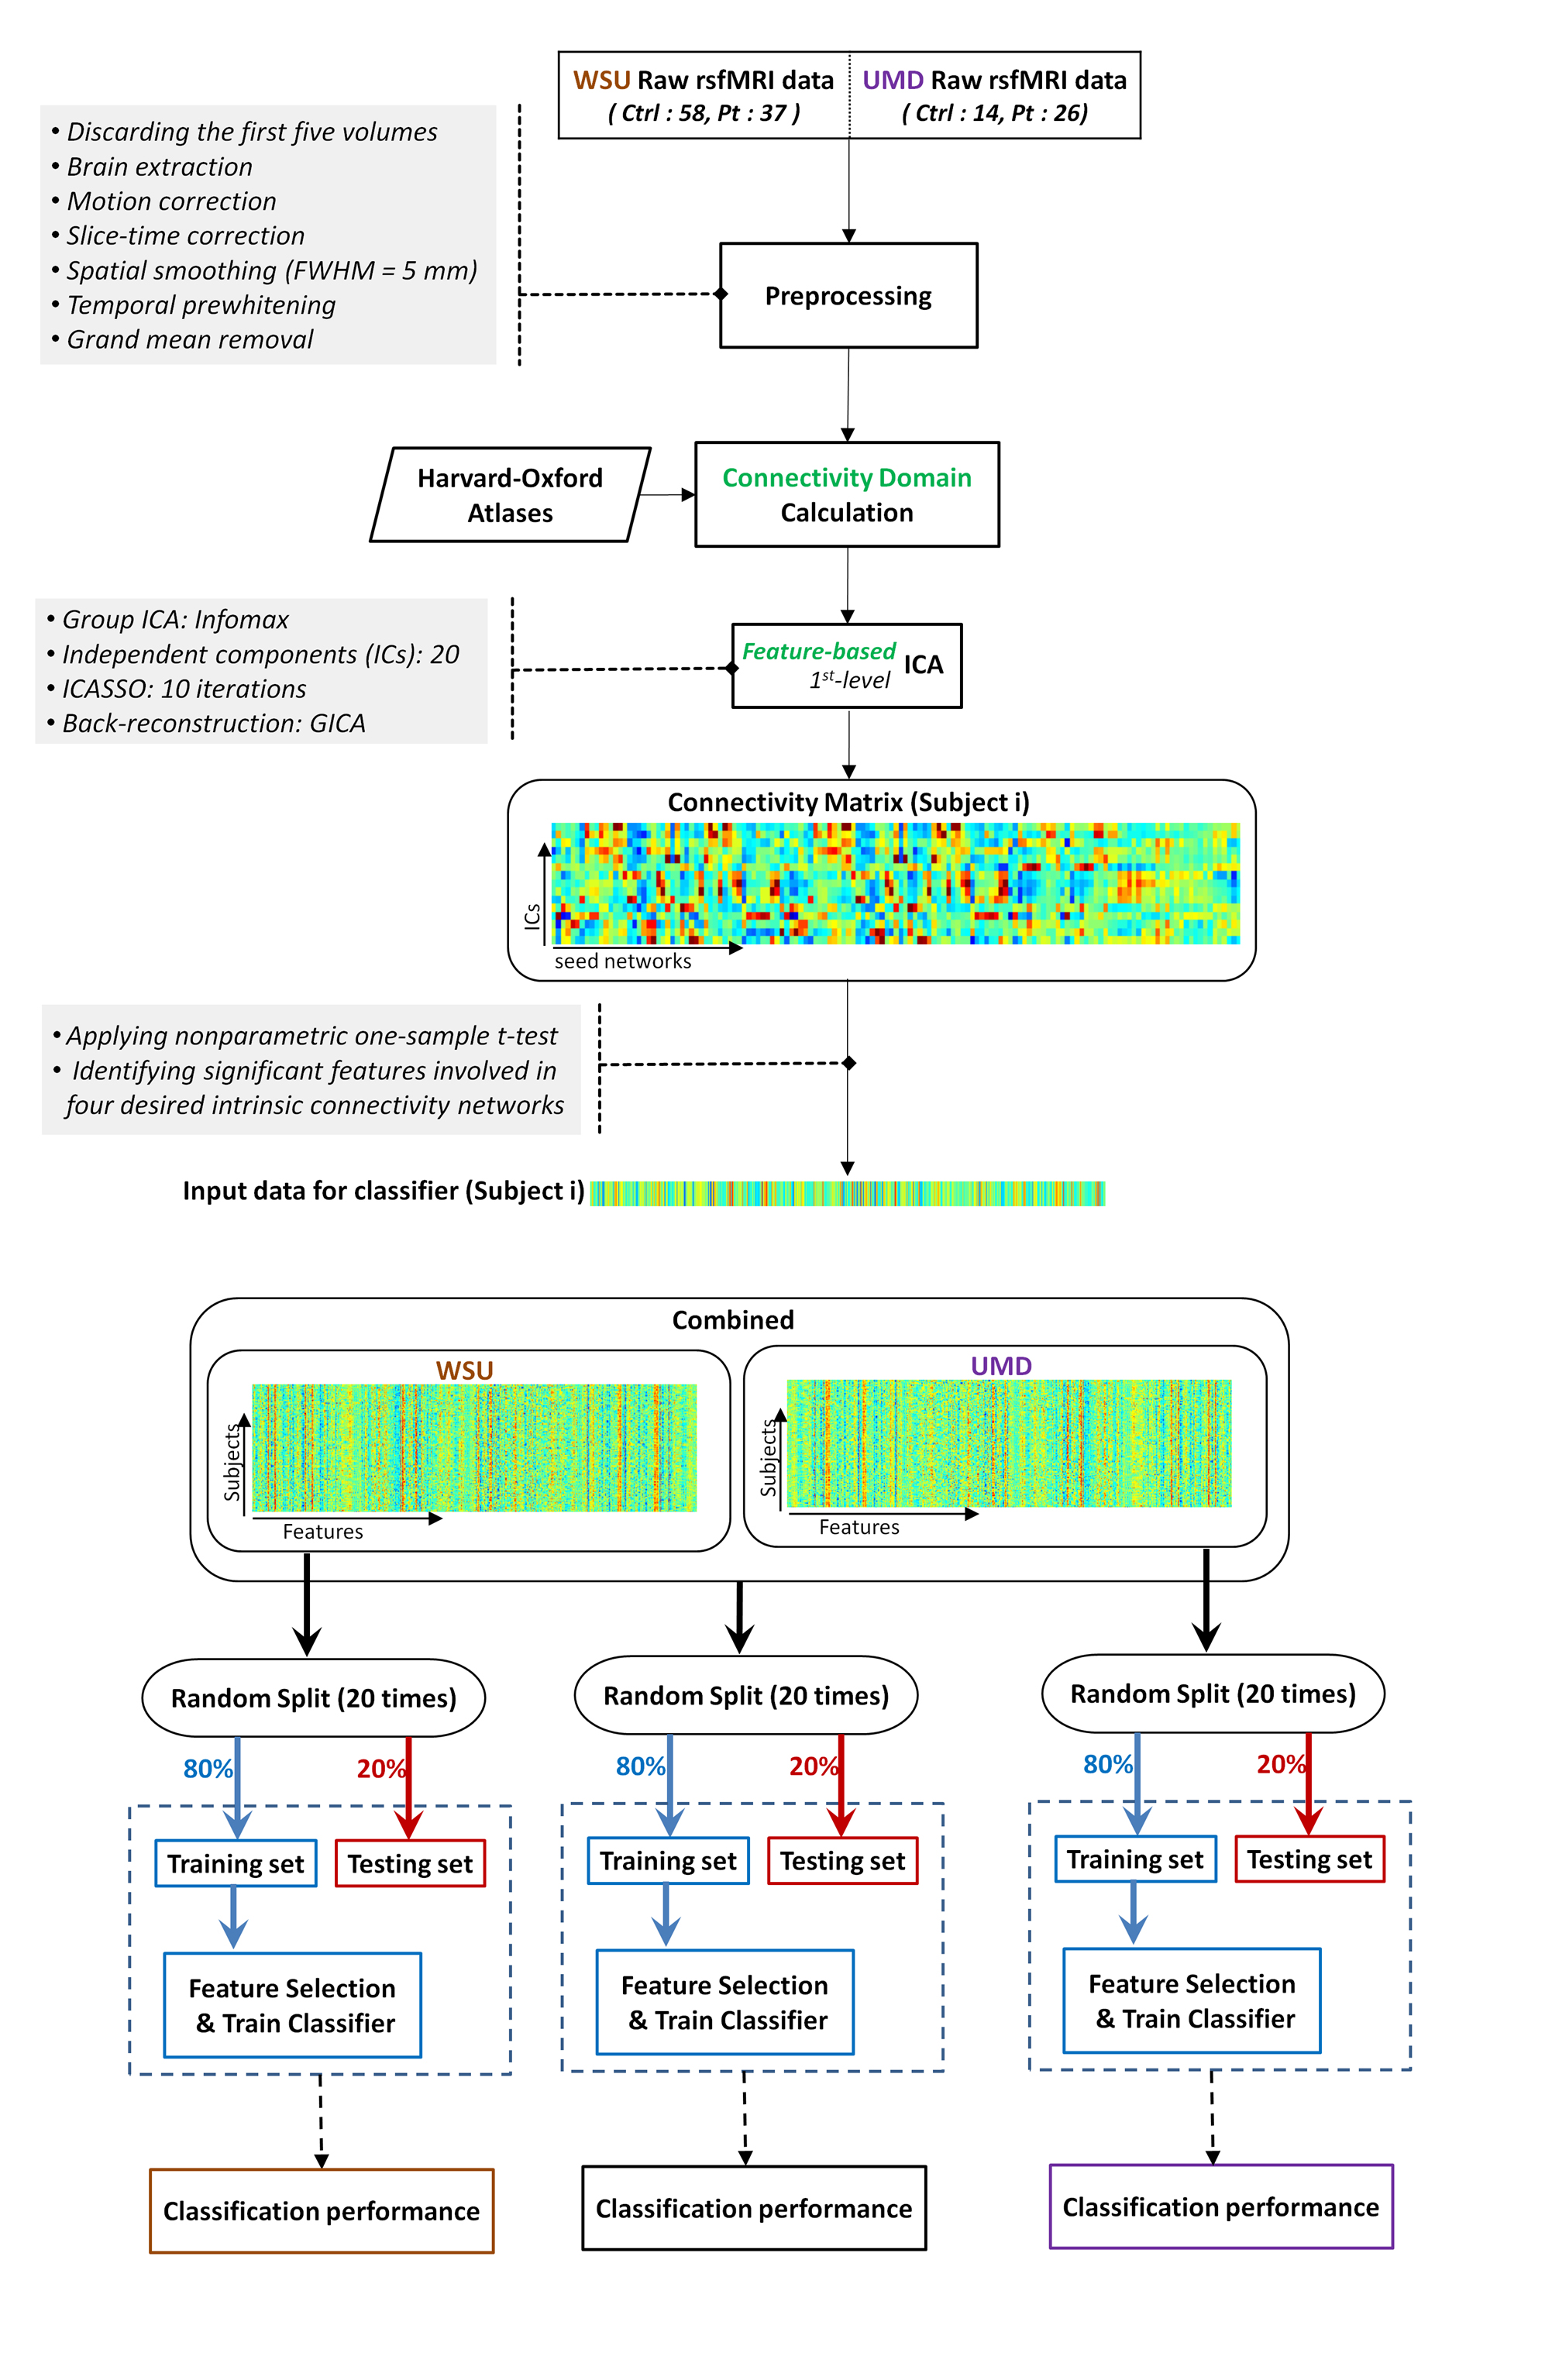
The datasets of two independent centers, Wayne State University (WSU) and University of Maryland School of Medicine (UMD), with a total of 75 healthy subjects and 63 mTBI patients, were used to extract the common most predictive biomarkers. The analysis pipeline for this study included (Figure 2):
1) Connectivity weights were calculated for “seed networks” obtained using structural information from the probabilistic Harvard-Oxford atlas to transform the data for connectivity domain analysis.
2) A first-level feature-based independent component analysis (ICA) was applied to obtain a connectivity matrix (CM) representing the interaction between seed networks and ICNs.
3) A nonparametric one-sample t-test was performed on elements of the CM to identify statistically significant elements, revealing seed networks which are functionally associated with the four ICNs of interest.
4) Single-center and combined-centers data were randomly split into training (80%) and testing (20%; not seen by algorithm) subsets for 20 iterations, and classification accuracy was measured.
5) mTBI heterogeneity was evaluated by a) assessing the features which were selected repeatedly among different subgroup analyses (iterations) within each center and in the combined data, and b) identifying features which were selected at both of the two independent centers.
6) The common features across all three single-center and combined-centers analyses were used to predict WSU patients' neuropsychological outcomes.
Results
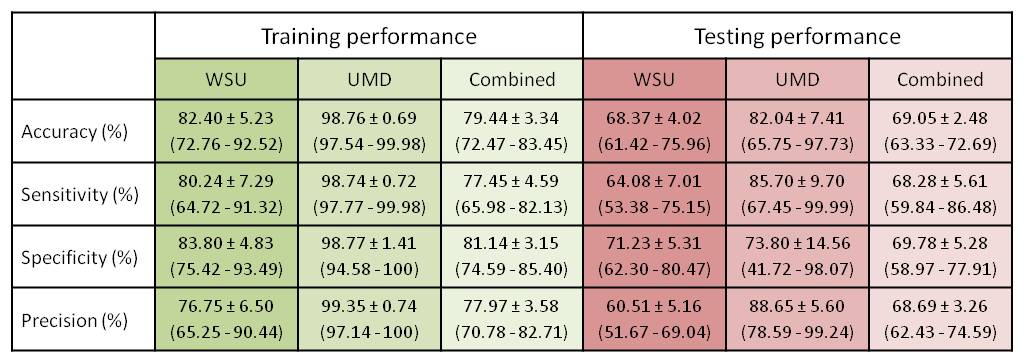
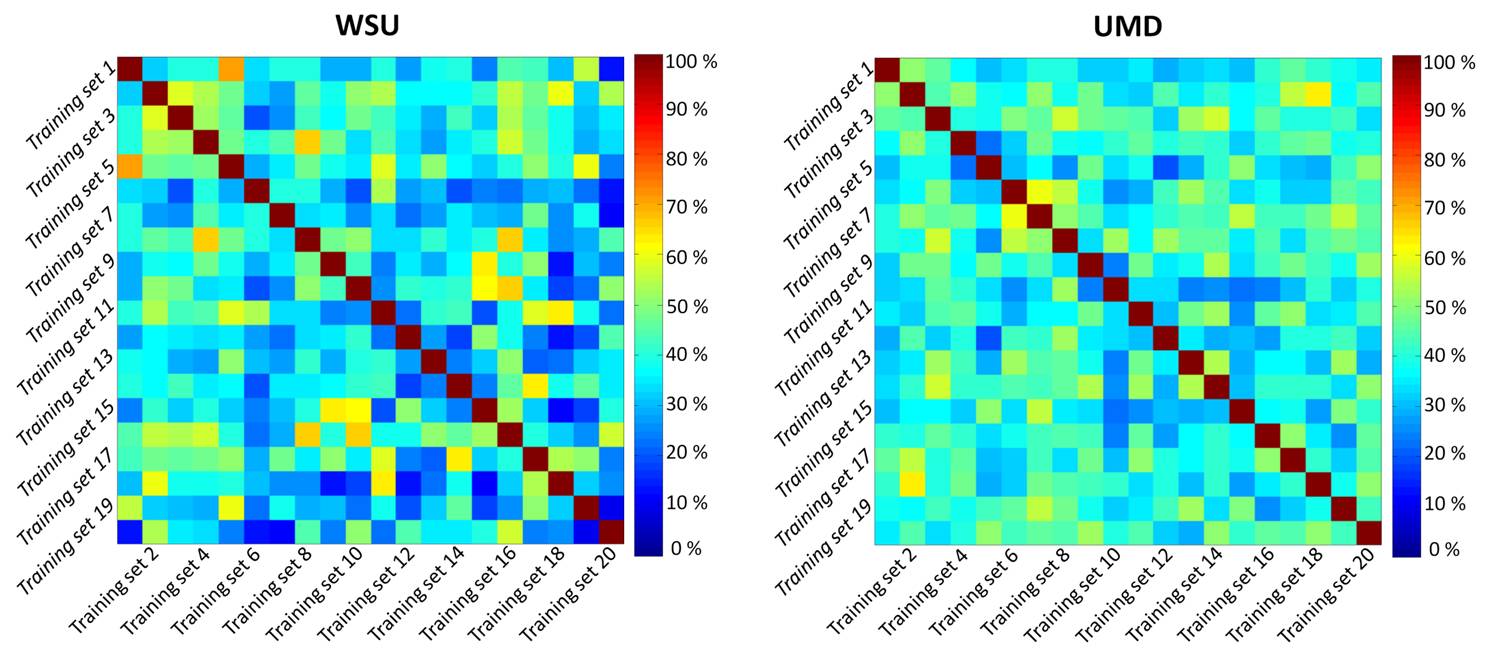
For WSU, UMD, and the combined dataset, the prediction accuracy for the 20% of data used to test the classification was 68.37 ± 4.02 %, 82.04 ± 7.41 %, and 69.05 ± 2.48 %, respectively (Table 1). Despite substantial accuracy in each situation, the selected features differ between centers. More importantly, the selected features notably differ between analyses run with different training subgroups within each center, which indicates a high level of heterogeneity across mTBI patients (Figure 3). Three features were observed in all three analyses: feature #35 (association between the posterior division of left parahippocampal gyrus and the DMN), feature #60 (interaction between the posterior division of right middle temporal gyrus and the DMN), and feature #88 (interaction between the right occipital fusiform gyrus and the DMN). Very interestingly, features #88 and #35 were also found to predict one-month neuropsychological outcomes (composite scores of attention and memory) using regression analysis in the WSU dataset. Neuropsychological data were not available from UMD, so this prediction could not be assessed in the UMD dataset.Discussion
This finding emphasizes the high level of heterogeneity in mTBI and the importance of white paper agreements on inclusion/exclusion criteria and data collection standards, careful patient screening and clinical assessments, more sensitive categorization protocols for severity of mTBI, injury mechanisms, and screening for time between injury and data collection. All of these could add an extra layer of heterogeneity to our data. However, it is encouraging that despite all this heterogeneity, combining two datasets did not reduce classification accuracy, indicating that multi-center analysis can be a promising approach for identification of predictive biomarkers. Even our small combination of two datasets helped us to identify features of connectivity that have significant correlation with patients' outcomes at one month after injury. Finally, combining data from multiple centers can also help to provide sufficient sample sizes to better allow subcategorization of patients to reduce heterogeneity.Conclusion
The CD analysis provided good accuracy of classification of mTBI patients despite high heterogeneity of predictors found across and within centers, while also maintaining good classification accuracy in a multi-center analysis. Further multi-center analyses may benefit from use of the CD for generation of classification and outcome prediction models in large numbers of subjects.Acknowledgements
WSU data collection was supported by DoD grant W81XWH-11-1-0493 (PI: EMH), and data analysis was supported by an International Society for Magnetic Resonance in Medicine Seed Grant (PI: ZK), NIH R21 grant NS090153 (PI: ZK), and NIH F30 grant HD084144 (PI: NMW).References
1. Iraji A, Benson RR, Welch RD, et al. Resting State Functional Connectivity in Mild Traumatic Brain Injury at the Acute Stage: Independent Component and Seed-Based Analyses. J Neurotrauma 2015;32(14):1031-1045.
2. Iraji A, Calhoun VD, Wiseman NM, et al. The connectivity domain: Analyzing resting state fMRI data using feature-based data-driven and model-based methods. NeuroImage 2016;134:494-507.
Figures