0047
Disrupted topological brain organizations in large-scale cortical networks between impaired and nonimpaired active fighters1Cleveland Clinic Lou Ruvo Center for Brain Health, Las Vegas, NV, United States
Synopsis
Several MRI studies have shown structural differences in athletes with repetitive head trauma. However, whether coordinated variation exists in brain morphology of cognitively impaired-fighters is still unknown. Using graph-theoretical methods on
Introduction
Studies have shown that both active and retired athletes with repeated head trauma are more likely to suffer from cognitive decline and loss of executive and attention functions when compared to age-matched healthy controls1,2. Several cross-sectional MRI studies have shown structural differences in such athletes3,4 but there has been no research on whether any coordinated variation exists in brain morphology of cognitively impaired-fighters. The professional fighters brain health study (PFBHS)5 is a longitudinal study of active professional fighters. In this study, we show that the cognitively impaired-fighters exhibit alteration in the coordination of the large-scale structural brain networks.Methods
Subjects: 111 boxers (11 females; 29.68±7.23years) and 147 mixed martial arts fighters (8 females; 29.07±4.47years) participating in the PFBHS were included in this study. Years of education (YOE), number of professional and amateur fights, race, and gender were recorded at the first visit for every subject. Each subject went through various neuropsychological assessment tests6 to measure psychomotor speed (PSY) and processing (P) speed. These scores were standardized7 (PSYSTANS/PSTANS) and the fighters were categorized as “impaired” (79-subjects) or “nonimpaired” (179-subjects). Data Acquisition: All subjects were scanned at our center with a 3T Siemens Verio scanner with a 32 channel head coil. Sagittal-MPRAGE T1-weighted images were also acquired for every subject within the same session with TR/TE/FA/Resolution= 2300ms/2.98ms/9o/1mm. Network construction: Cortical thickness from 34 regions in Collin’s atlas in each hemisphere were extracted for every subject using Freesurfer v5.3.08. Interregional correlation matrix of each group was computed by calculating partial correlations between the cortical thicknesses of every pair of regions across individuals9. A linear regression analysis was performed to remove the effect of the confounding factors (age, gender, YOE, and race) and the residuals were used in the following analysis. Graph-theoretical properties: Various Graph-theoretical properties such as global efficiency (GE), local efficiency (LE), clustering coefficient (Cp), betweenness-centrality (bc), and modularity were computed for each group using GRETNA10. The graph-theoretical properties were evaluated at various sparsity thresholds (5%-40%, step=1%). At each sparsity threshold, all the entries of the correlation matrix were binarized and the computation was done on this binary matrix. Statistical analysis: Vertex-wise analysis was conducted in FreeSurfer with permutation testing to test for any group differences in cortical thickness between groups after controlling for confounds. In order to test the differences in the interregional cortical thickness between the fighters group, every internode correlation value was converted to z-score and a Z-statistic was performed to compare the transformed z-values with false discovery rate correction at p<0.059. Nonparametric permutation testing was applied to compare the various Graph-theoretical properties9.Results
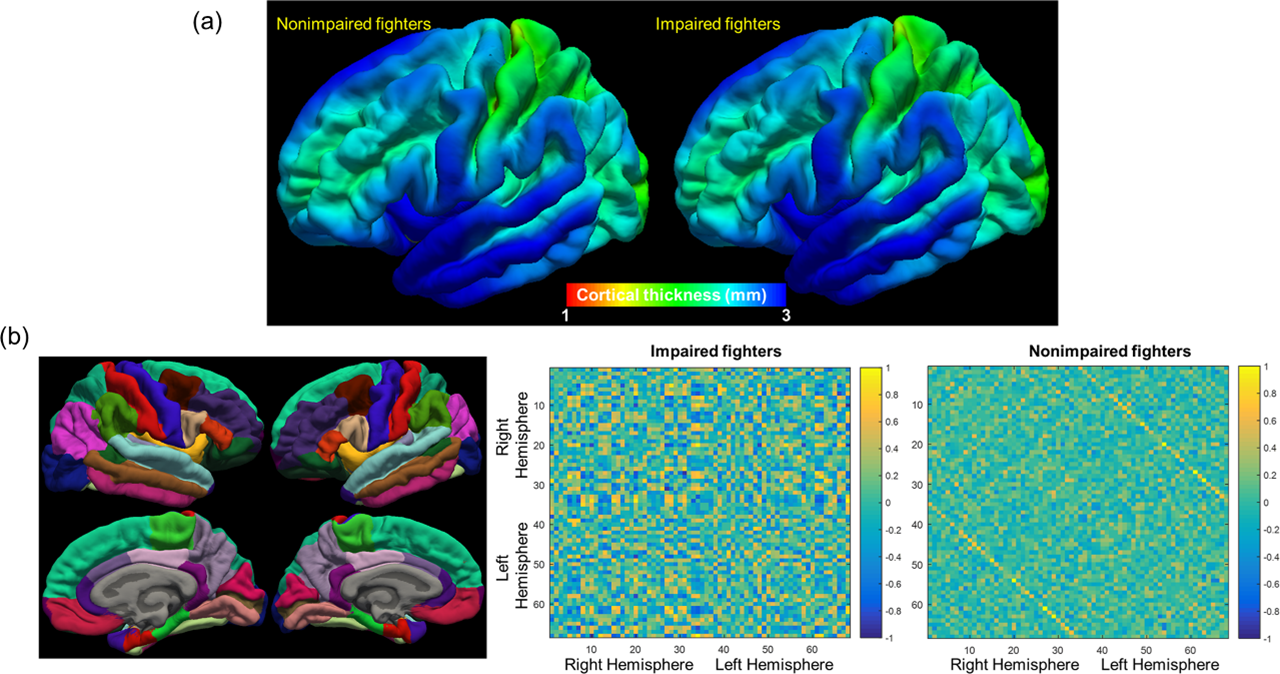
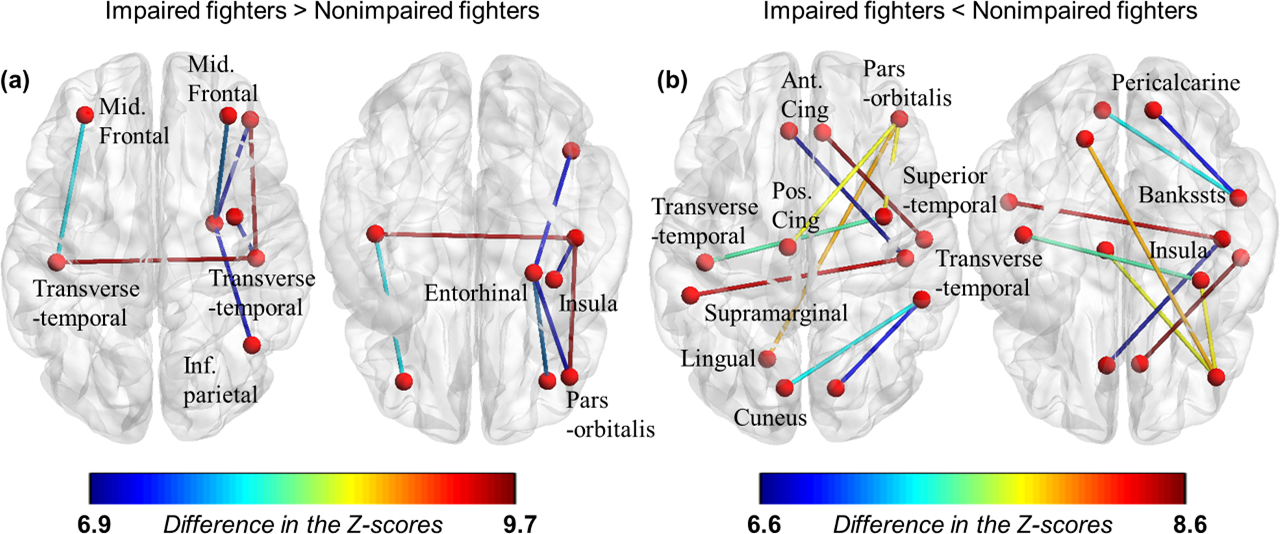
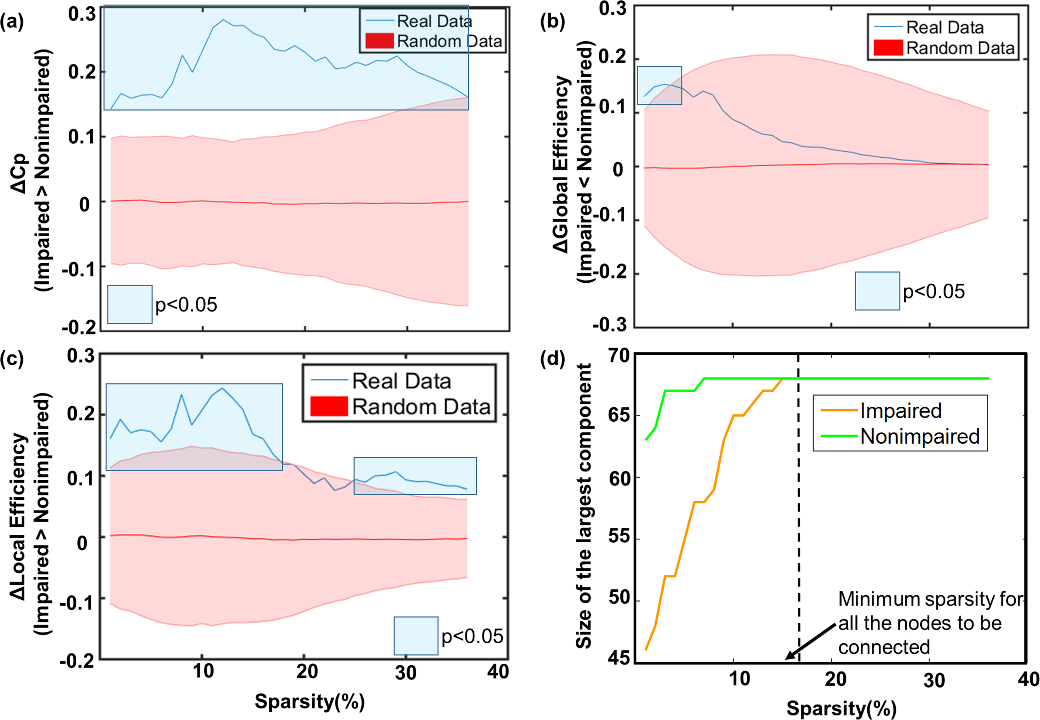
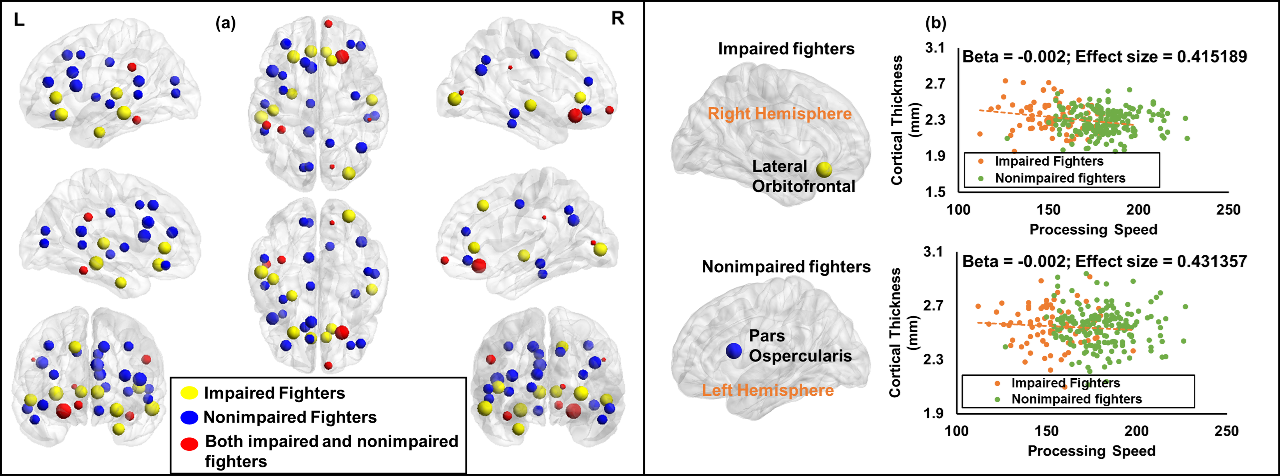
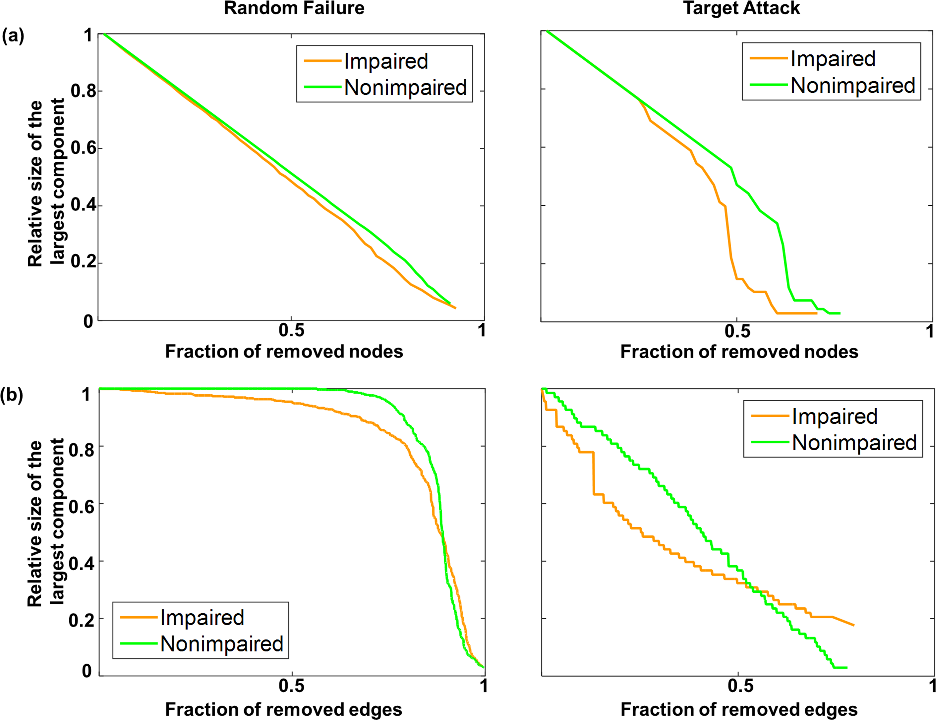
Fig.1 (a) shows the averaged correlation thickness for both groups. Vertex-wise analysis revealed no region with significant differences in cortical thickness between groups. Regions from Colin’s atlas used to build the connectivity matrix are shown in the left-panel of Fig.1 (b). The regions with the same name are coded with the same color between the hemispheres. Partial correlation matrix for both groups is also shown (Fig.1(c), right-panel). As can be observed, there is a marked difference in the correlation between the two groups. Correlation between certain regions of default mode network (DMN) was shown to have lower correlation in impaired-fighters (Fig.2 (b)). Impaired-fighters had significantly higher Cp across all sparsity thresholds and significantly higher LE when either the network was too sparse or too dense as compared to nonimpaired-fighters (Fig.3 (a) and (c)). GE was found to be significantly greater in nonimpaired-fighters when the network was very sparse (Fig.3 (b)). Minimum sparsity at which the entire network was fully connected was determined to be 19% (Fig.3 (d)). The topological organization of the hubs was significantly different between the two groups with only six regions sharing the hubs (Fig.4 (a)). Cortical thickness in the most-important hubs (as determined by the betweenness-centrality) of impaired and nonimpaired-fighters was found to be negatively associated with processing speed in impaired-fighters (Fig.4 (b)). The resilient analysis revealed that nonimpaired-fighters were more resilient to targeted attacks of nodes and edges (Fig.5).Discussion
This study shows that repeated head trauma is associated with altered coordination of large-scale structural brain networks, especially in the long-range connections involving DMN. Furthermore, the cortical thickness of regions identified as hubs showed a negative association with processing speed in impaired-fighters. Future studies will evaluate if any of the network properties could predict cognitive impairment in active professional fighters.Conclusion
Graph-theoretical study of active professional fighters revealed disrupted topological organization in cognitively impaired-fighters, which can be exploited in understanding effect of repetitive head trauma on brain reorganization.Acknowledgements
This work was supported by COBRE 1P20GM109025 and grants from Lincy foundation.We would like to extend our sincere thanks to all the participants of the study, various research coordinators and MRI technologists without which the study would not have been completed. We would also like to thank Dr. Mark Lowe and Dr. Wanyong Shin from Cleveland Clinic for their assistance in setting up the MRI protocols at our center.References
1. McKee AC, Stern RA, Nowinski CJ, et al. The spectrum of disease in chronic traumatic encephalopathy. Brain 2013; 136: 43–64.
2. IR C, Siegel O, Sham R, EA C, Tarlau M, DiDomenico A. Brain damage in modern boxers. JAMA 1984; 251: 2663–7.
3. Shin W, Mahmoud SY, Sakaie K, et al. Diffusion Measures Indicate Fight Exposure-Related Damage to Cerebral White Matter in Boxers and Mixed Martial Arts Fighters. Am J Neuroradiol 2014; 35: 285–90.
4. Bernick C, Banks S. What boxing tells us about repetitive head trauma and the brain. Alzheimers Res Ther 2013; 5: 23.
5. Bernick C, Banks S, Phillips M, et al. Professional fighters brain health study: Rationale and methods. Am J Epidemiol 2013; 178: 280–6.
6. Gualtieri CT, Johnson LG. Reliability and validity of a computerized neurocognitive test battery, CNS Vital Signs. Arch Clin Neuropsychol 2006; 21: 623–43.
7. Schinka JA, Loewenstein DA, Raj A, et al. Defining mild cognitive impairment: impact of varying decision criteria on neuropsychological diagnostic frequencies and correlates. Am. J. Geriatr. Psychiatry. 2010; 18: 684–91.
8. Fischl B, Salat D ~H., Busa E, et al. Whole brain segmentation: automated labeling of neuroanatomical structures in the human brain. Neuron 2002; 33: 341–55.
9. He Y, Chen Z, Evans A. Structural insights into aberrant topological patterns of large-scale cortical networks in Alzheimer’s disease. J Neurosci 2008; 28: 4756–66.
10. Wang J, Wang X, Xia M, Liao X, Evans A, He Y. GRETNA: a Graph-theoretical network analysis toolbox for imaging connectomics. Front Hum Neurosci 2015; 9: 386.
Figures