0044
Myocardial T2* Changes Periodically across the Cardiac Cycle and is Prolonged in Hypertrophic Cardiomyopathy: A 7.0 Tesla MRI Patient Study1Berlin Ultrahigh Field Facility (B.U.F.F.), Max Delbrück Center for Molecular Medicine in the Helmholtz Association(MDC), Berlin, Germany, 2Institute for Physiology, Charité University Medicine, Berlin, Germany, 3Working Group on Cardiovascular Magnetic Resonance, Experimental and Clinical Research Center, a joint cooperation between the Charité Medical Faculty and the Max Delbrück Center for Molecular Medicine in the Helmholtz Association, Berlin, Germany, 4Experimental and Clinical Research Center, a joint cooperation between the, Charité Medical Faculty and the Max Delbrück Center for Molecular Medicine in the Helmholtz Association, Berlin, Germany, 5DZHK (German Centre for Cardiovascular Research), partner site Berlin, Berlin, Germany
Synopsis
Ultrahigh field MR (UHF-MR) enables temporally resolved myocardial T2* mapping which benefits probing the myocardium at different physiological states. Myocardial BOLD contrast or T2* are commonly regarded as surrogates for myocardial tissue oxygenation, but the factors influencing T2* are manifold including cardiac macromorphology. Meaningful interpretation of myocardial T2* could be beneficial for understanding cardiac (patho)physiology in vivo, but requires careful identification of influential factors and their contributions to T2*. To this end, this study examines the relationship between myocardial T2* and myocardial wall thickness and investigates it’s capability to distinguish between healthy myocardium and myocardium affected by hypertrophic cardiomyopathy (HCM).
Purpose
Mapping of the effective transverse MR relaxation time T2* is an emerging (pre)clinical application in myocardial tissue characterization [1, 2]. While myocardial T2* mapping is usually limited to single phase end-diastolic acquisitions, ultrahigh field MR enables temporally resolved myocardial T2* mapping [3]. Additionally, the increase of susceptibility effects with higher magnetic fields enhances T2* sensitivity, which renders it conceptually appealing to perform T2* mapping at ultrahigh fields. Dynamic mapping of myocardial T2* allows probing the myocardium in different physiological states and holds the promise to facilitate distinction of healthy and pathologic tissue. Myocardial BOLD contrast or T2* are commonly regarded as surrogates for myocardial tissue oxygenation [2], but the factors influencing T2* are manifold [4]. Meaningful interpretation of myocardial T2* requires careful identification of influential factors and their contributions to T2*. To this end, this study examines the relationship between myocardial T2* and cardiac macromorphology including myocardial wall thickness and left ventricular inner radius. We demonstrate that the myocardial T2* to myocardial wall thickness relationship provides a biomarker for differentiation between healthy myocardium and myocardium affected by hypertrophic cardiomyopathy (HCM).Methods
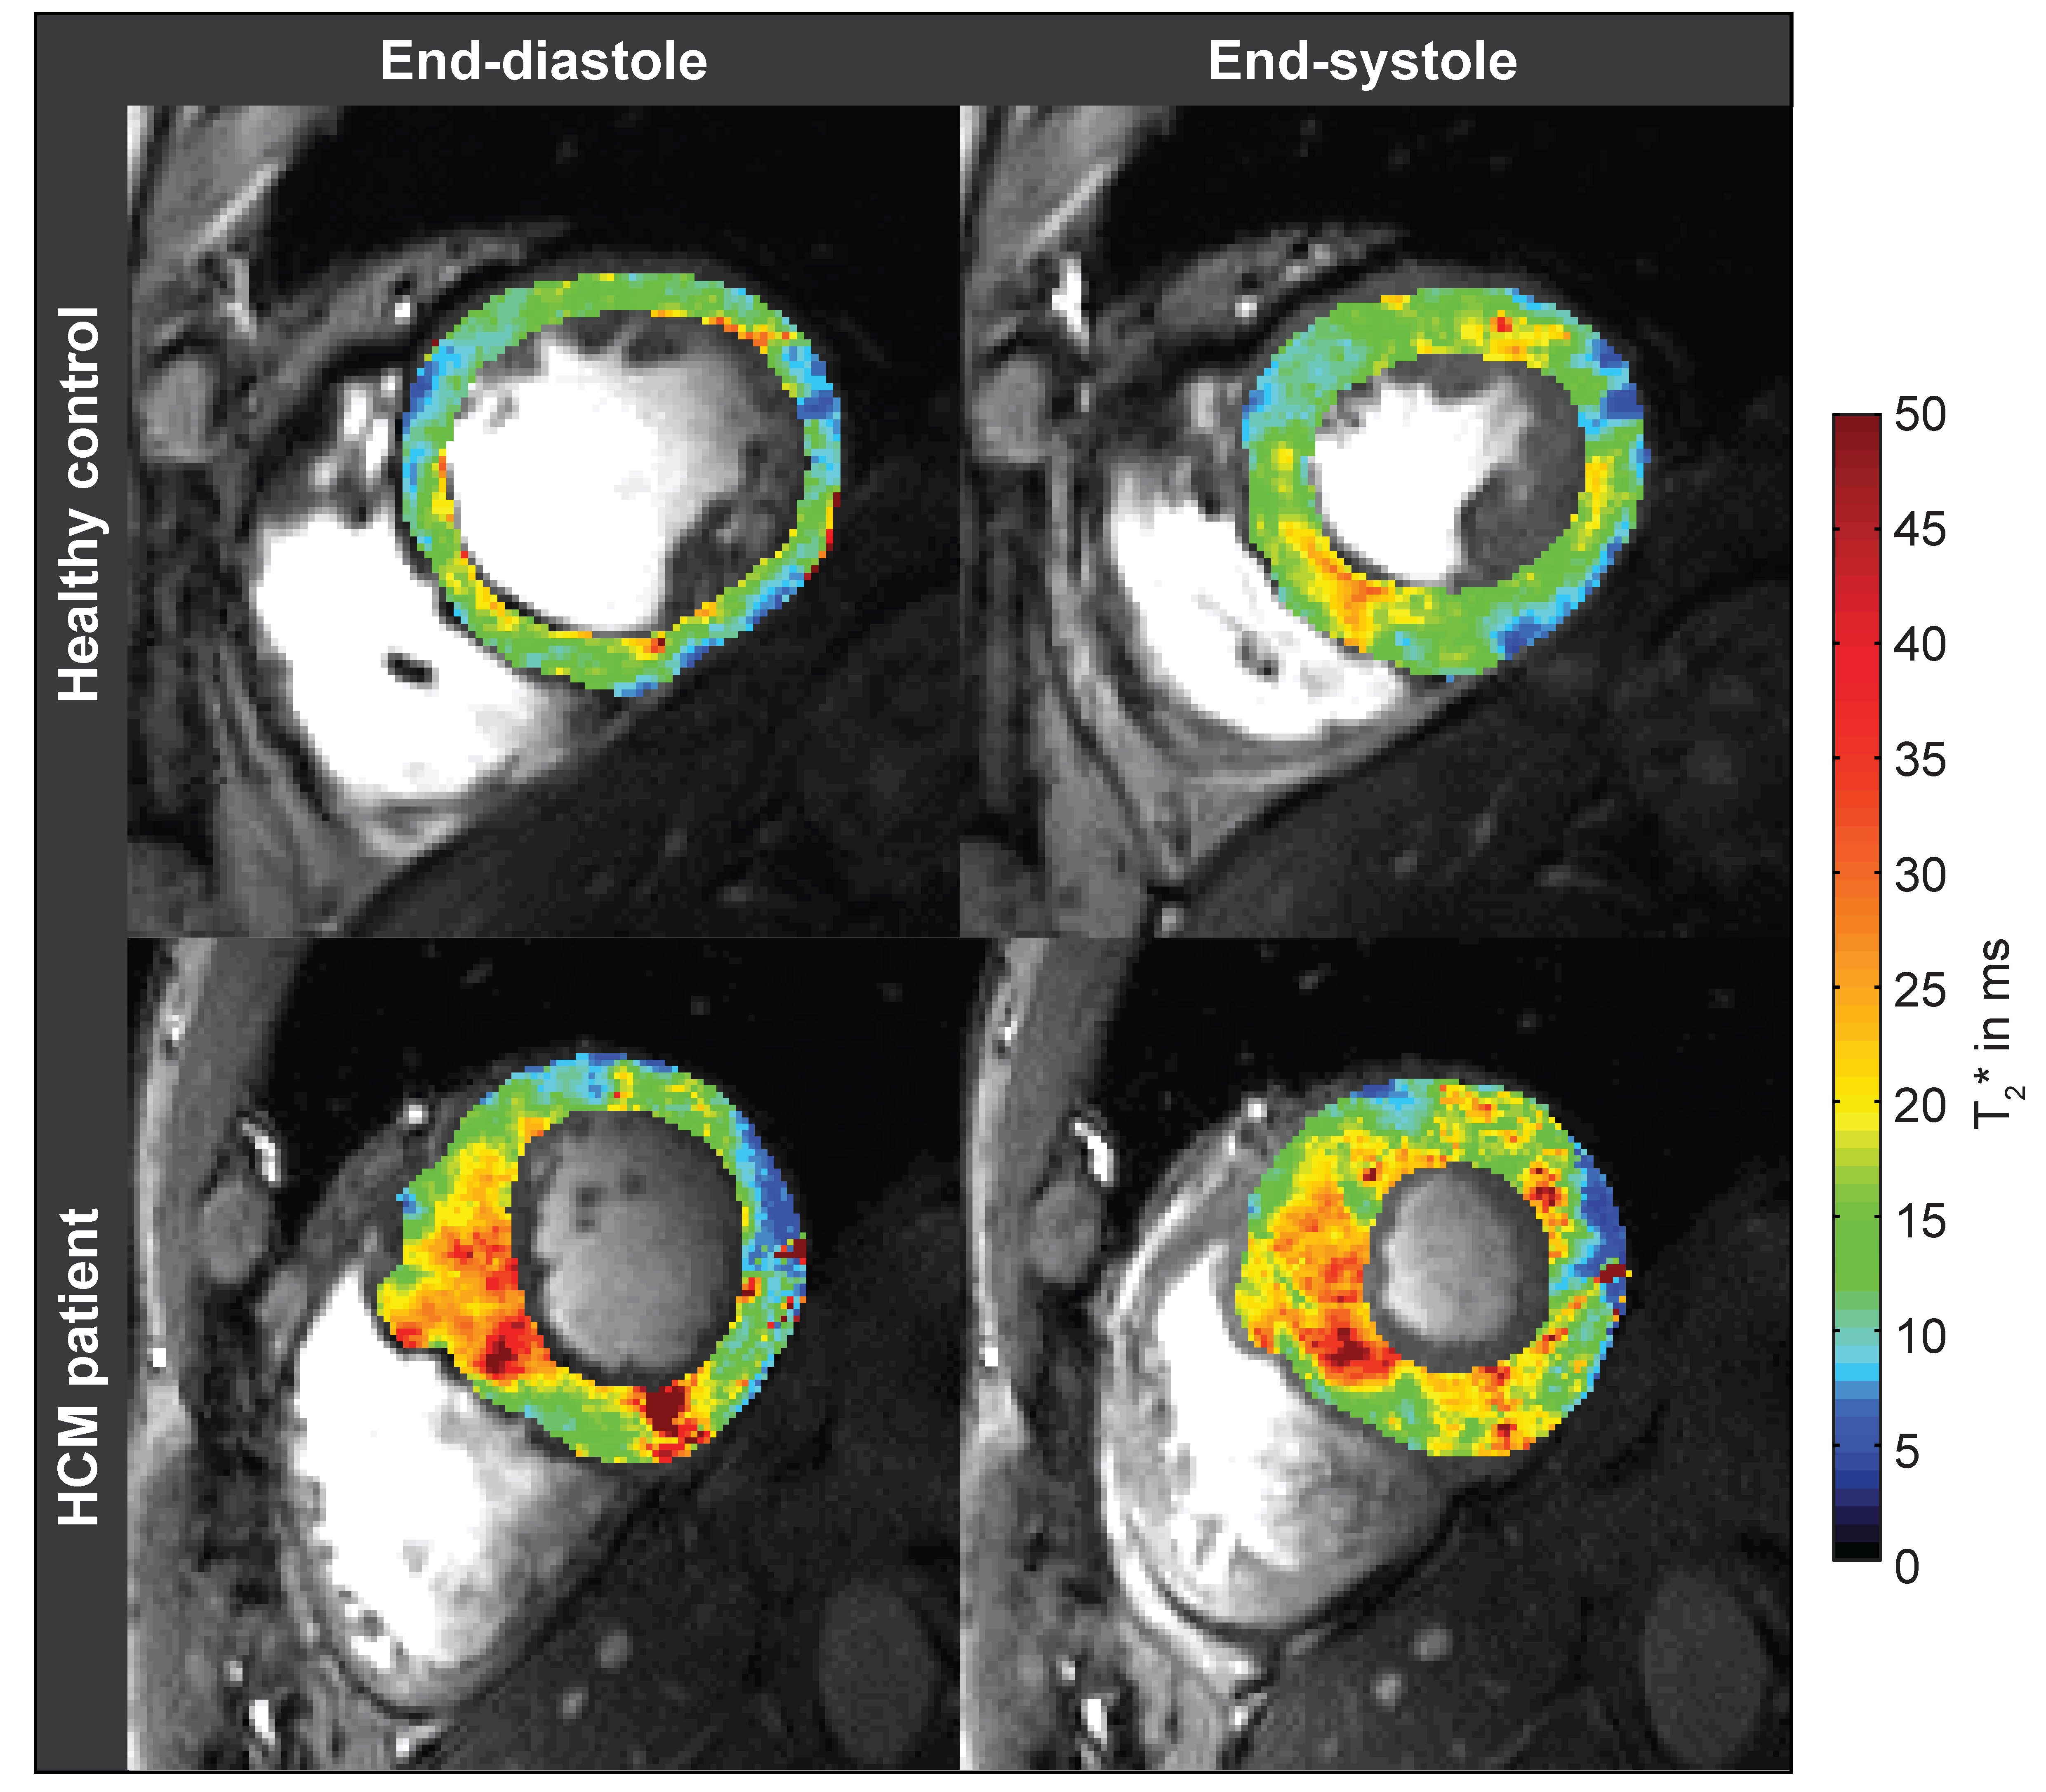
Six healthy volunteers (4 male,age=50.0±12.4, BMI=23.9±2.9kg/m2) and six patients with confirmed HCM (4 male,age=52.7±17.5, BMI=25.2±1.9 kg/m2) were examined using a 7.0T whole body MR system (Siemens Healthcare,Erlangen,Germany) equipped with a 16 channel RF-transceiver array [5]. For CINE T2* mapping a cardiac triggered interleaved multi-echo gradient-echo technique was employed [3] (TE=(2.04-10.20)ms, spatial resolution=(1.1x1.1x4.0)mm3) (Fig.1). T2* mapping was conducted using a mono-exponential signal decay model. Prior to T2* fitting, images were de-noised [6] and co-registered. The left ventricular myocardium was manually segmented for each cardiac phase and septal wall thickness (SWT), left ventricular inner radius and septal T2* were analyzed. As reference for tissue alterations, late Gadolinium enhancement (LGE) imaging was performed using a 3.0T MR scanner (Verio,Siemens Healthcare,Erlangen,Germany), 10 to 15 minutes after application of gadobutrol (0.2mmol/kg body weight) using an inversion recovery gradient echo technique (TR=10.5ms,TE=5.4ms,FA=30°, spatial resolution=(1.4x1.6x6.0)mm3).Results
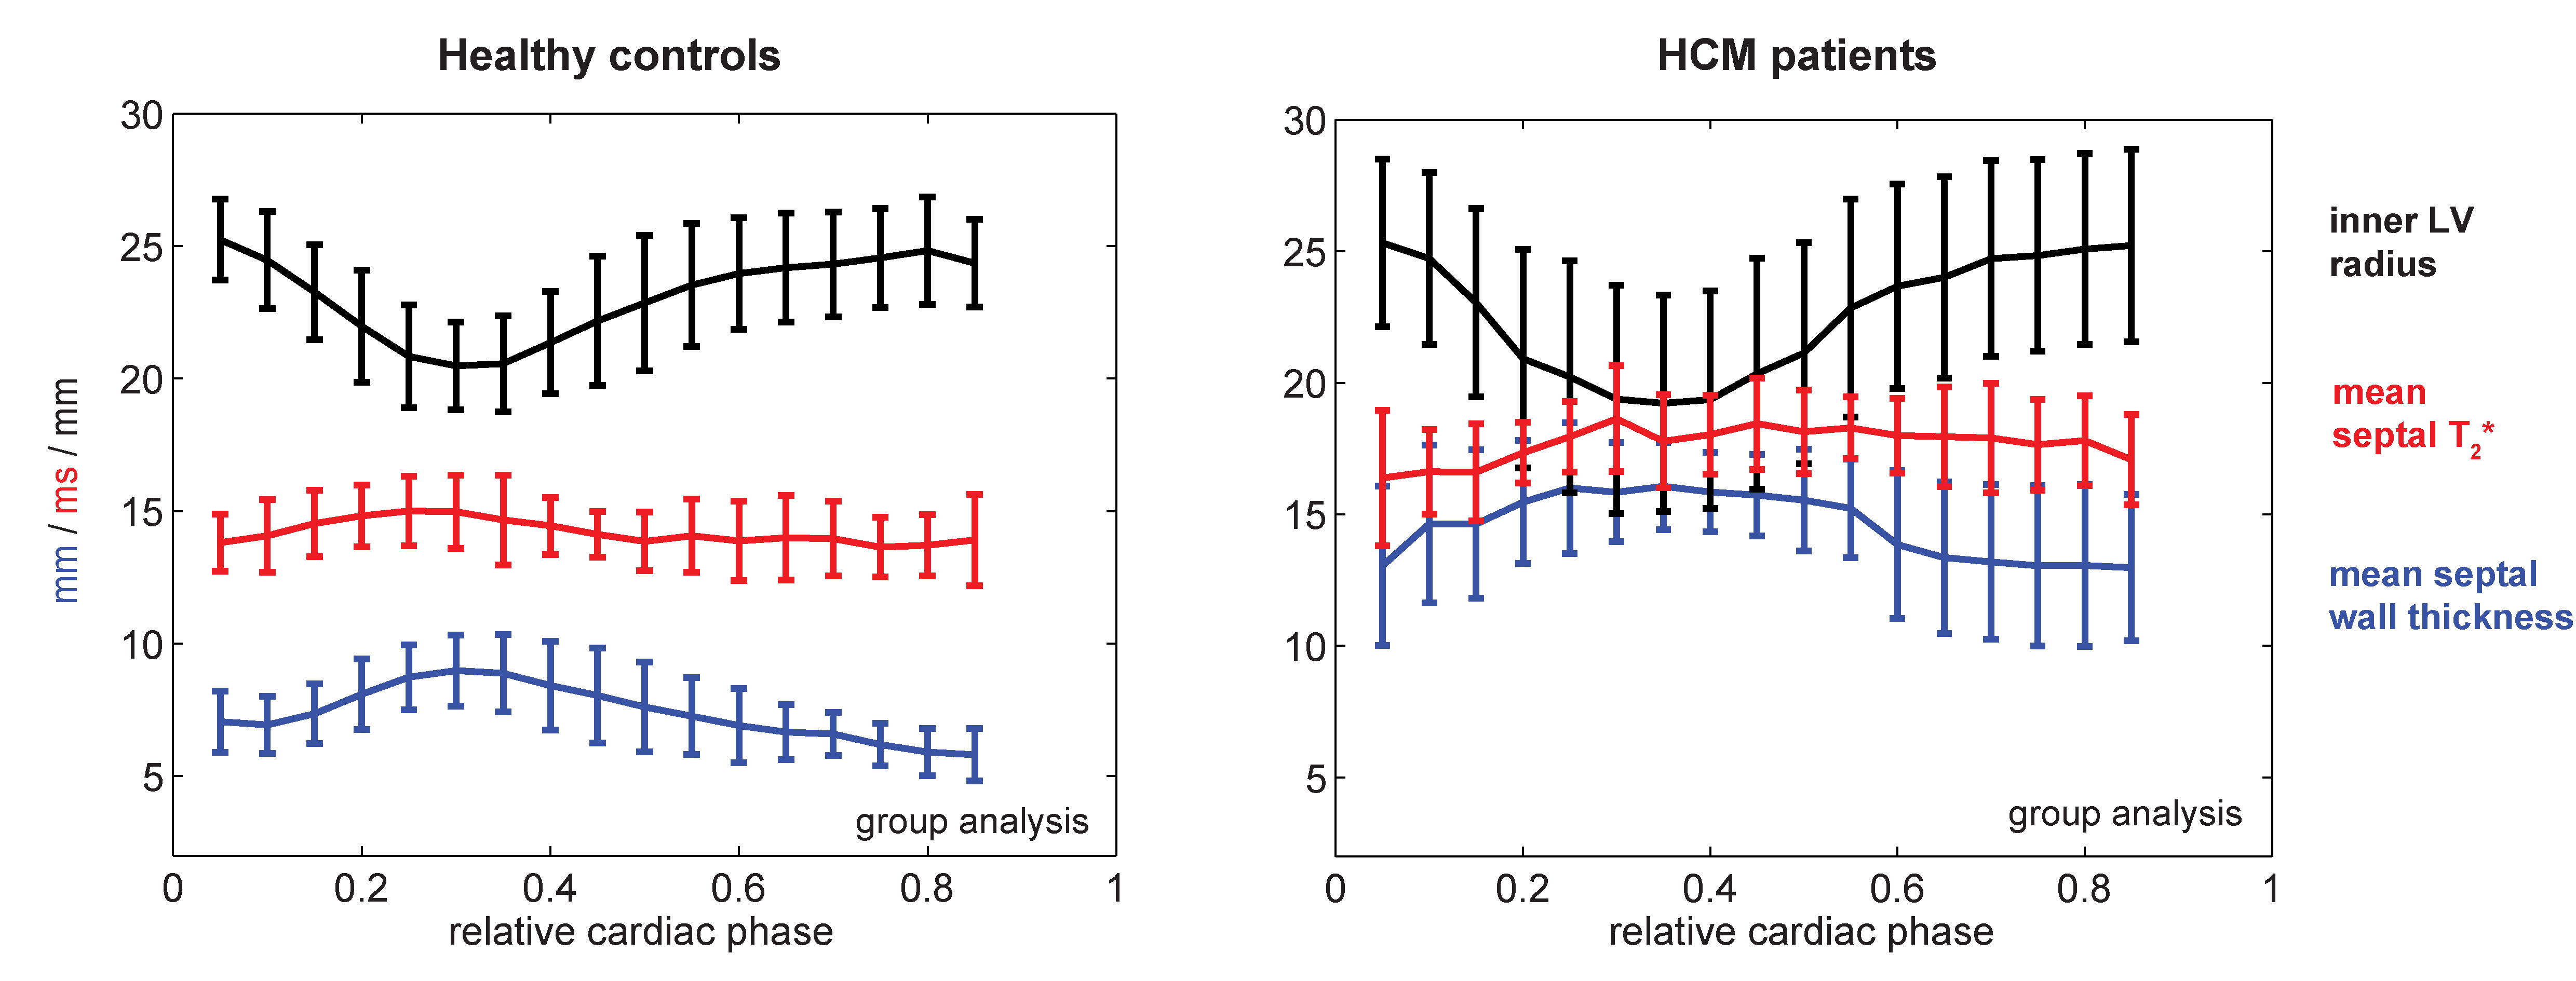
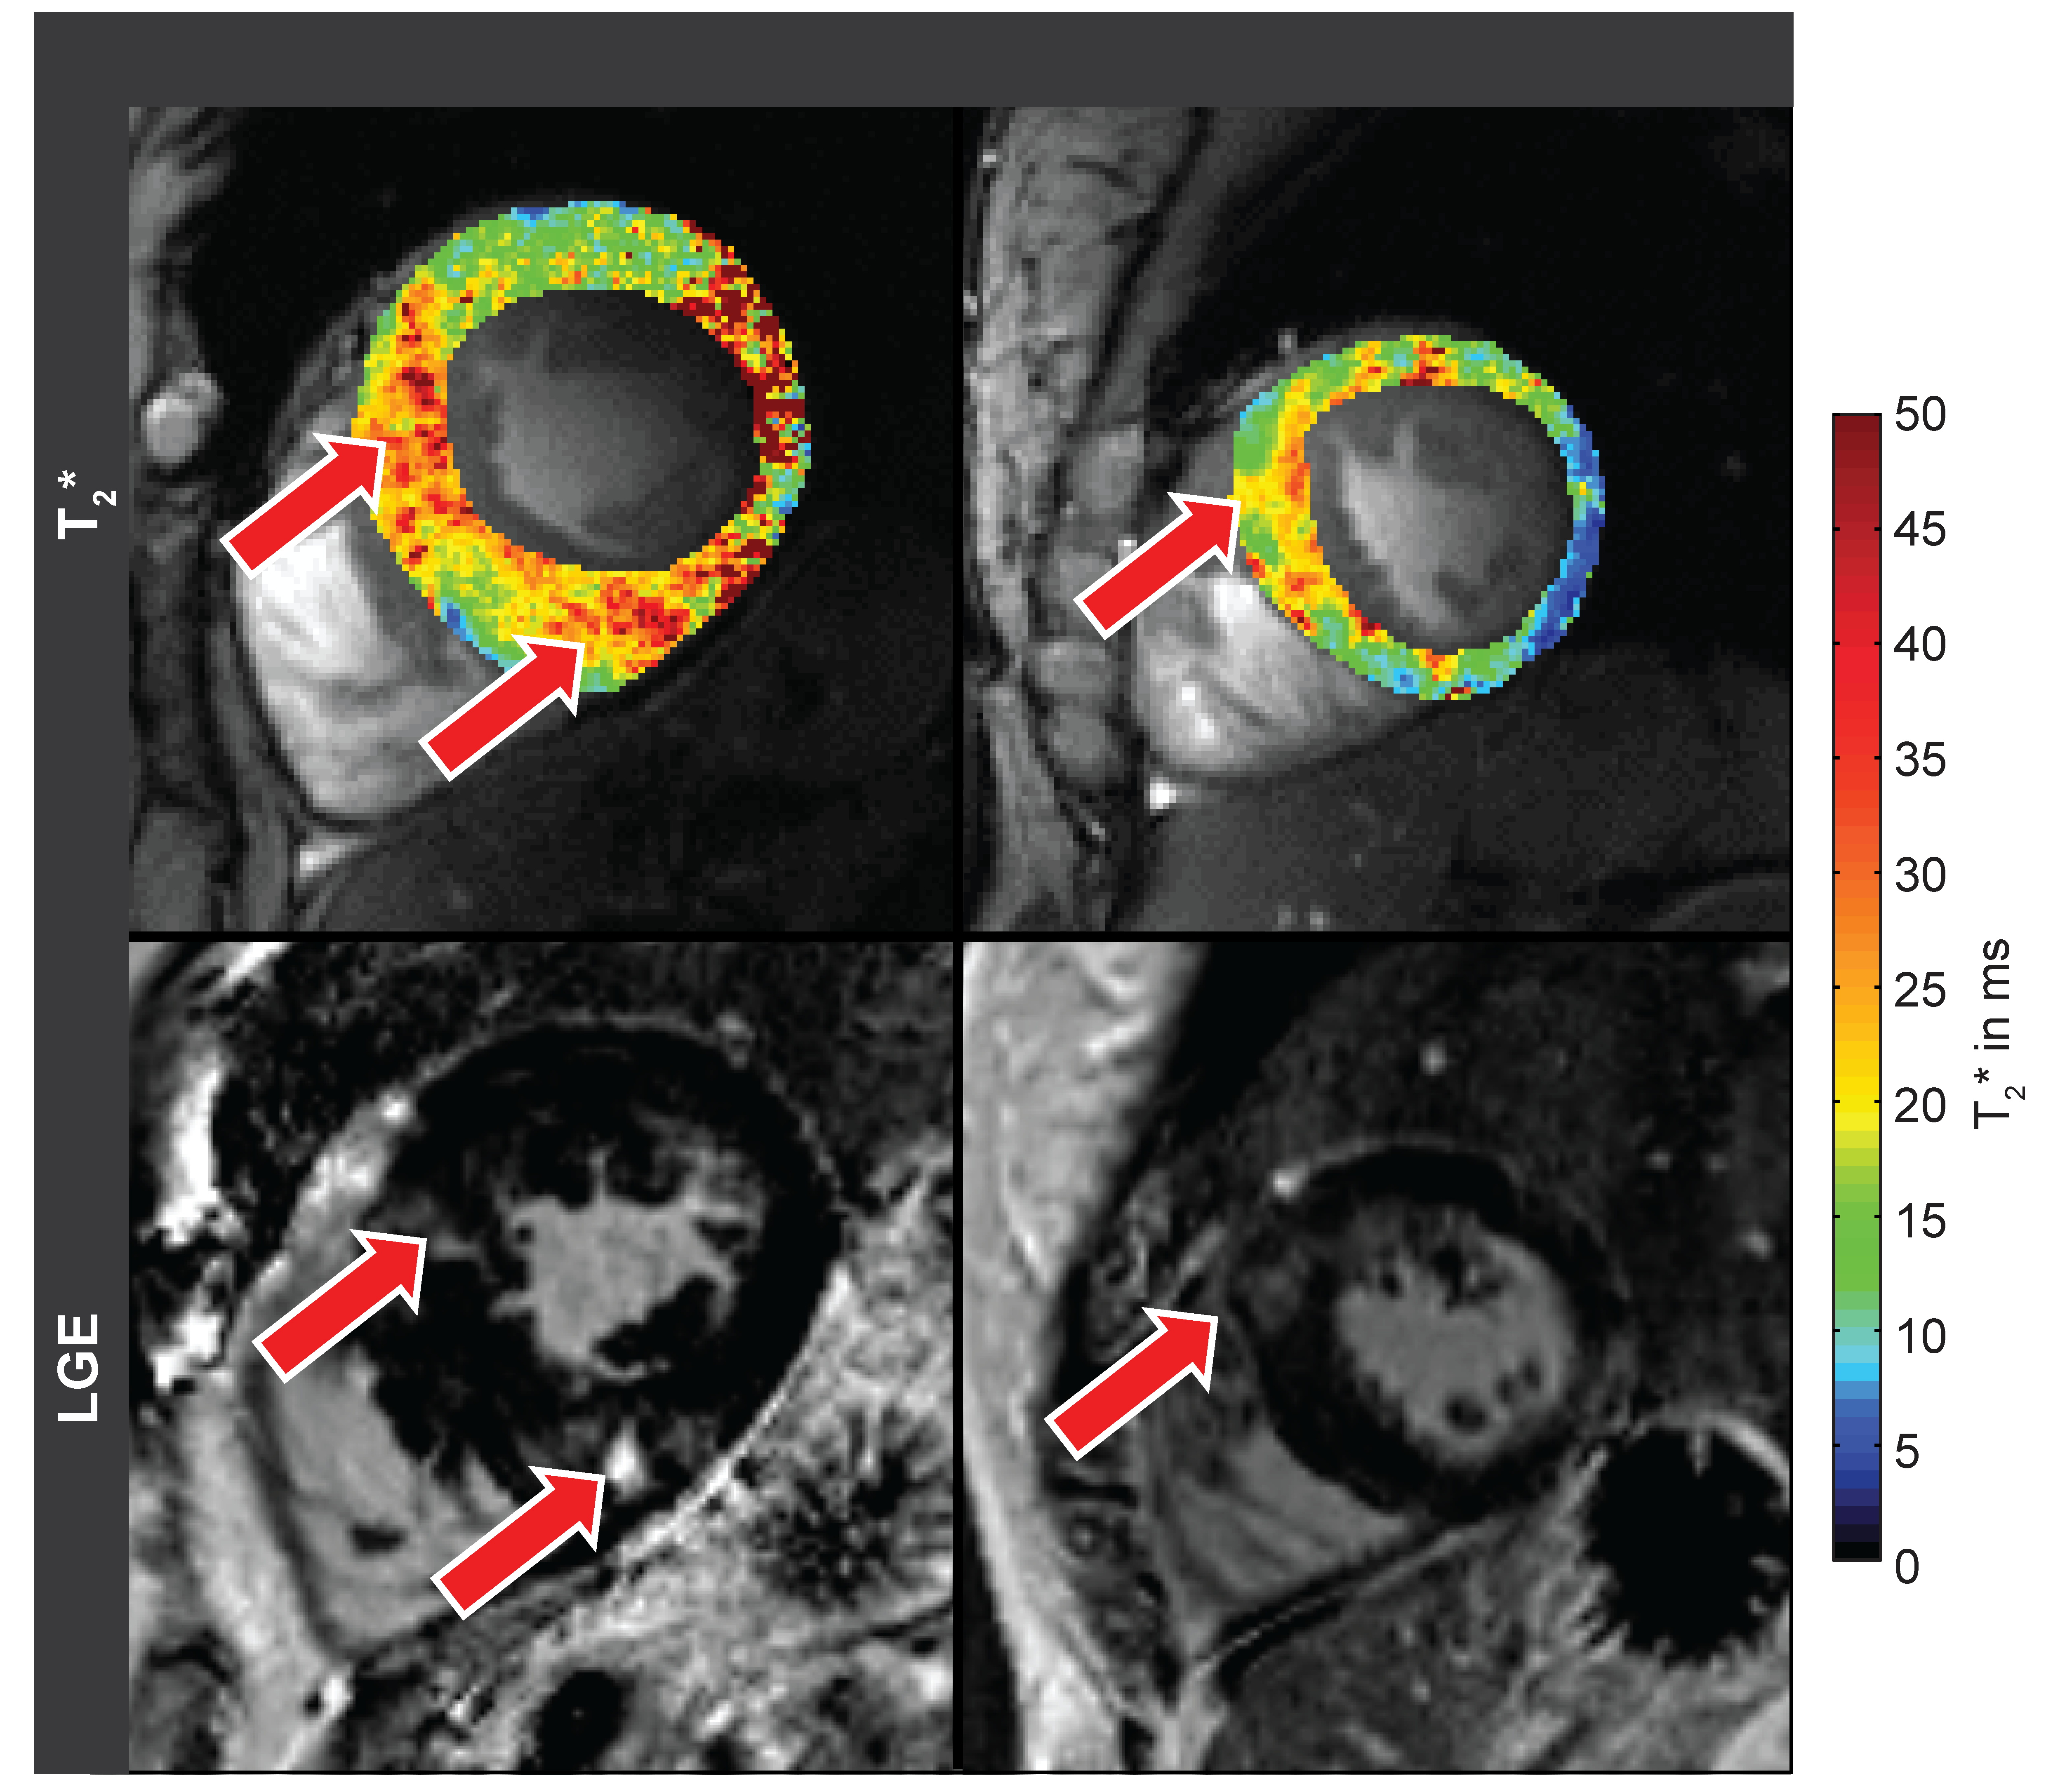
Both, SWT and T2* were significantly higher in patients than in controls. Mean SWT averaged for all cardiac phases was found to be 7.3±1.2mm in healthy controls and 14.1±2.5mm in patients. Mean septal T2* was 13.7±1.1ms in controls and 17.45±1.4ms in patients. Mean end-systolic SWT=9.8±1.4 mm and mean T2*=15.0±2.1ms were observed in healthy controls compared to end-systolic SWT=16.6±1.8 mm and T2*=17.7±1.2ms in patients. Mean end-diastolic SWT=6.2±1.2mm and T2*=13.4±1.3ms were determined in controls opposed to end-diastolic SWT=13.0±3.1mm and T2*=16.2±2.5ms for patients. A systolic increase and diastolic decrease of T2* were observed in both groups. The diastolic T2* decrease was less steep in patients (Fig.2). Cluster analysis based on SWT and septal T2* revealed distinct clusters for patients and controls (Fig.3). Areas showing LGE coincided with areas of increased T2* (Fig.4).Discussion
Ventricular septal T2* changes periodically across the cardiac cycle and is increased in HCM patients compared to healthy controls. Patient and control group can clearly be distinguished by septal T2* and septal wall thickness (Fig. 3). While Temporal variations of myocardial T2* have been attributed to changing myocardial blood volume fraction related to left ventricular blood pressure and resulting wall stress rather than changes in tissue oxygenation [12], two main factors are assumed to cause the observed overall T2* increase in HCM. Improved tissue oxygenation in HCM is unlikely. Instead, first, T2 has been reported to be elevated in HCM [7] related to inflammation and edema which would also increase T2* and is supported by areas of LGE coinciding with areas of increased T2* (Fig.4). Second, reduced myocardial perfusion and ischemia are common in HCM [8], effectively reducing tissue blood volume fraction resulting in a T2* increase. These conditions are also associated with a higher risk for a poor outcome in these patients. Hence our results suggest that myocardial T2* mapping could be beneficial for understanding cardiac (patho)physiology in vivo and support risk stratification in HCM.Acknowledgements
No acknowledgement found.References
[1] He (2014) Quant Imaging Med Surg 4(5):407. [2] Friedrich et al. (2013) J Cardiovasc Magn Reson 15:43. [3] Hezel et al. (2012) PLoS One 7(12):e52324. [4] Christen et al. (2012) Magn Reson Med 67(5):1458. [5] Thalhammer et al. (2012) J Magn Reson Imaging 36(4):847. [6] Manjon et al. (2010) Journal of Magnetic Resonance Imaging 31(1):192. [7] Sandino et al. (2015) J Cardiovasc Magn Reson 17(1):7. [8] Cerqueira et al. (2002) Circulation 105(4):539. [9] Meloni et al. (2014) Magn Reson Med 71(6):2224. [10] Guensch et al. (2013) PLoS One 8(1):e53282. [11] Tsaftaris et al. (2013) Circ Cardiovasc Imaging 6(2):311. [12] Huelnhagen et al. (2016) Magn Reson Med, Epub ahead of print, doi:10.1002/mrm.26312.Figures