0043
Comprehensive Cardiac Structure-Function MRI in Heart Transplant Recipients: Influence of Acute Cardiac Allograft Rejection1Radiology, Northwestern University, Chicago, IL, United States, 2Cardiology, Northwestern University, Chicago, IL, United States
Synopsis
Cardiac MRI provides a comprehensive structure-function evaluation of the heart with increasingly strong evidence of its ability to detect acute cardiac allograft rejection following heart transplant. In this large cohort of transplant recipients, quantitative T2 and ECV were significantly elevated during episodes of biopsy-proven rejection compared to baseline.
Introduction
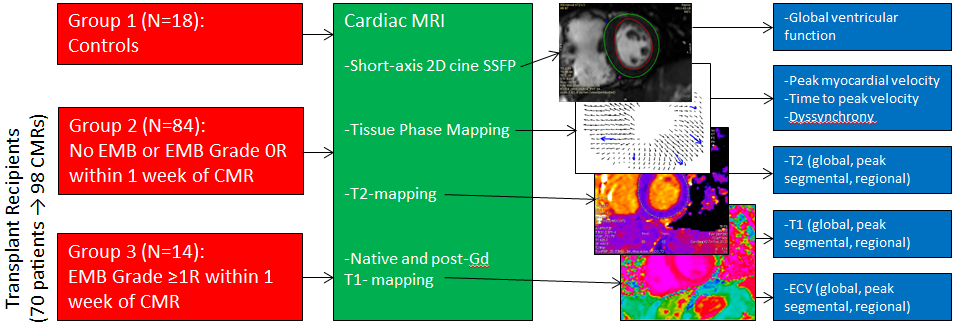
Acute cardiac allograft rejection (ACAR) occurs in about 25% of cardiac transplant (Tx) recipients within the first year following transplantation and is one of the important treatable causes of mortality post transplantation [1]. Endomyocardial biopsy (EMB) is the gold standard screening tool for ACAR, but it is invasive, expensive, and limited due to sampling error [2,3]. Cardiac magnetic resonance imaging (CMR) is a noninvasive alternative due to its capacity to evaluate global and regional left ventricular (LV) function and to quantify regional changes in LV tissue structure. T2-mapping has shown the most promise of the CMR techniques at detecting ACAR [4-6], but studies have been limited by small sample sizes, and the impact on other metrics of myocardial structure and function is unclear. The goal of this study was to evaluate a large cohort of Tx recipients for ACAR-dependent differences in T2-mapping and native and post-Gd T1-mapping, as well as myocardial velocities and dyssynchrony determined by tissue phase mapping (TPM).Methods
Seventy Tx recipients (age 50.6±17.2 years, female 43%) were prospectively recruited and underwent 98 total CMRs (6.4±6.2 years post Tx, 23% within 1yr post Tx) at 1.5T (Magnetom Aera or Avanto, Siemens, Erlangen, Germany). Scans were considered performed during an episode of rejection if an EMB within 1 week of CMR was ISHLT grade ≥1R. Antibody-mediated rejection was not examined due to small sample size. Eighteen age-matched healthy controls (age 50.1±16.1 years, female 33%) were also recruited for a CMR each (TPM was only included in 10 controls). Measures of LV systolic function (EDV, ESV, SV, HR, CO, EF, end diastolic myocardial mass) were calculated from a stack of 2D cine SSFP images of the LV using dedicated software (cvi42, v 5.3.6, Circle, Calgary, Canada). T2-mapping and pre- and post-contrast T1-mapping (to generate extracellular volume fraction (ECV) using hematocrit drawn at the time of CMR) were performed in short axis orientation at the LV base, mid, and apex. TPM data acquisition used a black-blood cine 2D phase-contrast sequence with tri-directional velocity encoding for the LV base, mid, and apex (venc=25 cm/s, temporal resolution=24 ms, spatial resolution=2.0x2.0 mm²). T2, native T1, and ECV maps were calculated to quantify global and regional T2, T1, and ECV based on the AHA 16-segment model (cvi42, v5.3.6, Circle, Calgary, Canada). TPM analysis included semi-automated identification of endo-and epi-cardial LV contours throughout the cardiac cycle and calculation of radial and longitudinal LV peak velocities and time to peak velocities (TTP) using an in-house tool (Matlab, Mathworks, Natick, MA). Dyssynchrony was calculated using the standard deviation of radial and longitudinal TTP.Results
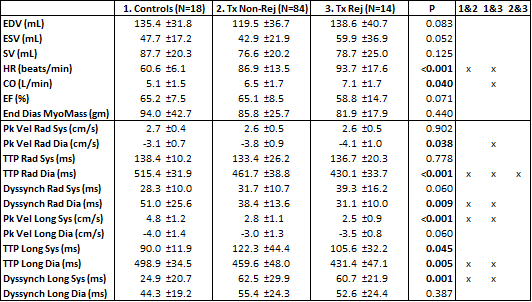
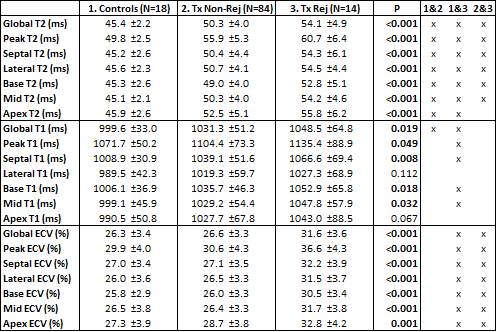
Of the 98 CMRs performed on Tx recipients, 14 were performed within a week of a positive biopsy (13 were 1R, 1 was 2R). One-way ANOVA and post-hoc analysis results for global ventricular function and TPM (myocardial velocities and dyssynchrony) are shown in table 1, and results for T2, T1, and ECV are shown in table 2. Tx recipients showed significantly increased HRs compared to controls (p<0.001), as well as significantly depressed peak systolic longitudinal velocities and increased systolic longitudinal dyssynchrony (all p<0.01); differences in TTP were attributable to differences in HR. Global and regional T2 were significantly higher in Tx recipients (all p≤0.001), as well as global T1 (p=0.048). In addition, Tx recipients with rejection at the time of CMR demonstrated significantly elevated T2 globally and regionally (all p≤0.005 except at apex) compared to recipients not experiencing rejection. ECV was also significantly increased in patients during rejection episodes globally and regionally (all p<0.001); no ECV differences were found between controls and patients without rejection.Conclusion
Tx recipients at baseline (no evidence of rejection) demonstrate elevated T2 and impaired systolic longitudinal function compared to controls. Among Tx recipients, hearts with histopathologic evidence of rejection demonstrate elevated T2 (increased edema) and ECV (interstitial expansion due to immunologic response and fibrosis) compared to recipient hearts without rejection. Quantitative T2 and ECV findings consistent with pathologic grade suggest that CMR has potential as a valuable noninvasive tool for allograft surveillance.Acknowledgements
Grant support by NHLBI R01 HL117888.References
1. Stehlik J, et al. The registry of the International Society for Heart and Lung Transplantation: Twenty-eighth adult heart transplant report. J Heart Lung Transplant 2011; 30:1078-1094.
2. Costanzo MR, et al. The International Society of Heart and Lung Transplantation guidelines for the care of heart transplant recipients. J Heart Lung Transplant 2010; 29:914-956.
3. Fishbein MC, Kobashigawa J. Biopsy-negative cardiac transplant rejection: Etiology, diagnosis, and therapy. Curr Opin Cardiol. 2004; 19:166-169.
4. Marie PY, et al. Detection and prediction of acute heart transplant rejection with the myocardial T2 determination provided by a black blood magnetic resonance imaging sequence. J Am Coll Cardiolo. 2001; 37:825-831.
5. Butler CR, et al. Cardiovascular magnetic resonance in the diagnosis of acute heart transplant rejection: A review. Journal of Cardiovascular Magnetic Resonance 2009; 11:7, published online.
6. Usman AA, et al. Cardiac magnetic resonance T2 mapping in the monitoring and follow-up of acute cardiac transplant rejection: A pilot study. Circ Cardiovasc Imaging 2012; 5:782-790.
Figures