0041
Early Gradual Assessment of Tissue Injury and Functional Outcome after Myocardial Infarction by Cardiovascular Magnetic Resonance T1 Mapping1Department of Cardiology, University Hospital Duesseldorf, Duesseldorf, Germany, 2Department of Molecular Cardiology, Heinrich-Heine University Duesseldorf, Duesseldorf, Germany, 3Cardiovascular Research Institute Duesseldorf, Heinrich-Heine University, Duesseldorf, Germany
Synopsis
The value of CMR to distinguish between the severity of ischemic injuries after myocardial (MI) has yet to be established. Here, we quantified local tissue injuries and their correlation with functional outcome in two different experimental models of MI including native and post-contrast T1 maps, T2 maps and LGE. Only native T1 maps enabled in the acute phase after MI the detection of substantial differences in myocardial tissue texture between the two models, where neither of the other measures was indicative. In conclusion, native T1 mapping enables a gradual assessment of myocardial injury and holds predictive potential for the functional outcome.
Purpose
Cardiovascular magnetic resonance (CMR) with gadolinium-based contrast agents (GCAs) has established as gold standard for tissue characterization after myocardial infarction (MI).1 Beyond accurate diagnosis, the value of CMR to predict the functional outcome by an early assessment of the severity of ischemic injury after MI has yet to be substantiated.Methods
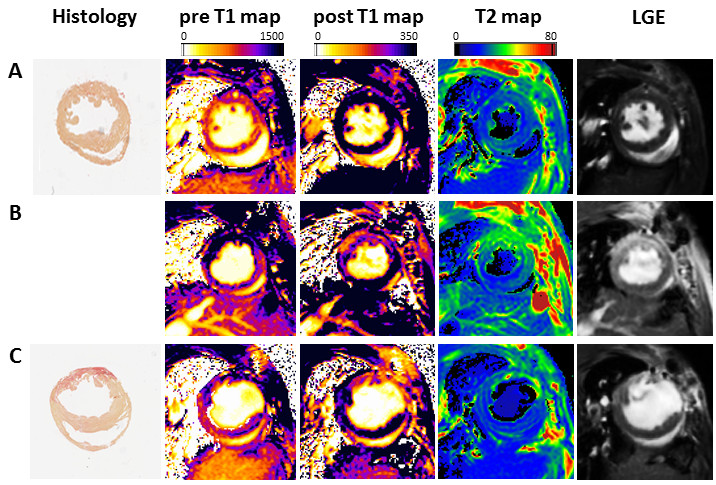
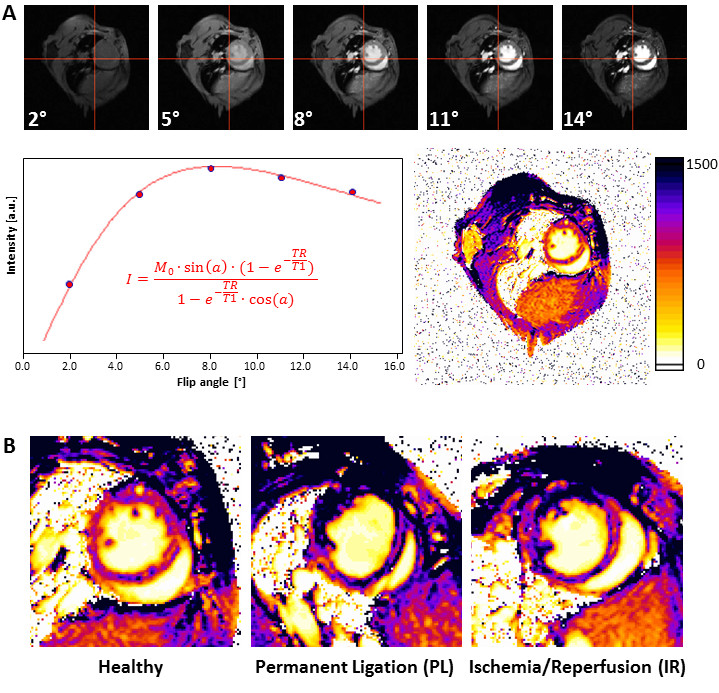
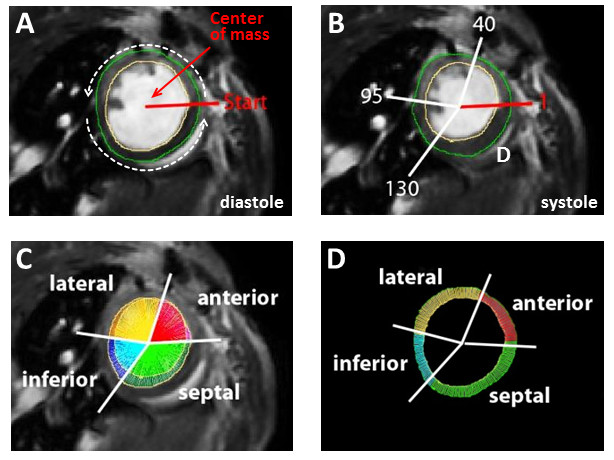
Here, we systematically compared recent CMR approaches for quantification of local tissue injury and their correlation with the functional outcome after MI. For this, we used two murine models of MI with expected differences in ischemic injury and therefore diverse functional outcomes: either permanent ligation (PL, n=14) of the left anterior descending artery or 50 min ischemia/reperfusion (IR, n=13). Comprehensive CMR measurements at 9.4T included native and post-contrast T1 maps, T2 maps as well as late gadolinium enhancement (LGE) at days 1 and 21 post MI (Figure 1). For T1 mapping we used a retrospectively triggered gradient-echo sequence with variable flip angles2 providing true steady-state conditions, which allowed the reliable acquisition of high quality maps (Figure 2A). Besides global cardiac function, we analysed regional alterations on basis of a midventricular slice by an in-house developed software module, which divided the LV into 200 equivalent sectors as previously described (Figure 3).3 These sectoral definitions were applied to all datasets (cine, pre- and post-contrast T1, T2, LGE) to compare and correlate the measures in the anatomically corresponding areas.Results
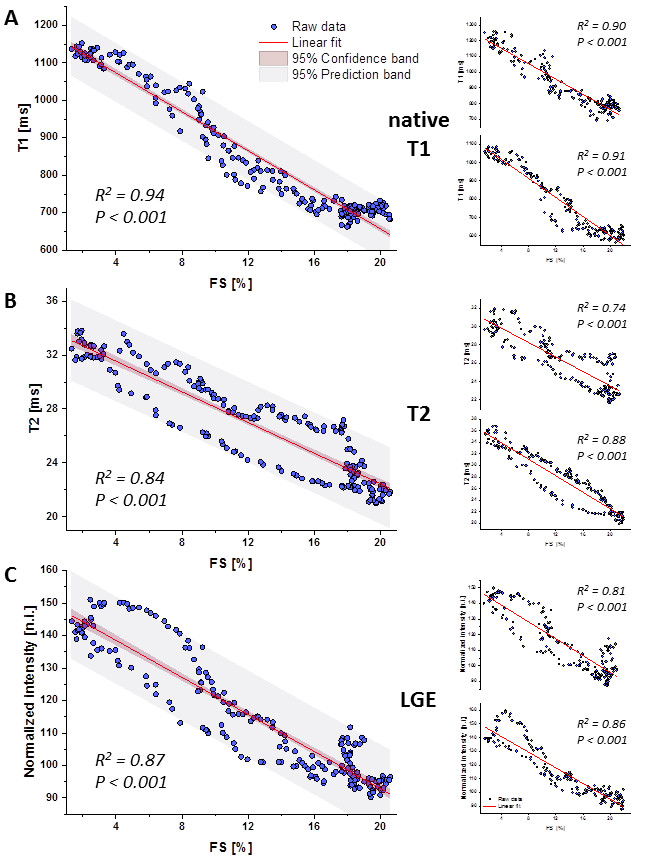
Sectoral analysis of native T1 maps enabled already in the acute phase after MI the detection of substantial differences in myocardial tissue texture between the two MI models (native T1 at day 1: PL 1280.0±162.6 ms, IR 1115.0±140.5 ms, P<0.001, n=14/13), which were later associated with an impaired functional outcome in the non-reperfused group (EF at day 21: PL 24.5±7.0%, IR 33.7±11.6%, P<0.05, n=14/13). As can be recognized in the representative examples shown in Figure 2B, a more transmural pattern and also darker area (= increased T1 values) were observed in non-reperfused MIs. At that early time point neither the initial loss of function nor LGE or T2 (T2: PL 28.7±2.1 ms, IR 32.2±3.3 ms, P<0.001, LGE normalized signal intensity (NI): PL 129.5±15.6, IR 134.7±18.8, P<0.05, n=14/13) were indicative for the expected worsening of cardiac function in PL mice at the end of the observation period. In the non-reperfused group – as expected – also local function in both infarcted and remote regions was essentially more compromised 21 days after MI than in the reperfused group (FS in ischemic/remote sectors: PL 2.7±2.0/12.9±3.3%, IR 7.4±4.4/19.1±4.2%, both P<0.001, n=14/13). Correlation of the acute individual measures (day 1) with contractile function in the anatomically corresponding area on day 21 revealed strong significance for all parameters (Figure 4), but again early pre-contrast T1 maps showed the best interrelationship with the functional outcome after remodeling (R2 = 0.94).Discussion
In the present study, we show in two well-defined experimental models of MI, that myocardial tissue characterization making use of endogenous MR relaxometry holds the potential to overcome the need for Gd-based contrast agents (GCAs) to differentiate ischemic and non-ischemic areas after MI. In particular native T1 maps derived from sequences with retrospective gating allowed an early and sensitive discrimination of the degree of tissue injury between the two models, which was indicative for the differential functional outcome after remodeling. Furthermore, comprehensive analysis of all measures over 200 sectors covering the left ventricle revealed that local native T1 values acquired in the acute phase after MI exhibited the best correlation with the extent of functional depression in the chronic stage at the same site. The distinct superiority of the T1 mapping approach in this preclinical study is surprising and in all likelihood caused by the robustness of our retrospective gating approach against variations in cardiac and respiration rates. In contrast to currently used clinical cardiac T1 mapping techniques, which are not only hampered by motion artefacts due to inadequate triggering (see reference4 for a recent review). Altogether, this results in inaccurate local values and impedes a standardized analysis, which may, however, be overcome with the procedures used in this study.Conclusions
The present T1 mapping approach allows a robust and reliable characterization of myocardial tissue injury after acute MI. Due to its large dynamic scale from ~200-1800 ms (comprising native and post-contrast) as compared to ~20-40 ms for T2 and 80-160 NI for LGE, it permits a sensitive and graduated assessment of the severity of the insult without the need for any contrast agent.Acknowledgements
This work was supported by the Sonderforschungsbereich 1116 “Master switches in cardiac ischemia“ of the Deutsche Forschungsgemeinschaft (DFG), subprojects B2, B5, and a GEROK scholar, as well as by the Forschungskommission of the Medical Faculty of the Heinrich Heine University.References
1. Pennell DJ. Cardiovascular magnetic resonance. Circulation. 2010;121:692-705.
2. Coolen BF, Geelen T, Paulis LE, Nauerth A, Nicolay K and Strijkers GJ. Three-dimensional T1 mapping of the mouse heart using variable flip angle steady-state MR imaging. NMR in biomedicine. 2011;24:154-62.
3. Bonner F, Jacoby C, Temme S, Borg N, Ding Z, Schrader J and Flogel U. Multifunctional MR monitoring of the healing process after myocardial infarction. Basic Res Cardiol. 2014;109:430.
4. Puntmann VO, Peker E, Chandrashekhar Y and Nagel E. T1 Mapping in Characterizing Myocardial Disease: A Comprehensive Review. Circ Res. 2016;119:277-99.
Figures