0037
Joint Native Myocardial Fat Fraction, Off-Resonance and R2*/T2* Mapping in Ischemic CardiomyopathiesJames W Goldfarb1, Usama Hasan1, and Jie J Cao1
1St Francis Hospital, Roslyn, NY, United States
Synopsis
Myocardial fat content, R2*/T2* and off-resonance frequency can be measured with high resolution using a native MR water-fat separation imaging technique applied to multiple gradient echo images. Significant differences in myocardial fat fraction were found consistent with fatty metaplasia in a subset of chronic myocardial infarction patients. Off-resonance and T2* changes consistent with intramyocardial hemorrhage were observed in a subset of acute myocardial infarction patients.
Introduction
Multiple gradient echo imaging allows the joint quantification of myocardial T2*/R2*, off -resonance frequency and fat fraction. In a single breath-hold, three native maps of independent MR properties can be obtained for quantitative myocardial tissue characterization. Fatty metaplasia has been shown in chronic myocardial infarction and non-ischemic cardiomyopathies associated with diabetes and obesity. Changes in T2* and off-resonance frequency due to susceptibility changes have been associated with hemorrhagic myocardial infarction and hemochromatosis. The goal of this study was to obtain normal ranges of the three native parameters maps and investigate their use in acute and chronic myocardial infarction (MI).Methods
48 subjects (17 normal control, 11 Acute MI at 3 days and 20 Chronic MI >2 yrs) were studied at 1.5T with native joint R2*/T2*, off-resonance and fat fraction mapping using a multipeak model with R2* and B0 corrections [1] in parallel short and long axis slice views spanning the entire left ventricle.The water-fat separation framework provides four images: water only, fat only, R2* and off-resonance. Off resonance maps were high-pass filtered to remove B0 field contributions. Additionally, conventional bSSFP CINE and late gadolinium-enhanced (LGE) imaging (0.15 mmol/kg) were obtained. Mean parameter values were measured in the heart (16 segment AHA model). Parameter maps were visually evaluated for focal lesions. Normal segmental differences and associations with LGE presence and age of MI were evaluated with statistical tests (ANOVA).Results
Focal fatty metaplasia was visualized in a subset of chronic MI patients (n=12). T2* and off-resonance segmental changes were also well visualized in a subset of acute MI patients (n=3) (See Figure 1, red circles). Focal myocardial fat lesions had an admixture of water and fat signal fat fraction = 52.8% ±14.6. Figure 2 shows acute and chronic MI parameters compared with normal values. Fat fraction was significantly higher in chronic myocardial infarction (16.7% ± 12.9 vs 2.8% ± 2.1, p < 0.001). Off-resonance frequency was significantly lower in both chronic and acute myocardial infarction (3.2 Hz ±22.6 vs 20.9 Hz ± 21.6, p=0.01). 18 chronic MI patients had fat fractions outside of the normal range (18.4% ± 12.4 vs 2.8% ± 2.1, p < 0.001). Three acute MI patients had R2* values and off-resonance frequencies outside of normal ranges and all demonstrated MVO in LGE images consistent with intramyocardial hemorrhage.Discussion
Myocardial fat content, R2*/T2* and off-resonance frequency can be measured with high resolution using a native MR water-fat separation imaging technique applied to multiple gradient echo images. Significant differences in myocardial fat fraction were found consistent with fatty metaplasia in a subset of chronic MI patients. Off-resonance and T2* changes consistent with intramyocardial hemorrhage were observed in a subset of acute MI patients.Acknowledgements
No acknowledgement found.References
1. Hernando D, Kellman P, Haldar JP, Liang ZP. Robust water/fat separation in the presence of large eld inhomogeneities using a graph cut algorithm. Magn Reson Med 2010;63(1):79-90.Figures
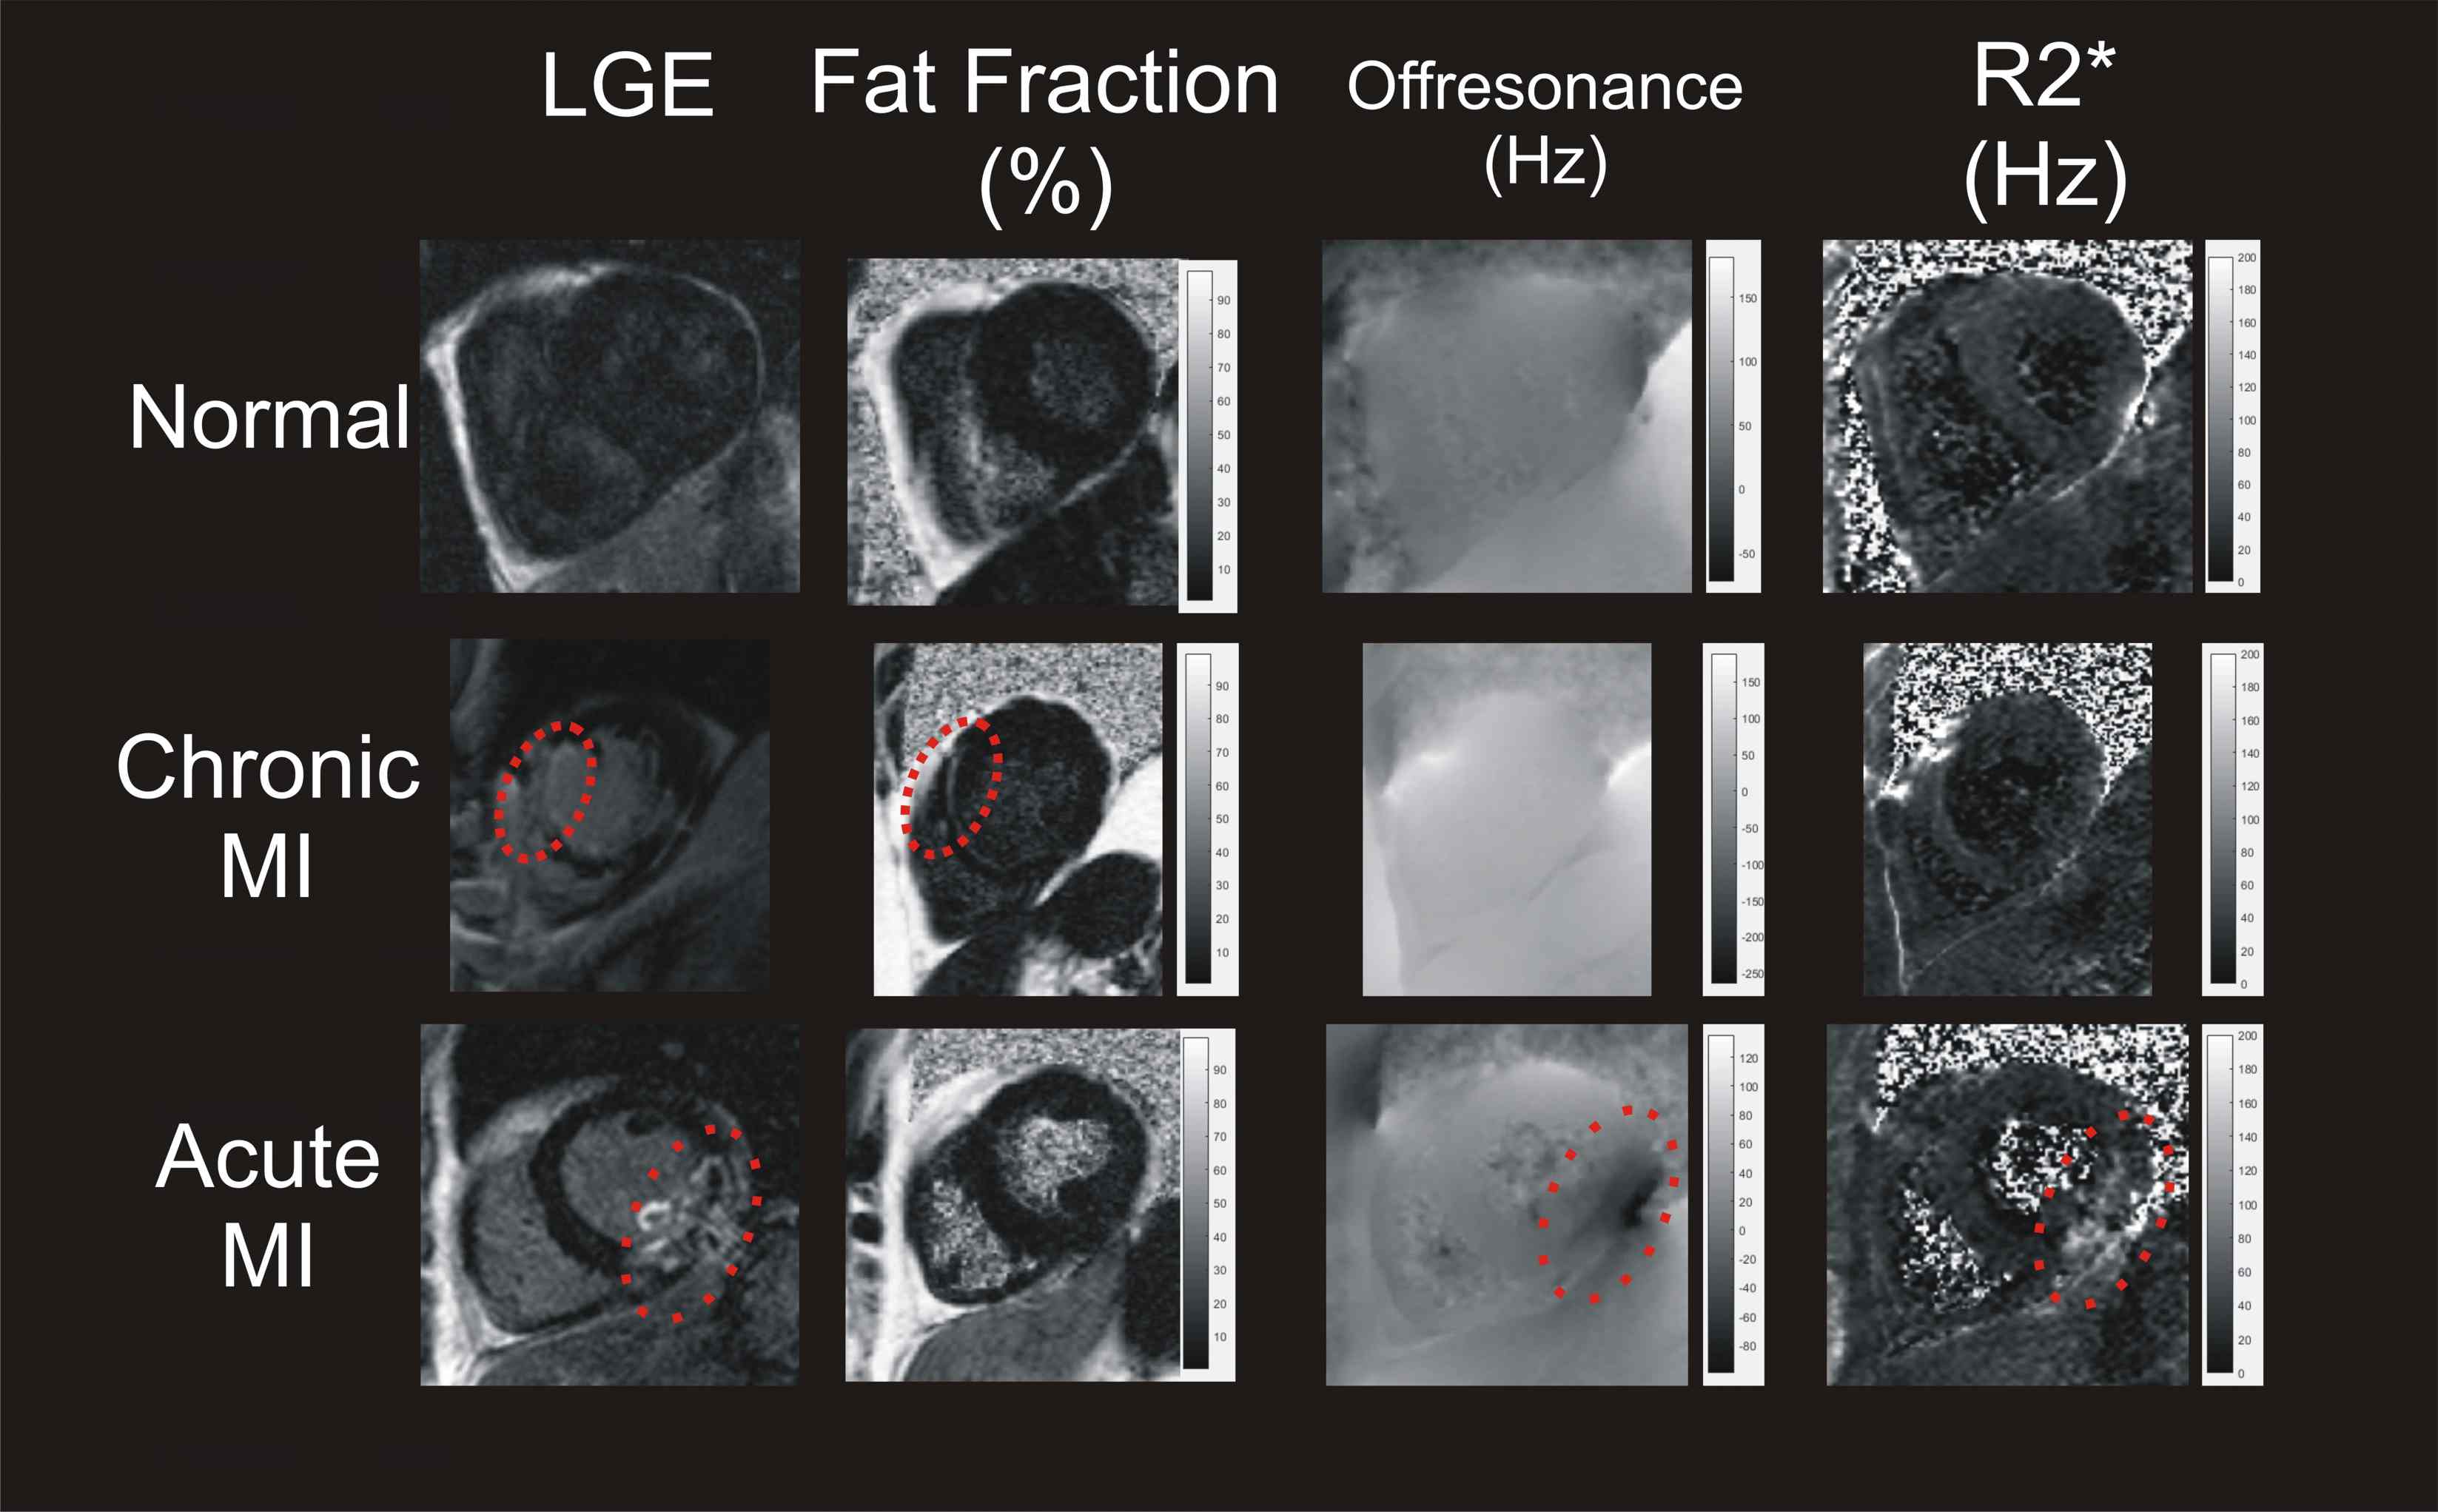
Figure 1: Native parameter maps showing focal tissue changes in
areas of late gadolinium enhancement. Fatty metaplasia in chronic MI and
intramyocardial hemorrhage in acute MI (red circles).
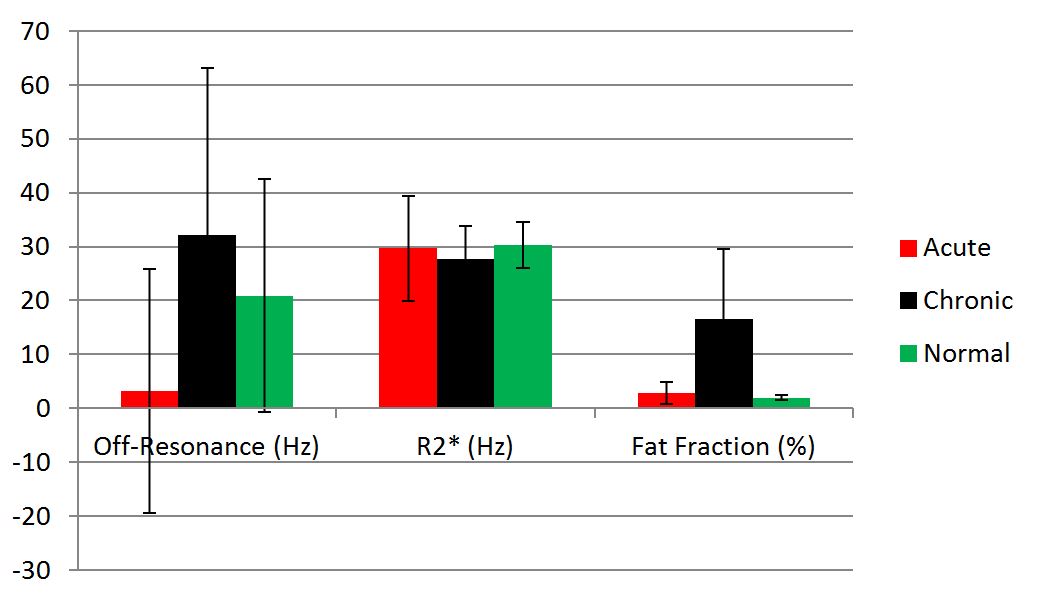
Figure 2