0036
Quantifying the Influence of Respiration and Cardiac Pulsations on the Cerebrospinal Fluid Dynamics using Real-Time Phase-Contrast MRI1Woodruff School of Mechanical Engineering, Georgia Institute of Technology, Atlanta, GA, United States, 2Department of Mechanical Engineering, Conquer Chiari Research Center, The University of Akron, Akron, OH, United States, 3MR R&D Collaborations, Siemens Healthcare, Columbus, OH, United States, 4MR R&D Collaborations, Siemens Healthcare, Atlanta, GA, United States, 5Department of Biological Engineering, The University of Idaho, Moscow, ID, United States, 6Department of Radiology & Imaging Sciences and Biomedical Engineering, Emory University, Atlanta, GA, United States
Synopsis
Cerebrospinal fluid (CSF) flow undergoes periodic pulsatile motion driven by cardiac and the respiratory forces. Invasive studies using spinal taps as well as non-invasive studies using phase contrast MRI (PCMRI) sequences have well documented the cardiac-driven CSF flow. PCMRI, however, often uses a conventional cine-phase contrast technique gated to the cardiac cycle, and thus cannot measure the effects of respiration or other non-cardiac transient events such as coughing. Examining these effects requires the ability to perform real-time MRI measurements of continuous CSF flow along the spine and cranial cavity, and determine accurate instantaneous CSF flow velocity values.
Purpose
We employed a Real-Time PCMRI (RT-PCMRI) sequence, previously used to measure blood velocities in the great vessels near the heart, to continuously measure CSF velocity magnitude and direction due to both cardiac and respiratory pulsations. The purpose of this study was to prospectively validate the RT-PCMRI sequence in a controlled phantom model, and to quantify the influence of cardiac pulsations, respiratory changes and coughing on the instantaneous CSF velocity at the level of the Foramen Magnum in a set of human subjects.Methods
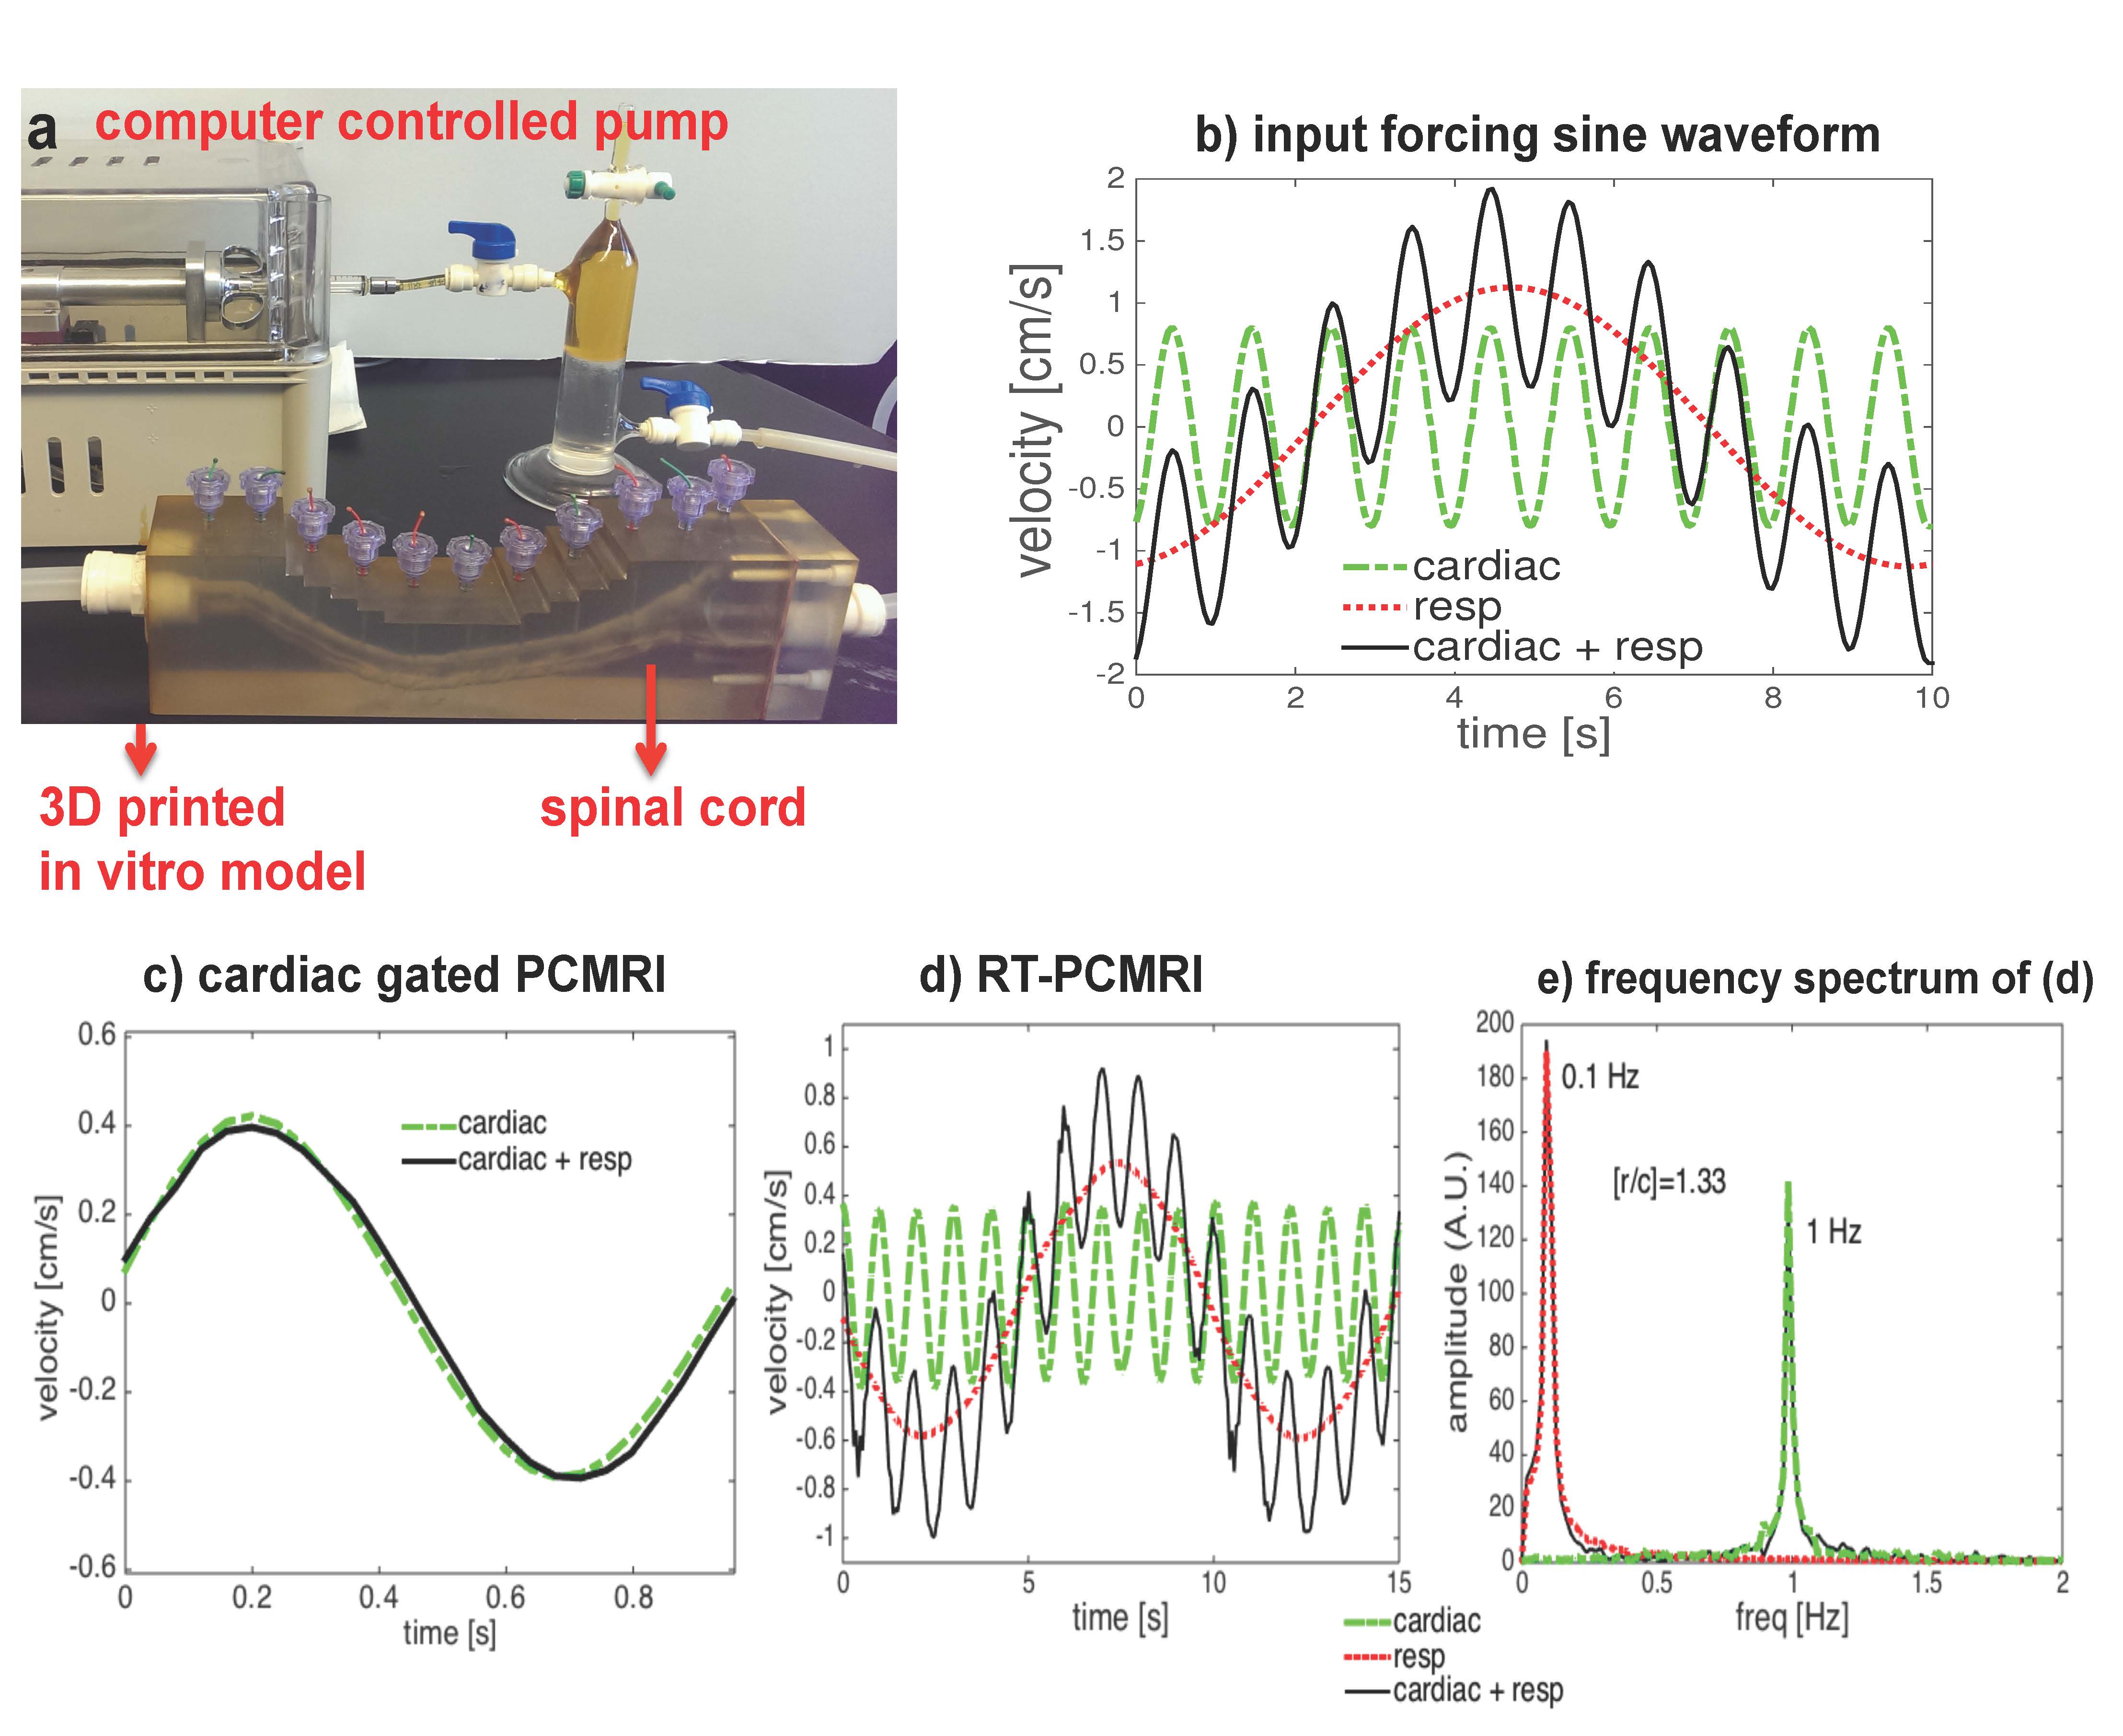
A computer controlled pulsatile pump system [1] was used to circulate water in an ebb-and-flow manner through a 3D in-vitro model representative of the subarachnoid space (SSS) (Fig. 1a) with velocities representative of CSF flow [2] (see Fig. 1b).
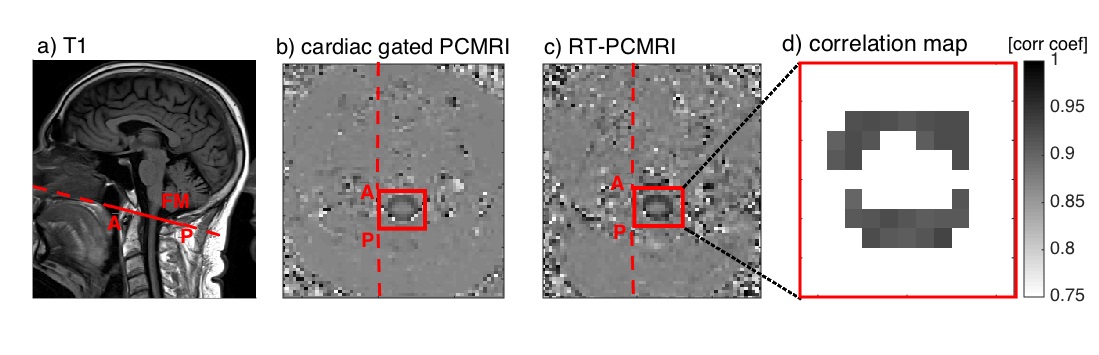
The in-vivo study was approved by the institutional review board, and was performed after informed consent was obtained from each subject. Twenty healthy subjects (twelve women and eight men; age range: 20-59 years) were enrolled in the study, and were scanned lying supine in a Siemens 3T scanner (Tim Trio, Siemens Healthcare, Erlangen, Germany) using multi-channel head and neck coils. High-resolution sagittal T2-weighted fast spin echo MR images were collected to determine the location of FM. Transverse images were then acquired at the FM using the conventional cardiac-gated PCMRI and the RT-PCMRI sequence (Fig. 2a). During the approximately 1-min RT-PCMRI acquisitions, subjects were instructed to perform natural breathing, deep abdominal breathing [3], a 20s breath-hold, and a 20s long succession of short coughing events preceded and followed by deep breathing. Additionally, respiration motion was recorded using a respiratory belt (Siemens Medical Solutions, Erlangen, Germany).
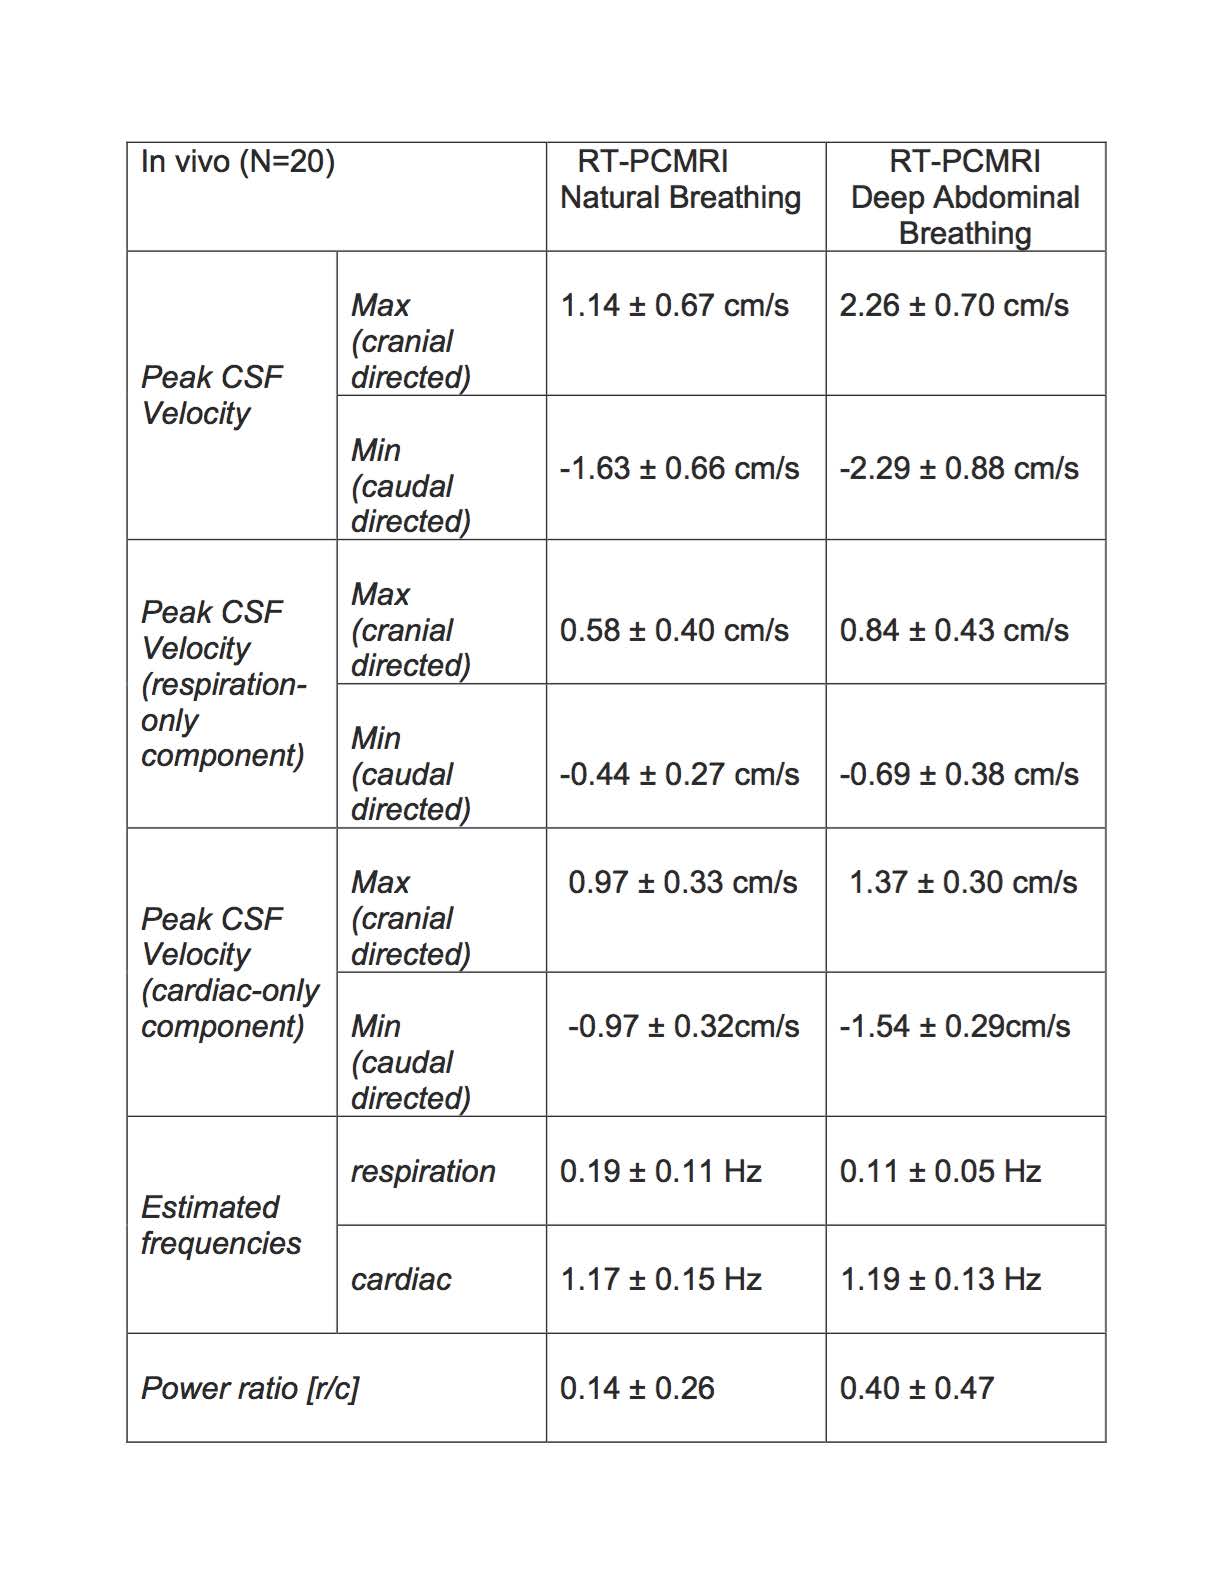
A frequency domain power ratio analysis determined the relative contribution of respiration verses cardiac ([r/c]) components of CSF velocity. In order to quantify the inter-subject variability, the mean and standard deviation (N=20) of a set of dependent variables were calculated. Finally, to quantify the increase in the instantaneous CSF velocities, a ratio of the maximum CSF velocity during coughing and the average of maximum CSF velocity at baseline before coughing was computed for the significance threshold that was set at p=0.05.
Results
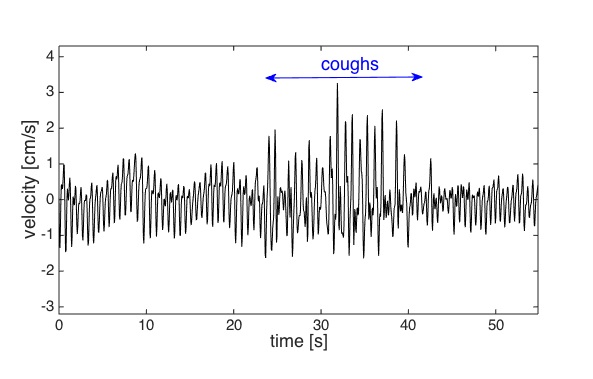
When the input pumping force for the phantom contains either only the cardiac or cardiac plus respiratory component, conventional PCMRI shows a close agreement for the two waveforms indicating that it averages out the respiration effects (Fig. 1c). RT-PCMRI measurements, however, match the variations for each of the corresponding input forcing waveforms (Fig. 1d). During deep abdominal breathing, the peak amplitude of the cardiac component of the CSF velocity measured with conventional PCMRI (Fig. 3a) is comparable to the amplitude variations of the cardiac component visible on the RT-PCMRI measurements (Fig. 3b). However, only RT-PCMRI revealed the slower and larger amplitude modulations due to respiration. During breath-hold, only the cardiac fluctuations remain visible as respiratory effects are suppressed (Fig. 3d). Table 1 quantifies the inter-subject variability of CSF velocity. Figure 4 shows a 3-fold increase in CSF velocity during coughing for a representative subject, while the peak CSF velocity increased by a factor of 2.27 ± 1.40 (N=20).Discussion
We validated the accuracy of the RT-PCMRI using a 3D phantom model, which also demonstrated that conventional PCMRI does not provide accurate measurements of the magnitude and directionality of instantaneous CSF velocity. Our results confirm the feasibility of the RT-PCMRI for quantifying respiratory and cardiac-driven CSF flow velocities (magnitude and direction) non-invasively in real-time across the FM of subjects. The observed CSF velocity modulations during deep abdominal breathing were consistent with previous observations [2, 5]. Finally, the rapid and sharp rise (and fall) in the CSF peak velocities during coughing is due to the rise (and fall) in intra-abdominal and intra-thoracic pressure that is communicated quasi-immediately to the CSF via the venous system [6].
Accurate MRI-based measurements of instantaneous CSF flow (e.g. for non-invasive monitoring of intra-cranial pressure [7] or quantification of intrathecal drug delivery [8]) require the use of RT-PCMRI to account for respiration effects. Additionally, craniospinal disorders, such as Chiari malformation (CM) and syringomyelia (SM), directly affect the craniospinal mechanical compliance, and obstructed CSF flow at FM due to lowered cerebellar tonsils cause greater CSF velocities [9]. Since conventional cardiac gated PC-MRI cannot allow capturing respiratory or cough driven CSF motion, this RT-PCMRI technique can provide a clinical option for better understanding the influence of such forces in populations with CM, SM, and other neurological conditions.
Conclusion
RT-PCMRI can non-invasively measure instantaneous CSF velocity driven by cardiac pulsations, respiration, and coughing in real-time.Acknowledgements
This study was funded by American Syringomyelia & Chiari Alliance Project and the Conquer Chiari Foundation.References
[1] Pahlavian SH, Yiallourou T, Tubbs RS, et al. The impact of spinal cord nerve roots and denticulate ligaments on cerebrospinal fluid dynamics in the cervical spine. PLoS ONE 2014; 9(4), e91888 ?
[2] Chen L, Becketta A, Vermac A, Feinberga DA. Dynamics of respiratory and cardiac CSF motion revealed with real-time simultaneous multi-slice EPI velocity phase contrast imaging. NeuroImage 2015; 122:281-287. doi:10.1016/j.neuroimage.2015.07.073
[3] Wang SZ, Li S, Xu XY, et al. Effect of slow abdominal breathing combined with biofeedback on blood pressure and heart rate Variability in prehypertension. J Altern Complement Med 2010; 16: 1039–1045. doi: 10.1089/acm.2009.0577
[4] Alperin N, Lee SH. PUBS: Pulsatility-based segmentation of lumens conducting non-steady flow. Magn Reson. Med. 2003; 49(5): 934-44.
[5] Yamada S, Miyazaki M, Yamashita Y, et al. Influence of respiration on cerebrospinal fluid movement using magnetic resonance spin labeling. Fluids Barriers CNS 2013; 10:36 – 44. doi:10.1186/2045-8118-10-36
[6] Williams B. Cerebrospinal fluid pressure changes in response to coughing. Brain 1976; 99:331– 46
[7] Alperin N, Lee SH, Bagci AM. MRI measurements of intracranial pressure in the upright posture: The effect of the hydrostatic pressure gradient. J Magn Reson Imaging 2015; Oct;42(4):1158-63. doi: 10.1002/jmri.24882.
[8] Wang C, He C, To CY, Kulacz J, Kattner K, Stroink A. Cerebrospinal fluid: physiology, biomarker and methodology. ed. Slavik V, Dolezal T, In: Cerebrospinal Fluid: Functions, Composition and Disorders. 1st ed. New York, Nova Science Publishers, 2012; 1–37.
[9] Haughton VM, Korosec FR, Medow JE, Dolar MT, Iskandar BJ. Peak systolic and diastolic CSF velocity in the foramen magnum in adult patients with Chiari I malformations and in normal control participants. AJNR Am J Neuroradiol 2003; 24:169–76.
Figures