0034
Imaging Left-ventricular Mechanical Activation in Heart Failure Patients using Cine DENSE MRI: Validation and Implications for Cardiac Resynchronization Therapy1Department of Biomedical Engineering, University of Virginia Health System, Charlottesville, VA, United States, 2Medicine/Cardiology/Electrophysiology, University of Virginia Health System, Charlottesville, VA, United States, 3Radiology/Medical Imaging, University of Virginia Health System, Charlottesville, VA, United States
Synopsis
This study developed methods for imaging left-ventricular (LV) mechanical activation, with application to identifying optimal LV pacing sites for cardiac resynchronization therapy (CRT). Cine displacement encoding with stimulated echoes (DENSE) was used for strain imaging, and mechanical activation time was defined as the time of onset of circumferential shortening (TOS). Active contours were applied to strain data to automatically compute TOS. Results showed a strong correlation between TOS and electrical activation time, heterogeneity of the location of latest activation, and a significant association between TOS at the LV pacing site and CRT response. These methods may enable improved CRT implementation.
Purpose:
Heart failure (HF) patients referred for cardiac resynchronization therapy (CRT) typically have delayed regional electrical and mechanical activation and dyssynchrony. CRT aims to restore synchrony using bi-ventricular pacing in the right-ventricular apex and left-ventricular (LV) lateral wall. However, using standard implementation methods, the CRT nonresponse rate is 30-50% [1]. A frequent cause of CRT nonresponse is suboptimal positioning of the LV lead, which ideally should be placed in a region with delayed mechanical activation and without myocardial scar [2]. Pre-CRT imaging of mechanical activation and scar may identify optimal LV pacing sites. However, there is variability in defining mechanical activation time, with some studies using the time to peak strain (TPS) [3] and some using the time to the onset of circumferential shortening (TOS) [4]. We developed improved methods for imaging mechanical activation and evaluated them in HF patients undergoing CRT.Methods:
Data were acquired from 6 healthy volunteers and 50 HF-LBBB patients (26 with myocardial scar) on a 1.5T MR system. All patients underwent pre-CRT MRI of LV volumes, scar, and strain, and echocardiography was performed before and 6 months after CRT. CRT response was defined as a 15% reduction in LV end-systolic volume at 6 months. Strain data were acquired using cine displacement encoding with stimulated echoes (DENSE) and circumferential strain (Ecc) was computed using previously described methods [5, 6]. The spatiotemporal midwall Ecc data were arranged into a 2D matrix consisting of N rows (spatial segments) and M columns (cardiac phases). TPS was defined as the time point where Ecc reached its minimum value, while TOS was defined as the time point where dEcc/dt first becomes negative. An active contour (AC) method was applied to the strain matrix to automatically detect the regional TOS. Overall dyssynchrony was computed using the circumferential uniformity ratio estimate calculated using singular value decomposition (CURE-SVD) [7]. To compare mechanical and electrical activation time, during CRT implementation the electrical activation time (Q-LV) was recorded at the LV lead implantation site. Registration methods were used to match the LV lead position on fluoroscopy and MRI [8].Results:
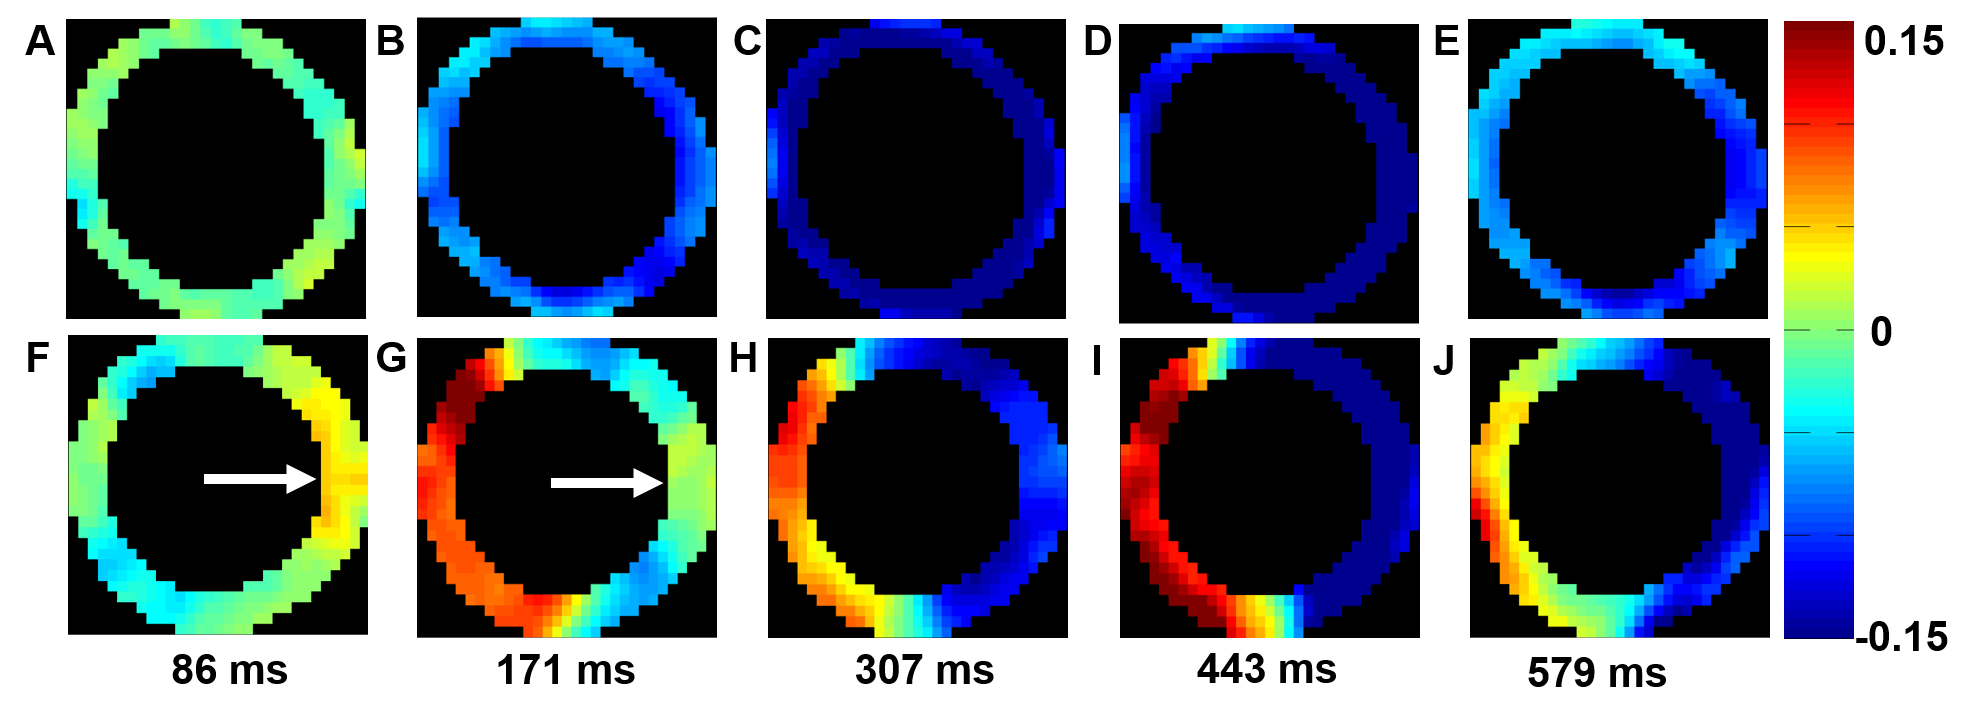
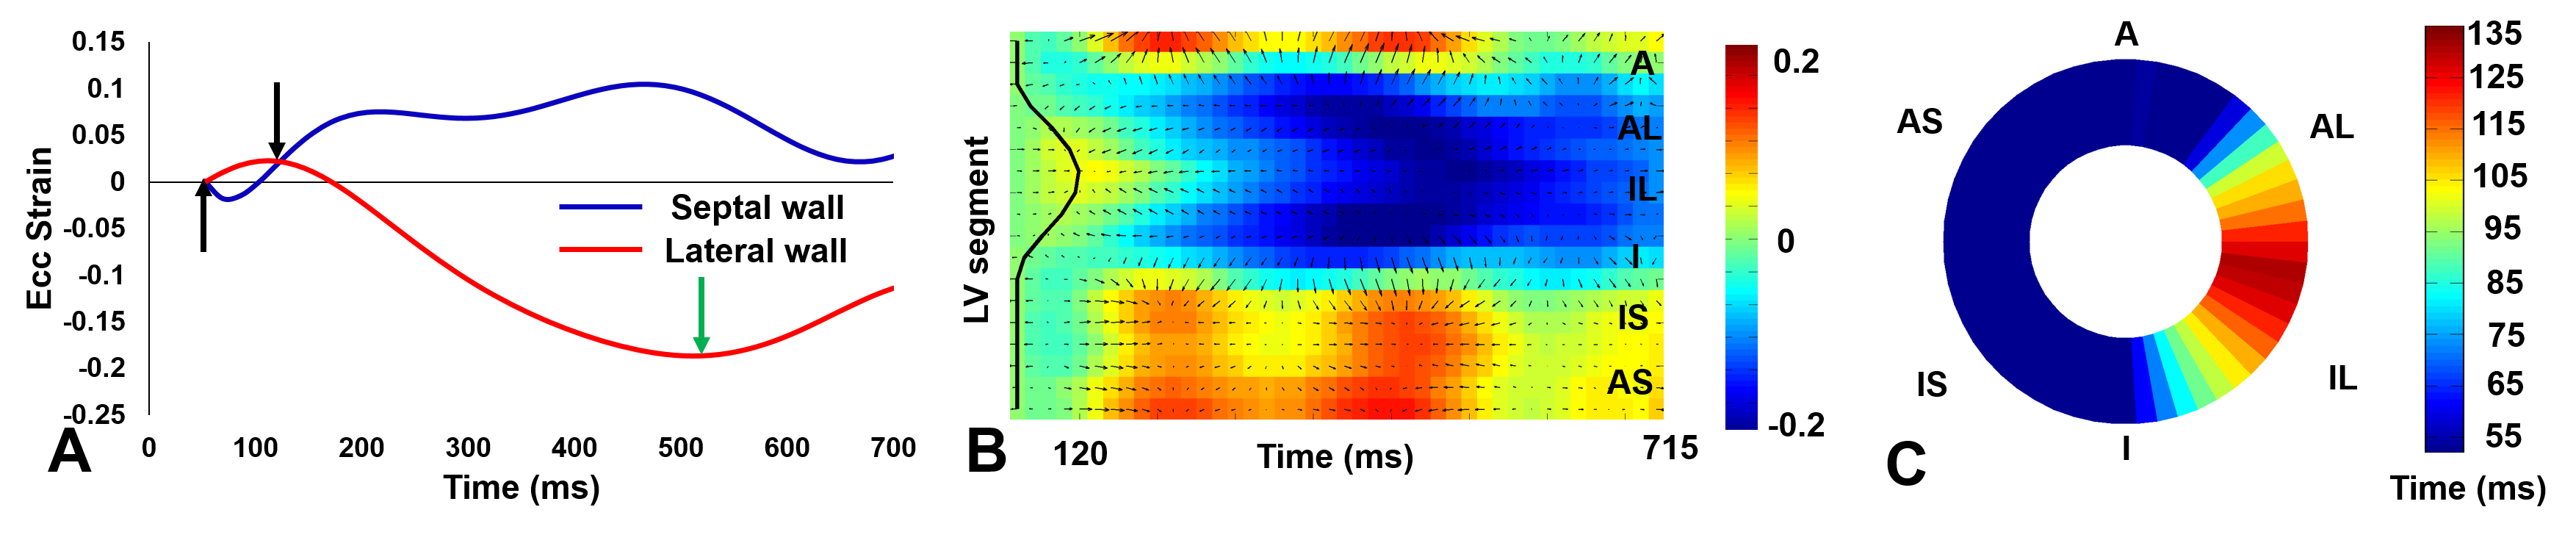
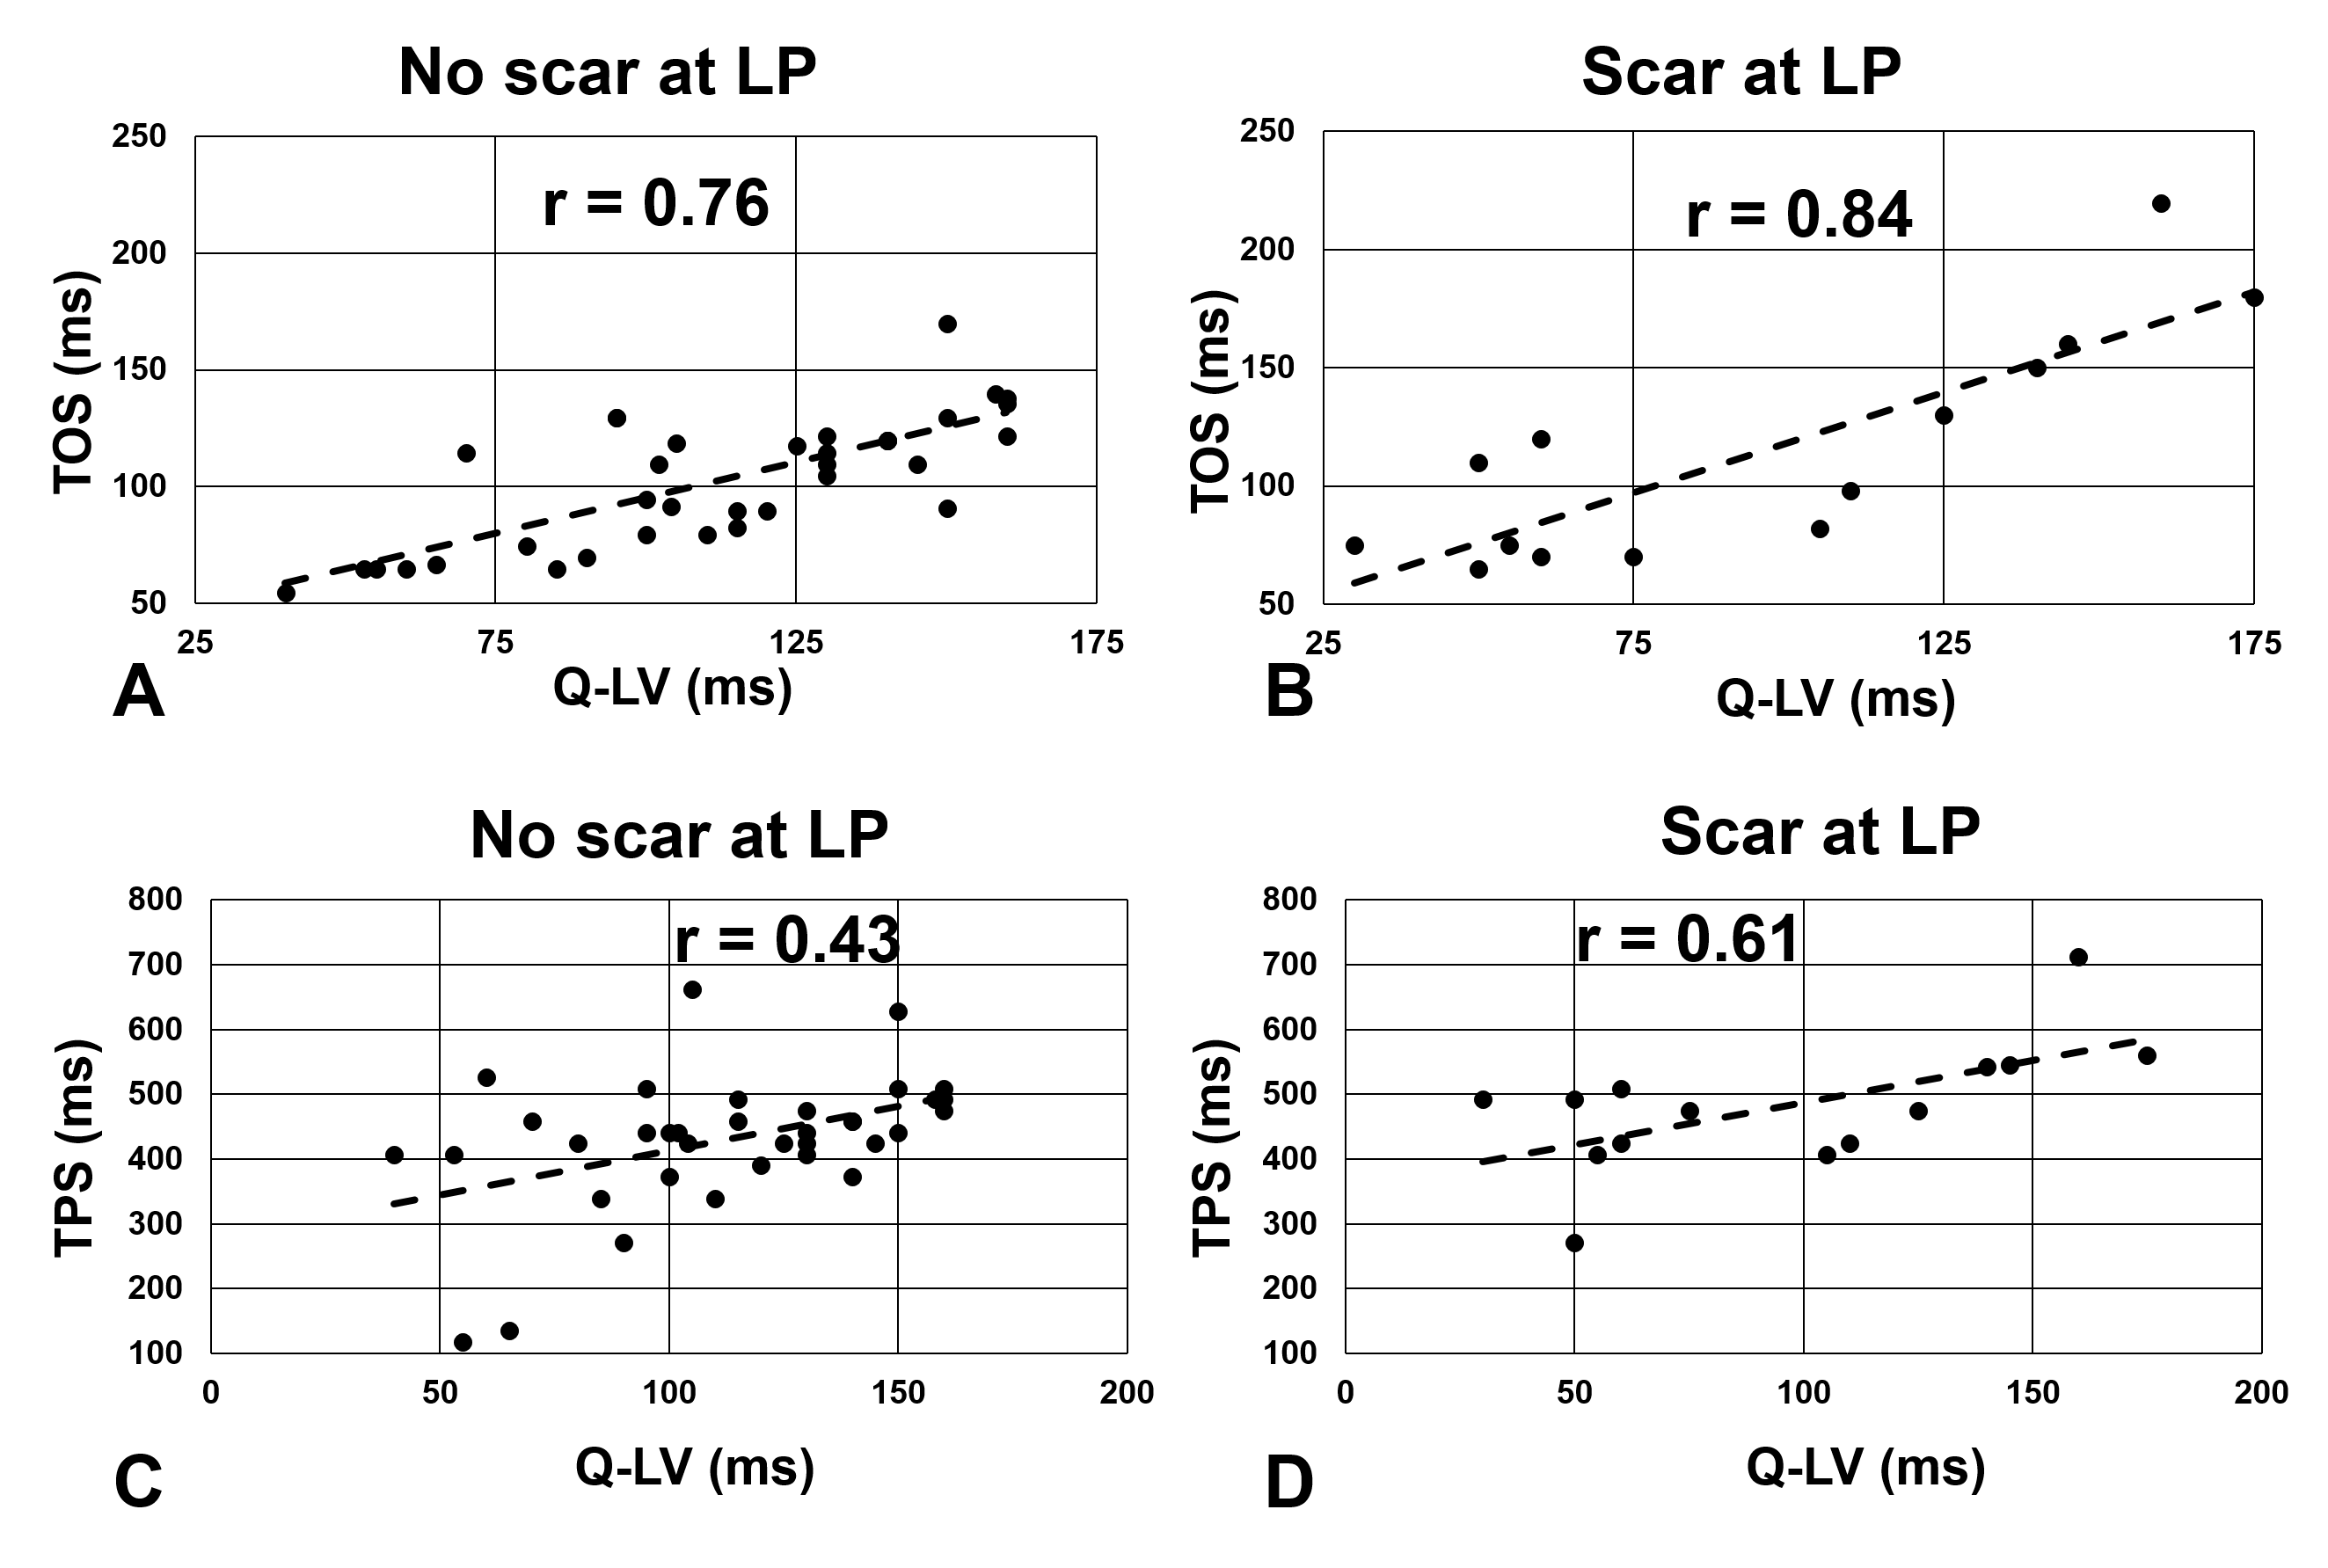
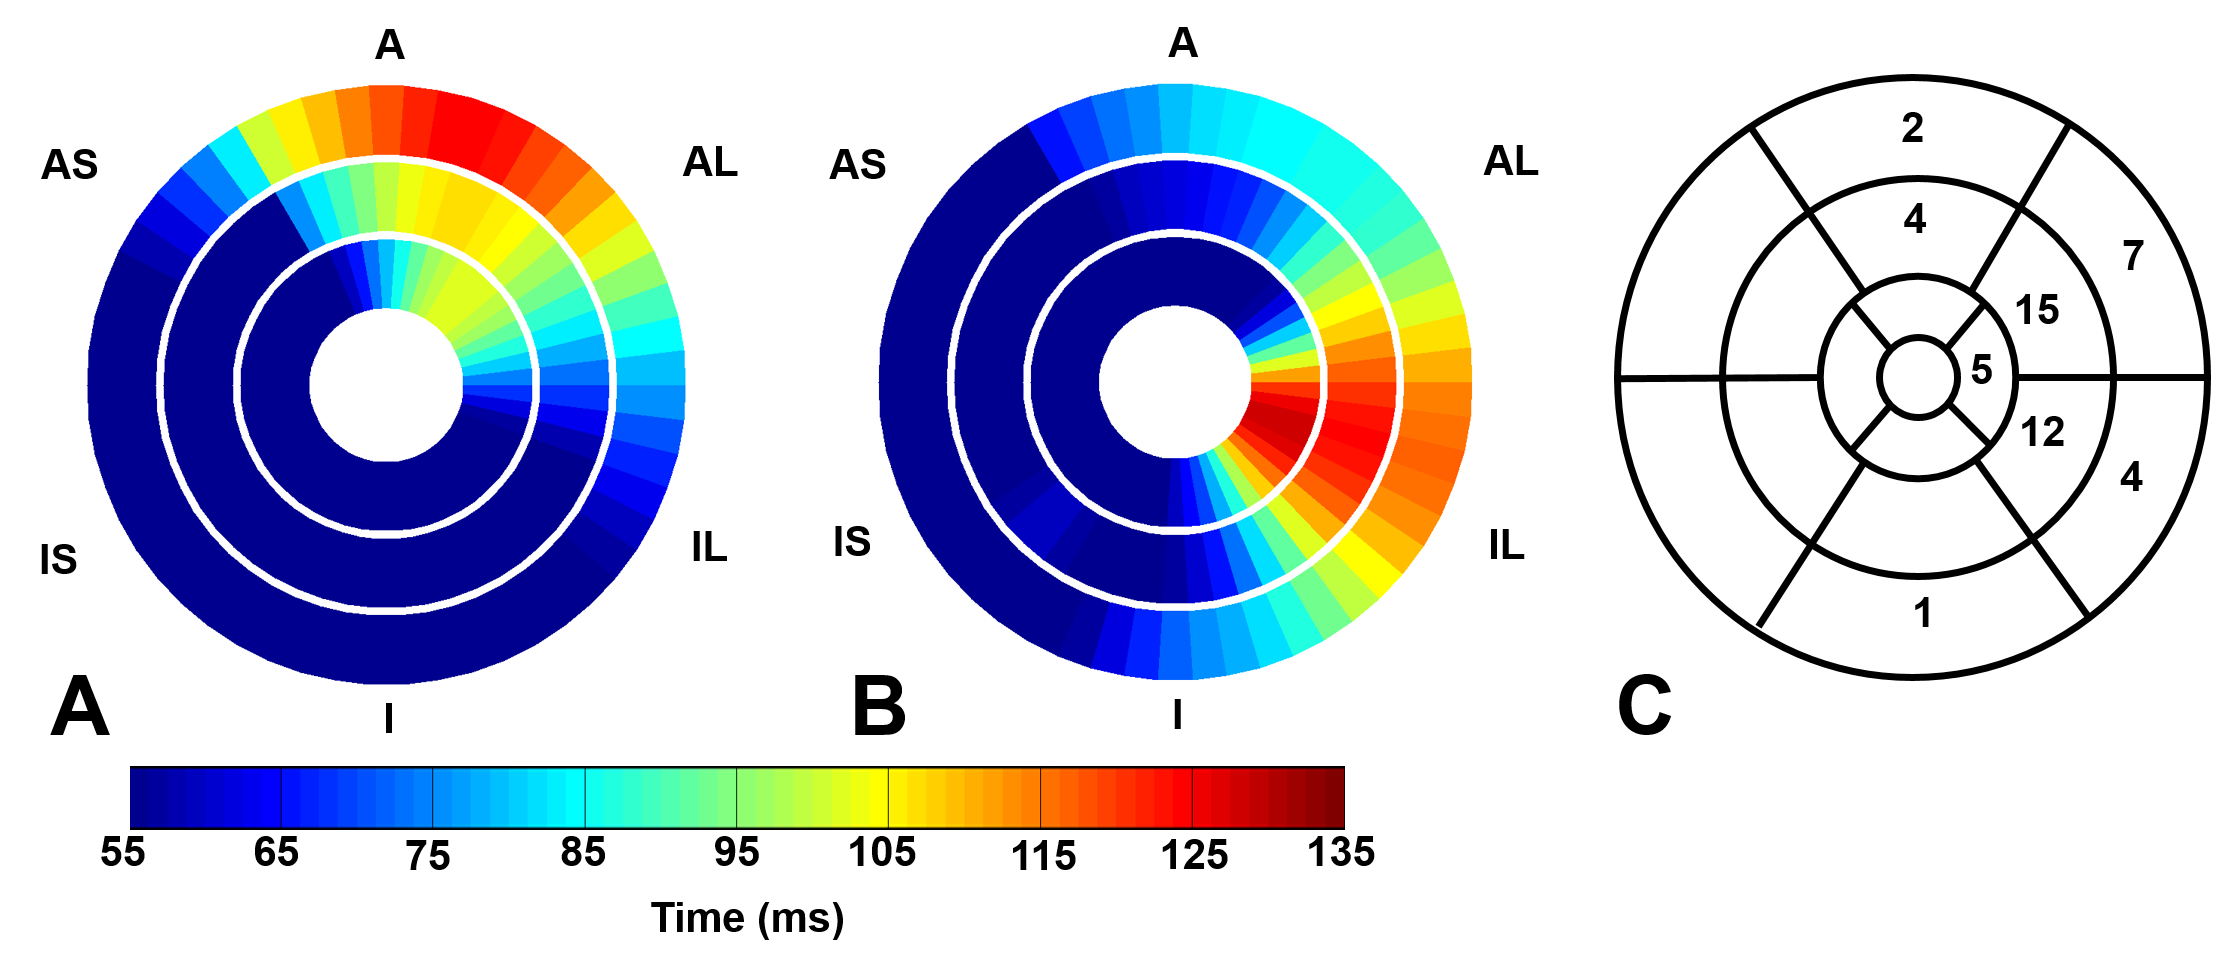
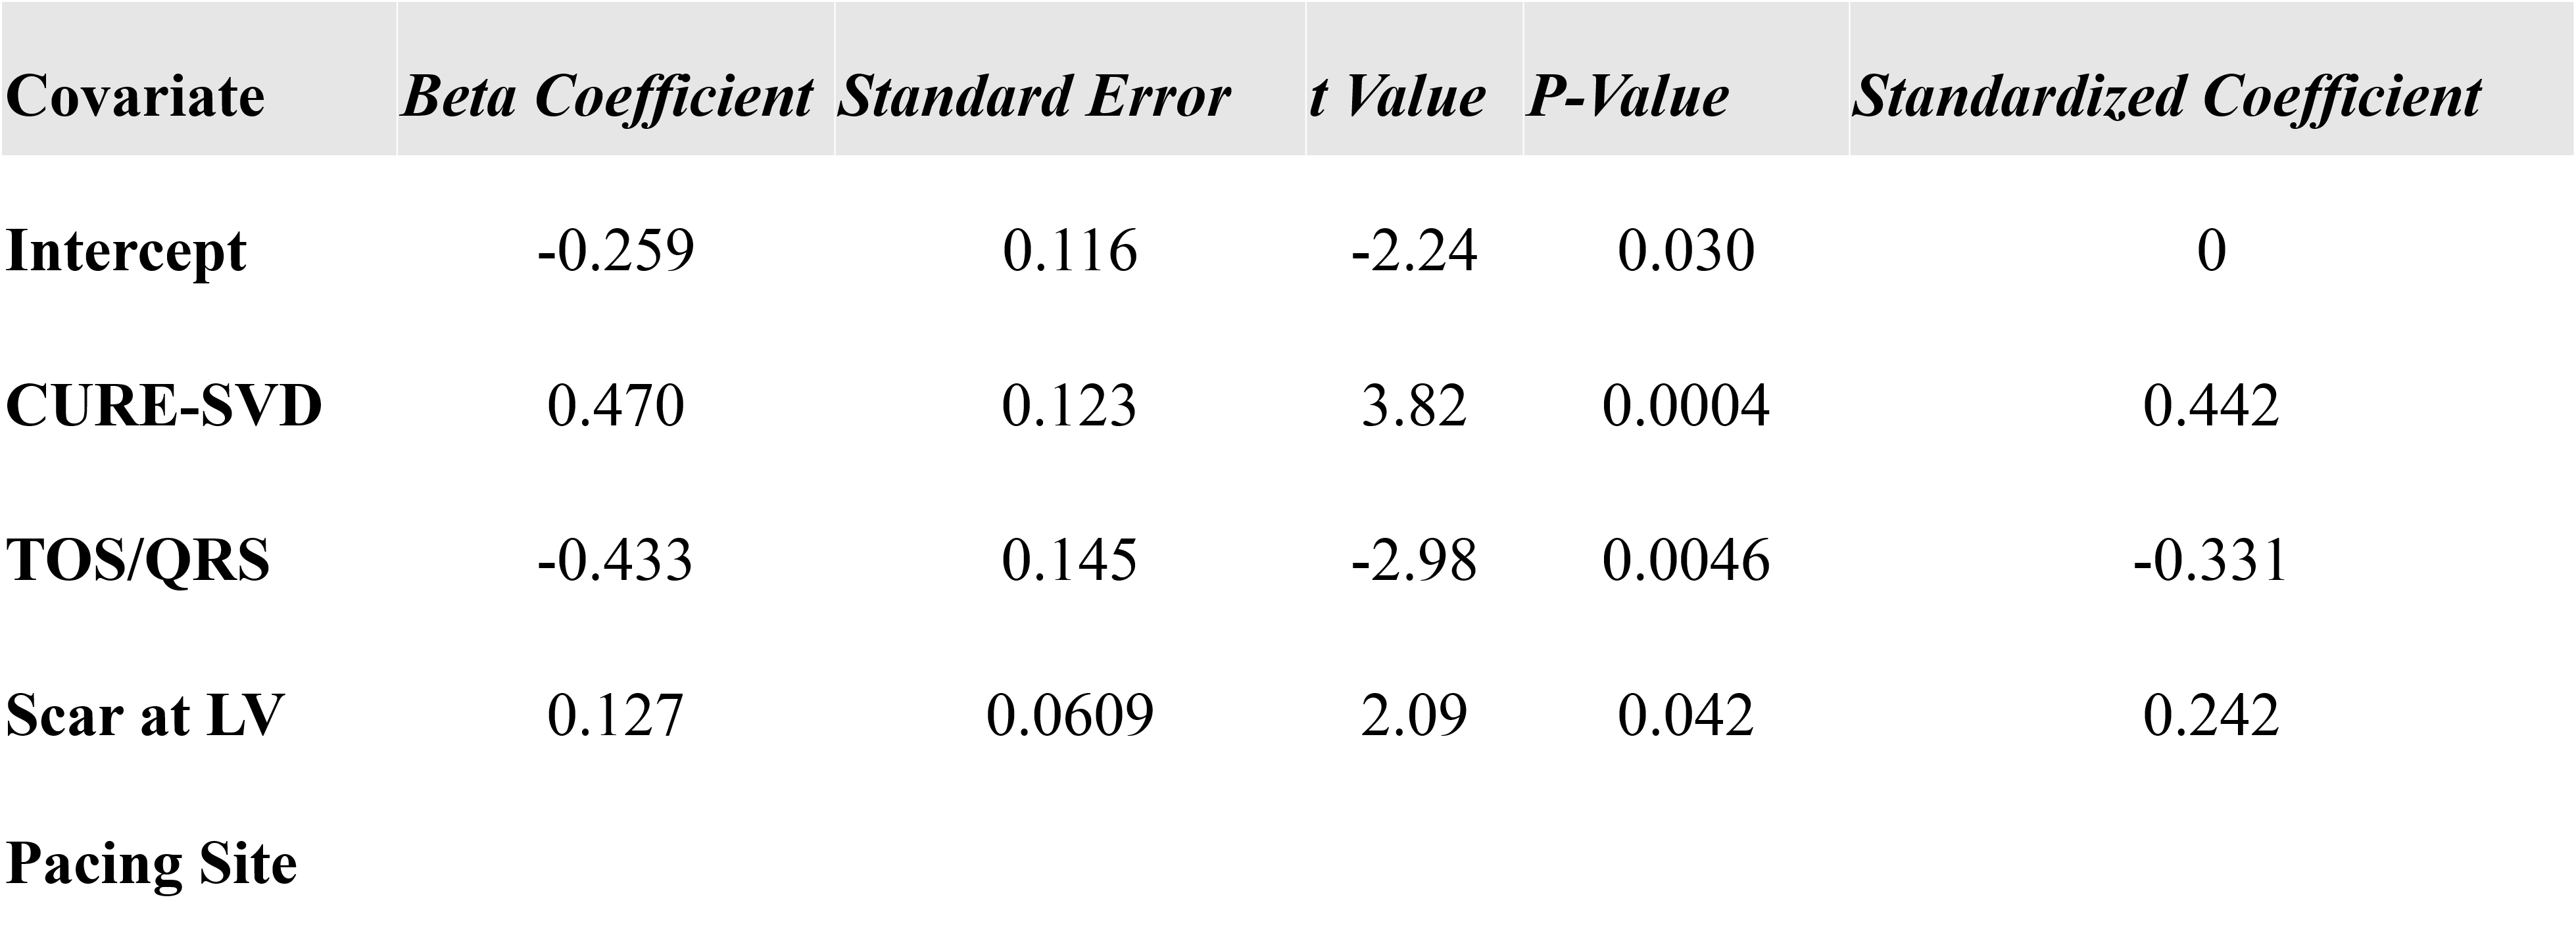
Fig. 1 illustrates cine DENSE strain data in a healthy volunteer (A-E) and a HF-LBBB patient (F-J), with (F-J) illustrating mechanical dyssynchrony and delayed mechanical activation. Fig. 2(A) illustrates the definitions of TPS and TOS, and Fig. 2(B) shows a HF-LBBB Ecc matrix and the AC depicting regions of early and delayed TOS. Fig. 2(C) shows the corresponding DENSE mechanical activation time map. The latest TOS was greater in HF patients vs. healthy subjects (112±28 msec vs. 61±7 msec, P<0.01). Fig. 3(A-D) shows the correlations between Q-LV and the mechanical activation time parameters, TOS (A, B) and TPS (C, D). The plots show strong correlations between TOS and Q-LV when the LV lead was placed in either regions of no scar (r=0.76, P<0.001) or scar (r=0.84, P<0.001), and weaker correlations between TPS and Q-LV. We further observed that the slope of the regression line for TOS vs. Q-LV is greater when the lead is placed in regions with scar. Fig. 4(A, B) shows example bull’s-eye plots for multi-slice TOS maps indicating variation in the location of the latest mechanically activated segment in different patients. Fig. 4(C) shows the spatial distribution of latest activating segments for all patients. In 25% of patients, the LV lead was placed in a region with less than 60% of the maximal delay, and in 50% of patients, the LV lead was placed in a region with less than 80% of the maximal delay. Table 1 shows results of a multivariable linear regression model for parameters with significant associations with CRT response. Overall dyssynchrony, scar, and TOS/QRS were predictors of CRT response, while TPS was not (P=0.49).Discussion and Conclusions:
This study showed that TOS can be measured noninvasively using ACs applied to cine DENSE strain data from HF-LBBB patients. TOS correlates strongly with Q-LV at the LV pacing site, and in regions of scar there is a greater mechanical delay between TOS and Q-LV, consistent with a scar-mediated delay in electromechanical coupling. There is substantial heterogeneity in the location of the latest activating region, and in many patients, using standard CRT methods, the LV lead is placed in an area with significantly less than the maximal mechanical delay. Late activation at the LV lead position by cine DENSE TOS analysis is associated with improved CRT response after adjusting for overall dyssynchrony and scar. Pre-CRT cine DENSE TOS mapping may allow for optimal planning and possibly improved effectiveness of CRT.Acknowledgements
AHA Grant-in-Aid 12GRNT12050301, Siemens Medical Solutions, NIH RO1 EB 001763References
1. Chung ES, Leon AR, Tavazzi L, Sun JP, et al. Results of the Predictors of Response to CRT (PROSPECT) trial. Circulation, 2008; 117:2608-16.
2. Bilchick KC, Kuruvilla S, Hamirani Y, et al. Impact of mechanical activation, scar, and electrical timing on cardiac resynchronization therapy response and clinical outcomes. JACC, 2014; 63:1657–66
3. Saba S, Marek J, Schwartzman D et al. Echocardiography-guided left ventricular lead placement for cardiac resynchronization therapy: results of the Speckle Tracking Assisted Resynchronization Therapy for Electrode Region trial. Circ Heart Fail, 2013; 6:427-34.
4. Wyman BT, Hunter WC, Prinzen FW, et al. Mapping propagation of mechanical activation in the paced heart with MRI tagging. Am J of Physio-Heart and Circ Physio, 1999; 276:881-91
5. Kim D, Gilson WD, Kramer CM, et al. Myocardial Tissue Tracking with Two-dimensional Cine Displacement-encoded MR Imaging: Development and Initial Evaluation. Radiology, 2004; 230:862-71.
6. Spottiswoode BS, Zhong X, Hess A, et al. Tracking myocardial motion from cine DENSE images using spatiotemporal phase unwrapping and temporal fitting. MIA, 2009; 13:105–15.
7. Ramachandran R, Chen X, Kramer CM, et al. Singular Value Decomposition Applied to Cardiac Strain from MR Imaging for Selection of Optimal Cardiac Resynchronization Therapy Candidates. Radiology 2015; 275:413-20.
8. Albertsen AE, Nielsen JC, Pedersen AK, et al. Left ventricular lead performance in cardiac resynchronization therapy: impact of lead localization and complications. Pacing Clin Electrophysiol, 2005; 28:483-88.
Figures