0032
Direct Quantitative 13C-Filtered 1H Magnetic Resonance Imaging of PEGylated Biomacromolecules In Vivo1Department of Chemistry, University of Toronto, Toronto, ON, Canada, 2Department of Medical Biophysics, University of Toronto, Toronto, ON, Canada, 3Sunnybrook Research Institute, Toronto, ON, Canada, 4Department of Biochemistry, University of Toronto, Toronto, ON, Canada
Synopsis
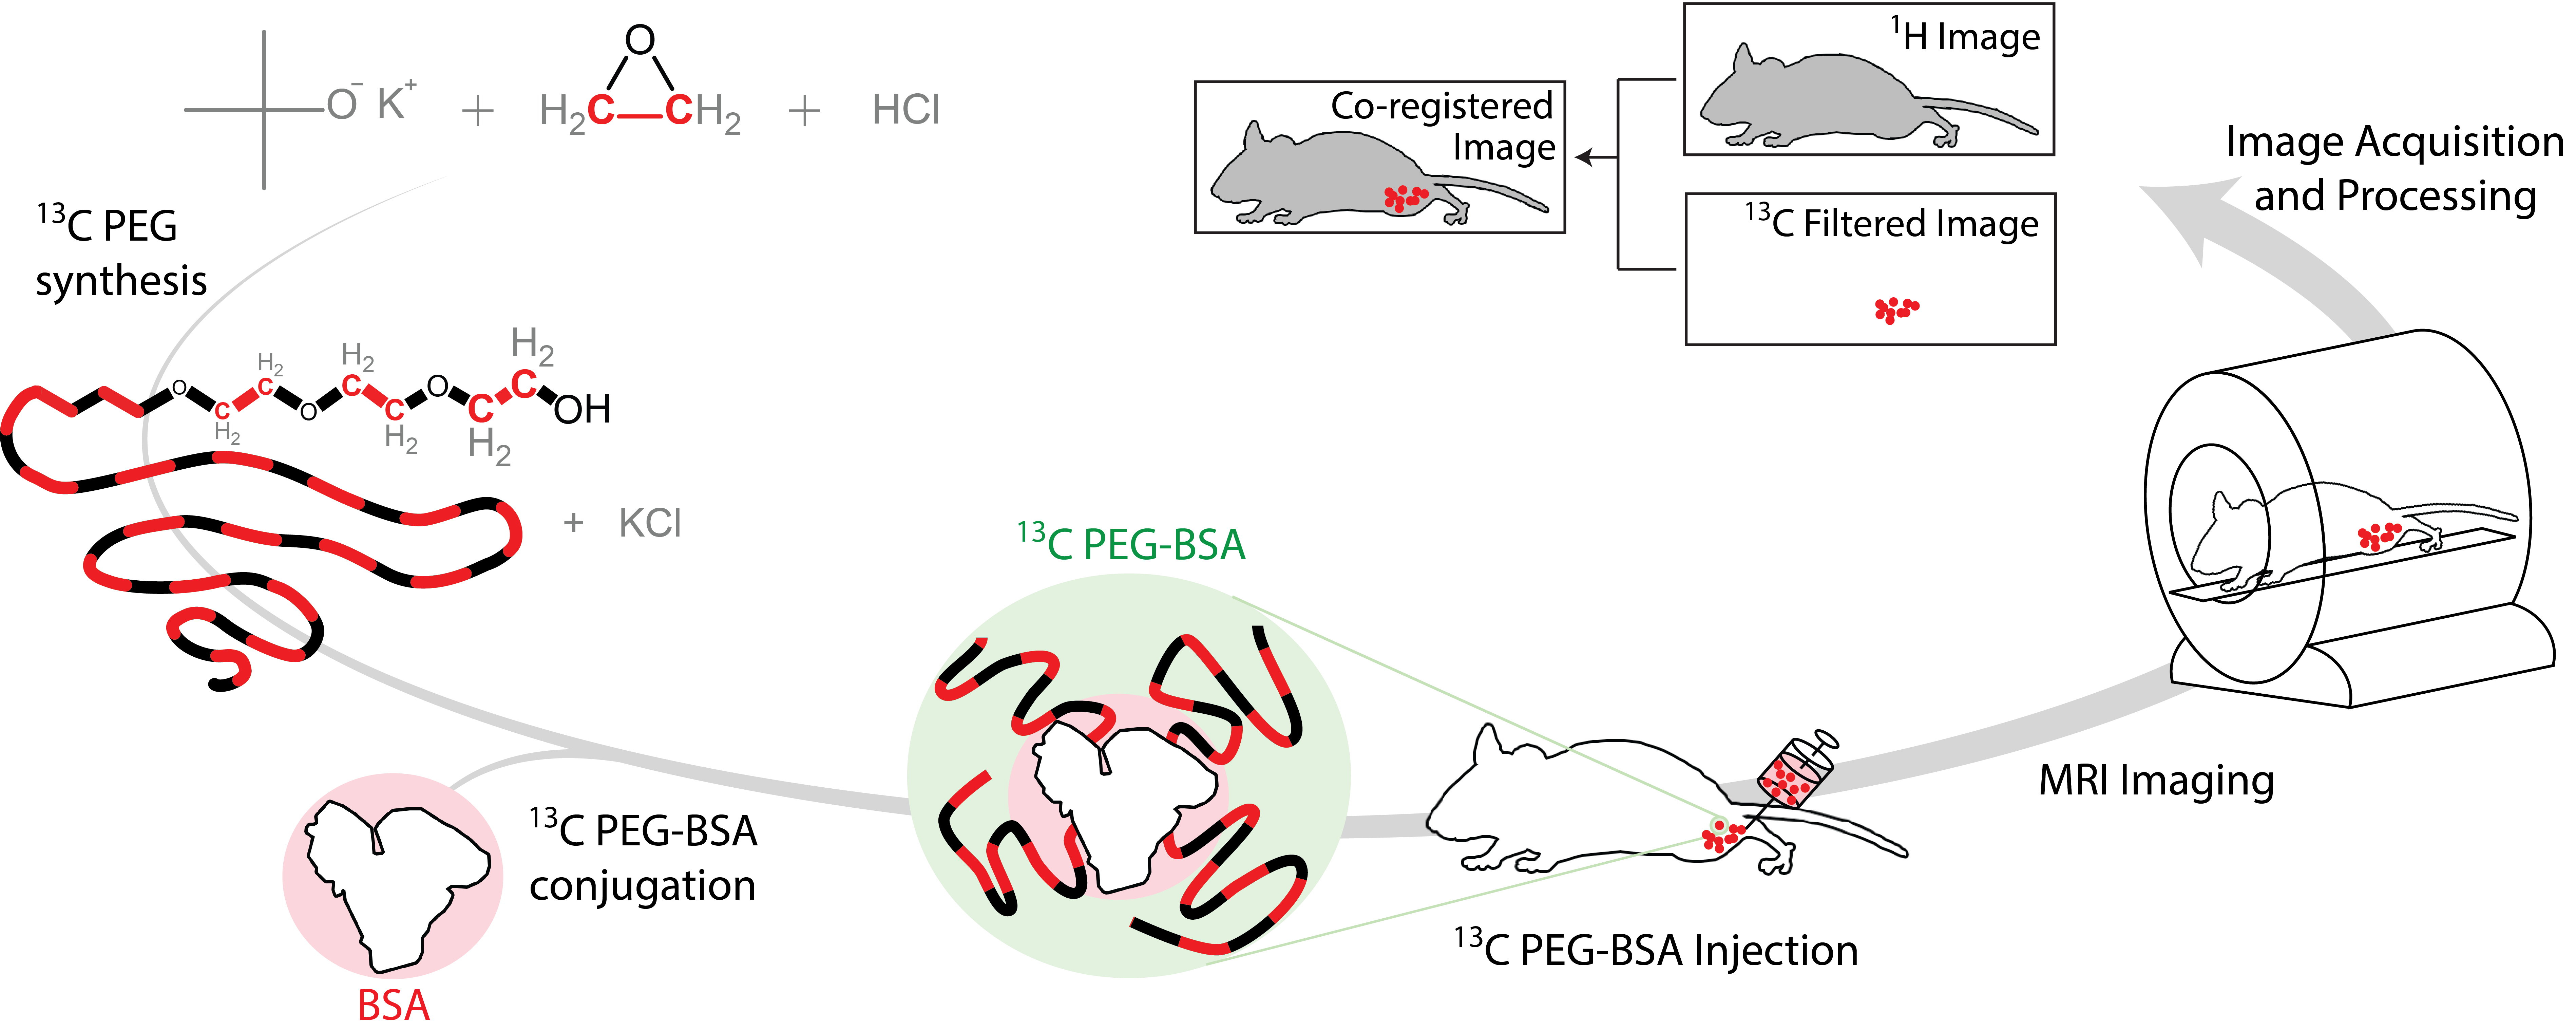
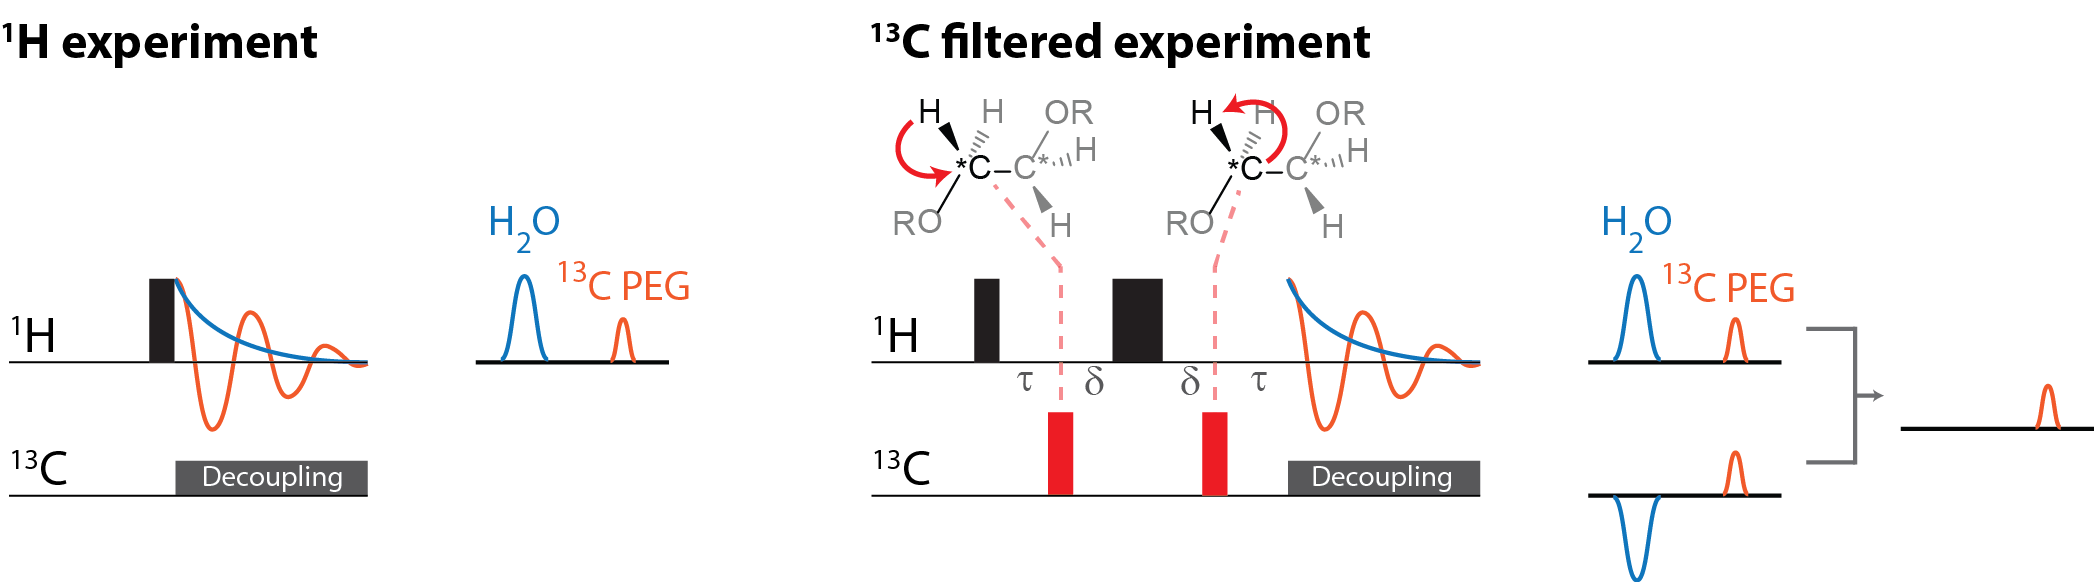
We demonstrate a new platform technology in which macromolecular constituents, such as proteins and drug delivery systems, are observed directly and quantitatively in vivo using 1H MRI of 13C-labeled polyethylene glycol (13C-PEG) tags. The 28 kDa 13C-PEG tags are non-immunogenic, and each bears approximately 2500 spectroscopically equivalent 1H nuclei appearing at a single resonance position. By filtering the 1H PEG signal through the directly coupled 13C nuclei, background water and fat signals are largely eliminated. We demonstrate the approach by monitoring in real-time the distribution of 13C-PEG and 13C-pegylated albumin injected into the hind leg of a mouse.
Introduction:
Direct in vivo detection and quantitation of specific molecules, metabolites or macromolecules by MRI methods at concentrations below the millimolar range is difficult.1 One option is to tag the species of interest with a relaxation reagent which acts to modify the 1H signal of water in its vicinity.2–5 While sensitivity is enhanced in the presence of such contrast agents, detection is indirect and quantitation of the biomolecule of interest is complicated by the range of factors and conditions which influence the degree of contrast produced in the local water signal.6 In this study, we demonstrate the use of uniformly-labelled 13C-poly(ethylene glycol) (13C-PEG) tags to directly and quantitatively detect biomolecule biodistribution by 1H MRI at concentrations in the low micromolar rangeMethods:
13C PEG synthesis. 13C-labelled PEG (27.6 kDa) was synthesized by anionic ring opening polymerization of 13C-labelled ethylene oxide7 (Sigma Aldrich) using inert techniques.8 The labelled protein, 13C-PEG-BSA, was synthesized by converting the PEG alcohol end groups to aldehydes which were then conjugated to BSA Nα amino groups and lysine residues using reductive amination.9
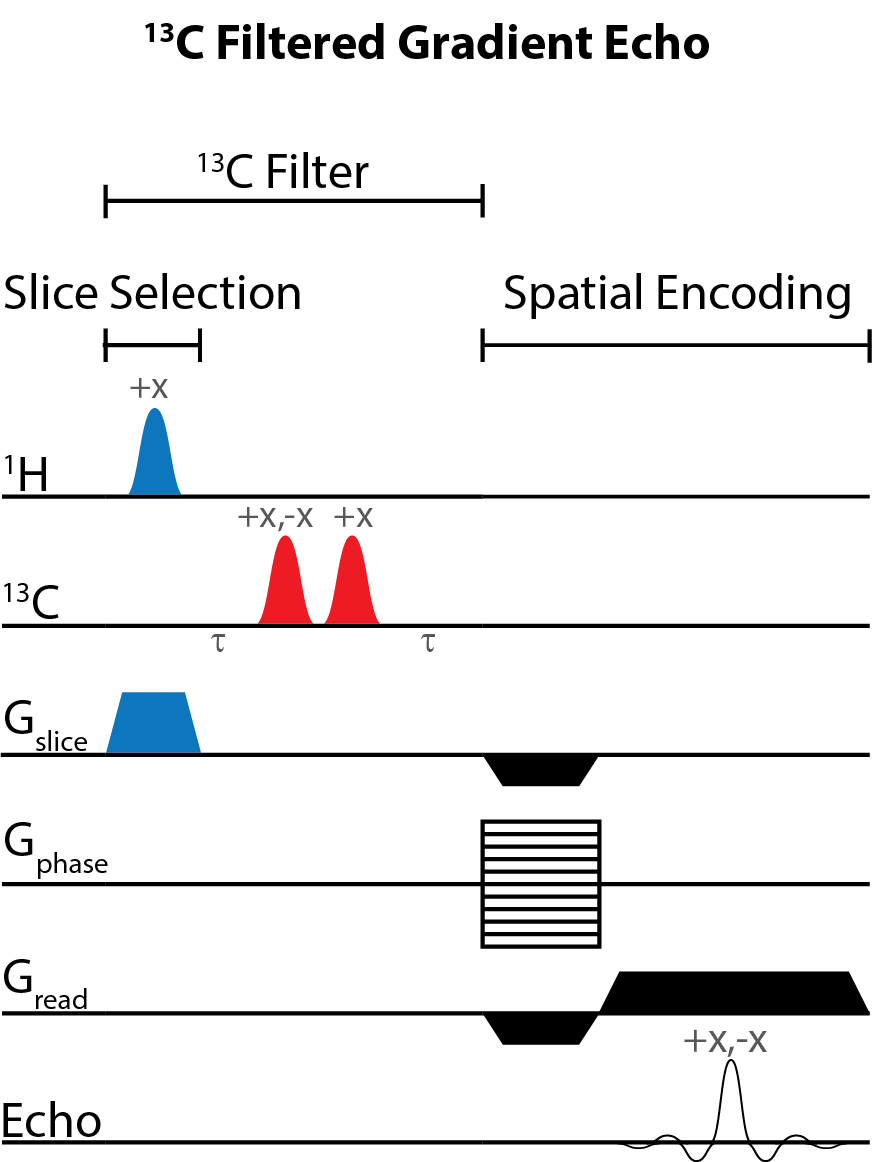
Imaging. Experiments involving animals were performed in accordance with institutional animal care protocols. Imaging experiments were carried out using a Bruker BioSpec 70/30 USR 7 Tesla small animal system with a dual-tuned 1H/13C volume mouse coil (RAPID MR International). Sensitivity limits were determined in 30% poly(acrylamide gel) phantoms with the 13C PEG concentrations varied between 0 – 500 µM. 13C-Filtered images were acquired using a spoiled gradient echo (FLASH) sequence10 modified with a slice-selective 13C filter (HFLASH sequence). Axial images were acquired with the following parameters: 8 × 8 cm FOV, 4 mm slice thickness, 64 × 64 acquisition matrix, 100 ms TR, 6.9 ms TE, 1 ms sinc 1H 44° pulse, 1.37 ms Gaussian 13C 90° pulses, 1 dummy scans, and 10 – 200 transients, depending on 13C-PEG concentration. In vivo experiments were conducted by injecting 13C-PEG (4.1 mM; 50 µL; saline) and 13C-PEG-BSA (2.4 mM; 50 µL; saline) solutions into the hind legs of separate adult male BALB/cJ mice. 13C-filtered images were acquired similar to the phantom experiments above except with a 32 × 32 acquisition matrix, 50 averaged transients, and 10 dummy scans.
Results:
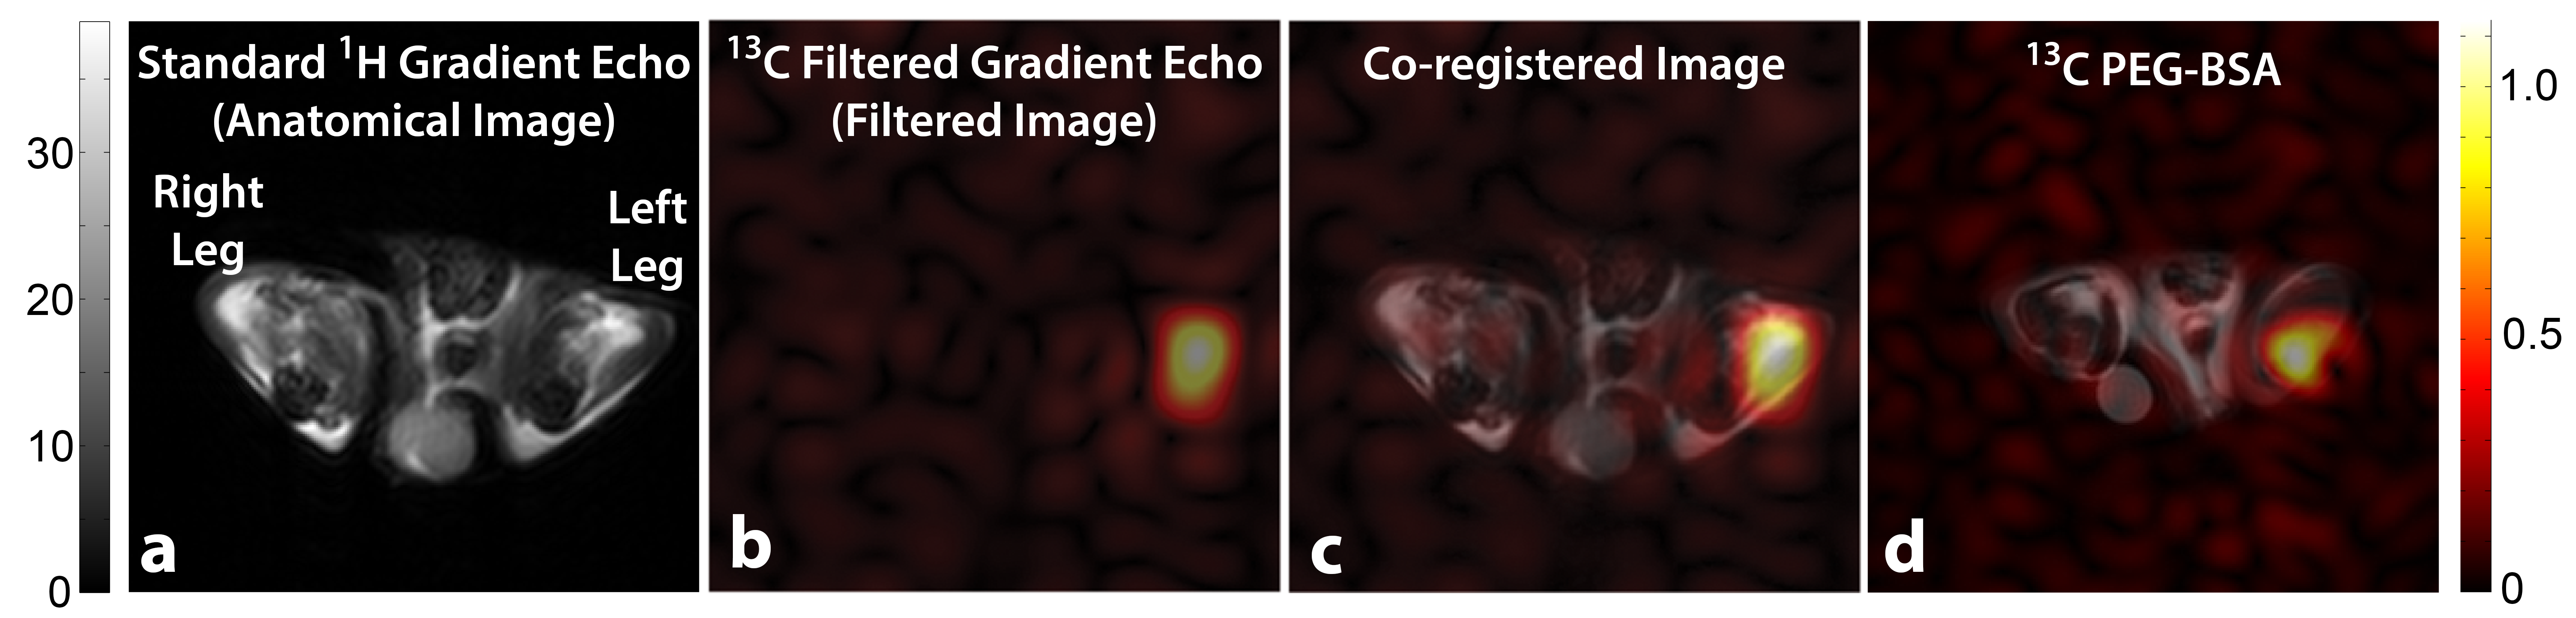
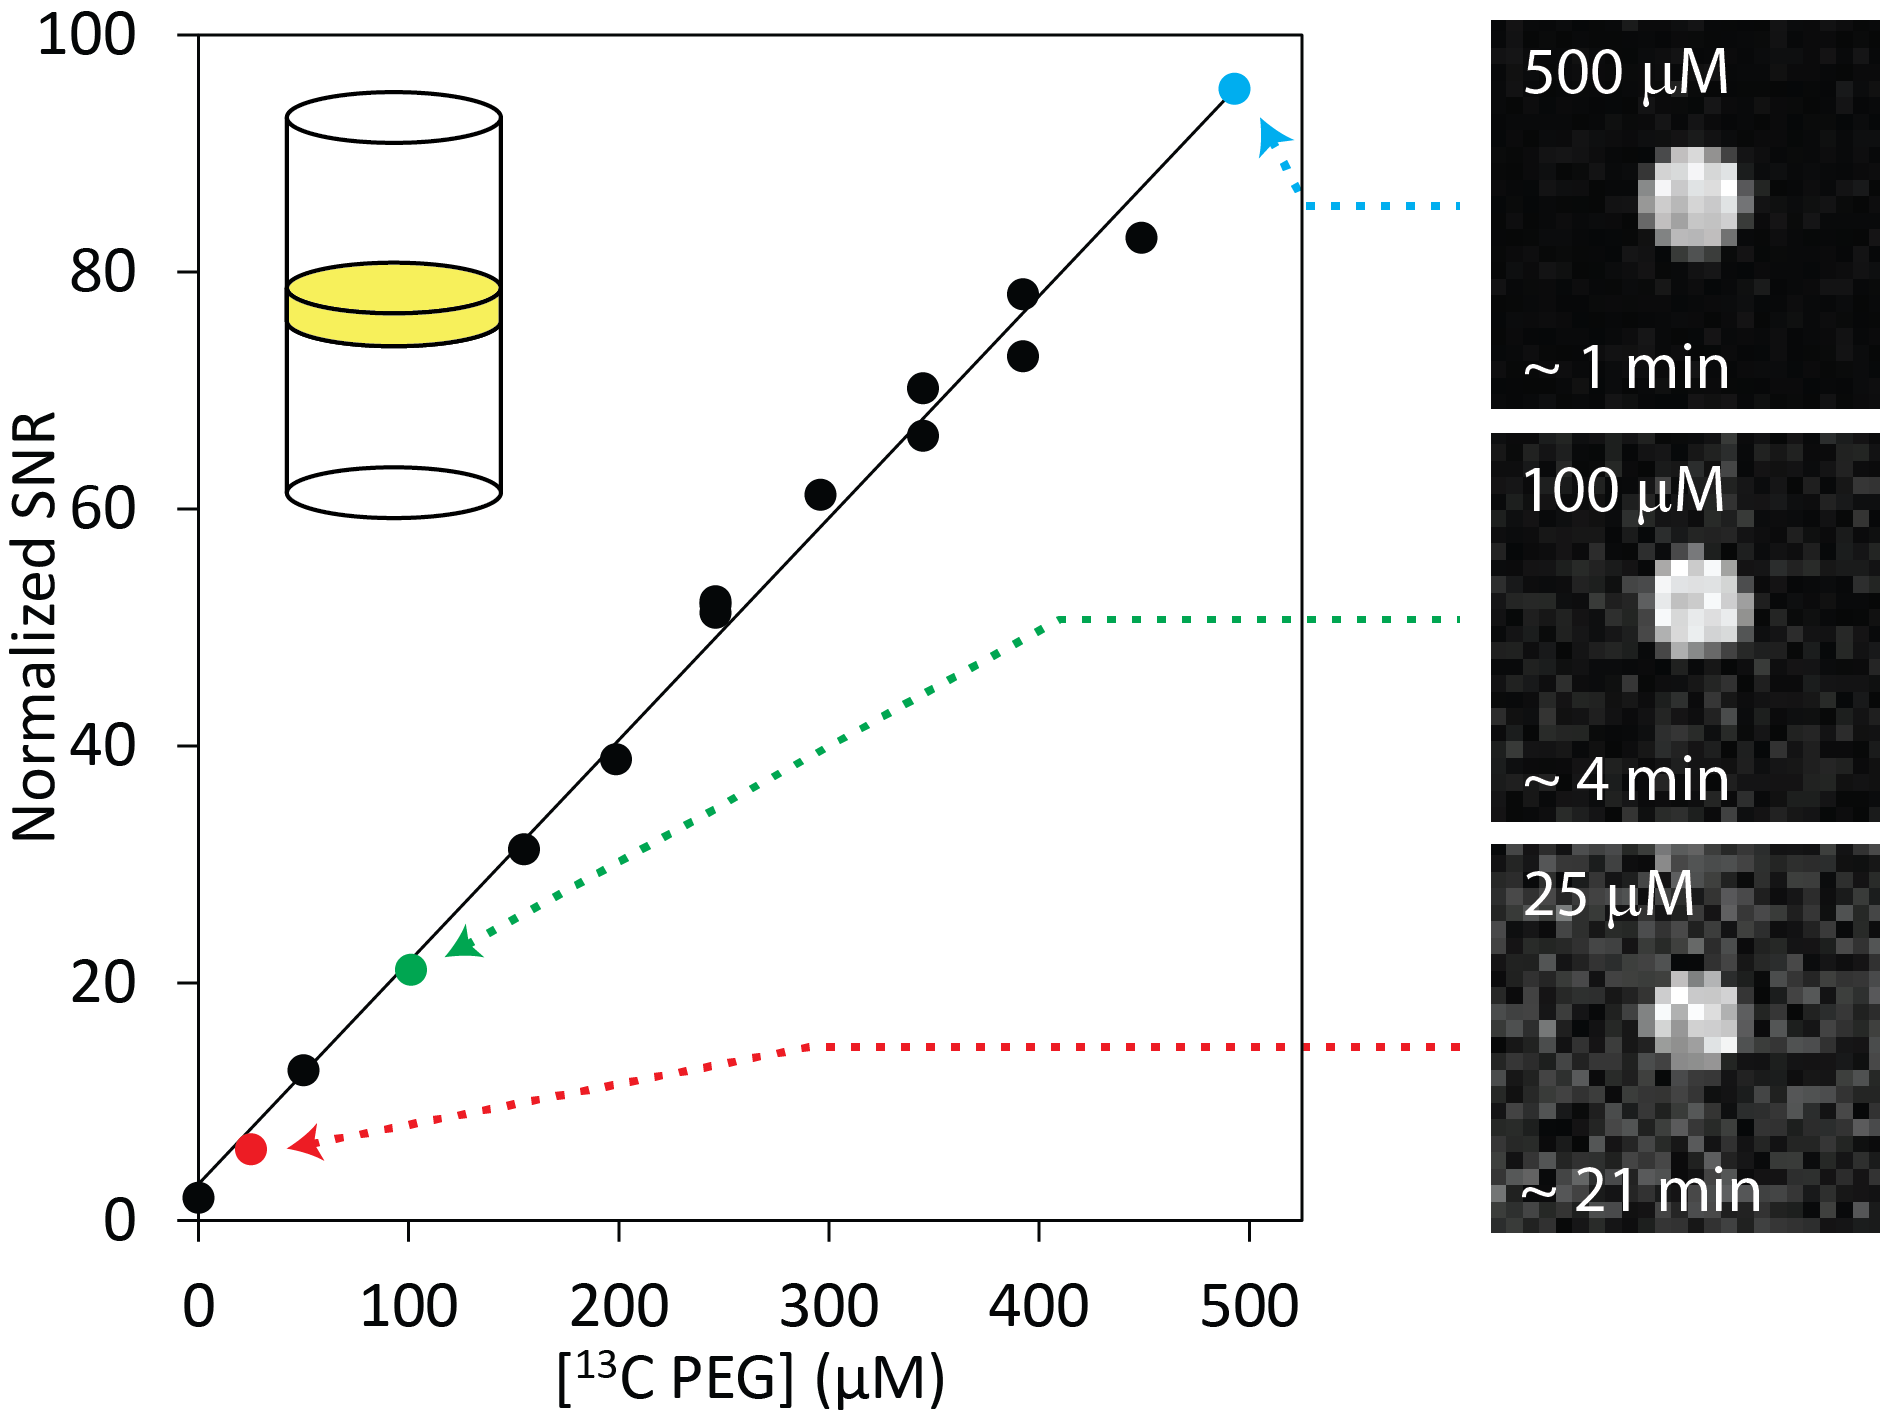
Figure 1 illustrates the general approach developed to demonstrate the feasibility of direct 1H MRI of 13C-pegylated macromolecules. The 13C-filtering step is based on the heteronuclear multiple-quantum coherence (HMQC) technique, as illustrated schematically in Figure 2, while the scheme for implementing the HMQC filter within a 1H MRI sequence is illustrated in Figure 3. To demonstrate the potential of in vivo 13C-filtered direct 1H MRI of 13C-PEG, images were obtained from mice after intravenous injections of either free 13C-PEG (Figure 4 a-c) or 13C-PEG-BSA (Figure 4d). Figure 4a-c compares anatomical (water), filtered (13C-PEG), and co-registered (superimposed filtered and anatomical) images obtained following administration of 27.6 kDa 13C-PEG into the right leg. Unlabelled PEG of similar size and concentration was injected simultaneously into the left leg. Detection limits were established using known concentrations of 27.6 kDa 13C-PEG in poly(acrylamide) gel phantoms as shown in Figure 5. High concentrations of 13C-PEG (500 µM, 3 nmol in a 6.25 mm3 imaging volume) yielded images with visual quality similar to standard water gradient echo images. Concentrations as low as 25 µM (160 pmol in a 6.25 mm3 imaging volume) were detectable with a contrast/noise ratio (CNR) of 6.0 in ~ 21 minutes.Discussion:
We have demonstrated here a new 1H MRI approach to detect and quantify biomacromolecular constituents in vivo based on using 13C-PEG tags. Pegylation is now the norm in antibody-drug conjugates, therapeutic proteins, antibodies, aptamers, and many drug delivery systems, because it is non-immunogenic, tends to prolong retention of the macromolecule of interest in the desired tissue, confers stability, and helps avoid renal filtration, opsonisation and consequent phagocytic clearance.11–13 PEG itself also represents an ideal candidate for detection via 1H MRI. With four spectroscopically equivalent protons per ethylene oxide monomer unit, a single PEG tag has the potential to yield a signal amplification of 4N where N is the degree of polymerization: for a 28 kDa PEG tag, N≈640. Furthermore, virtually all the signal from the PEG tags appears under a single, narrow 1H resonance line, and its resonance appears at a 1H chemical shift distinct from that of water or fat.Conclusion:
The current study demonstrates that in vivo pegylated protein concentrations may be quantitatively studied by 1H MRI and that biodistribution can be monitored in real time over the course of many hours.Acknowledgements
R. S. Prosser and P.M. Macdonald acknowledge NSERC Canada for Discovery Awards.References
(1) Cassidy, P. J.; Radda, G. K. J. R. Soc. Interface 2005, 2 (3), 133–144.
(2) Louie, A. Y.; Hüber, M. M.; Ahrens, E. T.; Rothbächer, U.; Moats, R.; Jacobs, R. E.; Fraser, S. E.; Meade, T. J. Nat. Biotechnol. 2000, 18 (3), 321–325.
(3) Weissleder, R.; Moore, A.; Mahmood, U.; Bhorade, R.; Benveniste, H.; Chiocca, E. A.; Basilion, J. P. Nat. Med. 2000, 6 (3), 351–354.
(4) Genove, G.; DeMarco, U.; Xu, H.; Goins, W. F.; Ahrens, E. T. Nat. Med. 2005, 11 (43), 450–454.
(5) Zhao, M.; Beauregard, D. A.; Loizou, L.; Davletov, B.; Brindle, K. M. Nat. Med. 2001, 7 (11), 1241–1244.
(6) Caravan, P. Chem. Soc. Rev. 2006, 35 (6), 512–523.
(7) Price, C. C.; Carmelite, D. D. J. Am. Chem. Soc. 1966, 88 (17), 4039–4044.
(8) Ndoni, S.; Papadakis, C. M.; Bates, F. S.; Almdal, K. Rev. Sci. Instrum. 1995, 66 (2), 1090.
(9) Borch, R. F.; Bernstein, M. D.; Durst, H. D. J. Am. Chem. Soc. 1971, 93 (12), 2897–2904.
(10) Haase, A.; Frahm, J.; Matthaei, D.; Hanicke, W.; Merboldt, K.-D. J. Magn. Reson. 1986, 67 (2), 258–266.
(11) Chan, A. C.; Carter, P. J. Nat. Rev. Immunol. 2010, 10 (5), 301–316.
(12) Ginn, C.; Khalili, H.; Lever, R.; Brocchini, S. Future Med. Chem. 2014, 6 (16), 1829–1846.
(13) Veronese, P. F. M.; Mero, A. BioDrugs 2008, 22 (5), 315–329.
Figures